Deck 20: Multiple Regression
Full screen (f)
Question
Consider the following to answer the question(s) below:
National birth rates (births per 1,000) may be influenced by the average national life expectancy in years and the national literacy rate (% of population that can read and write). Data for 49 countries were obtained and the regression results follow.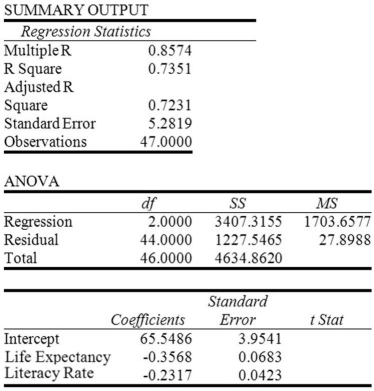
The calculated F-statistic to determine the overall significance of the estimated multiple regression model is
A) 61.07.
B) 16.58.
C) 5.23.
D) 5.47.
E) 0.8574.
Question
Question
Consider the following to answer the question(s) below:
In determining the best companies to work for, a number of variables are considered, including size, average annual pay, and turnover rate, etc. Moreover, employee surveys are conducted in order to assess aspects of the organization's culture, such as trust and openness to change. In an attempt to determine what affects turnover rate, a sample of 33 companies was randomly selected and data collected on the average annual bonus and turnover rate (%) for 2015. In addition, a questionnaire was administered to the employees of each company to arrive at a trust index (measured on a scale of 0-100). Below are the multiple regression results.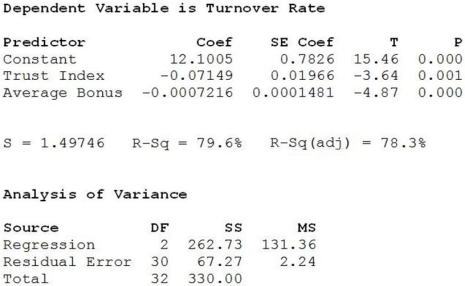
The calculated F-statistic to determine the overall significance of the estimated multiple regression model is
A) 58.64.
B) 1.497.
C) 131.36.
D) 78.3.
E) 2.24.
Question
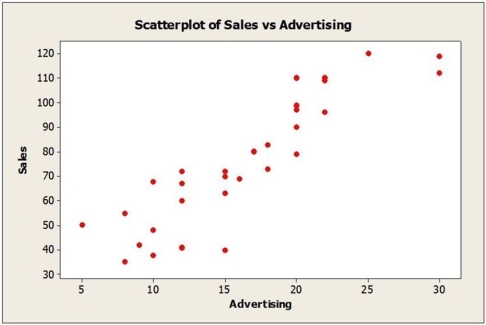
What affects 4K Ultra HD Smart TV sales? TVs are sold through a variety of outlets such as large electronics stores, department stores, large discount chains and online. Sales figures (number of units) for the Samsung 7 Series were obtained for last quarter from a sample of 30 different stores. Also collected were data on the selling price and amount spent on advertising the Samsung 7 Series (as a percentage of total advertising expenditure in the previous quarter) at each store. Below are the multiple regression results. 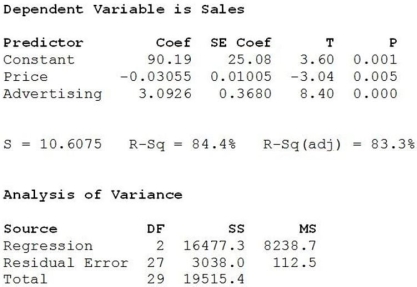 a. Write out the estimated regression equation.
b. Is the regression equation significant overall? Explain.
c. How much of the variability in Sales is explained by the regression equation?
d. State the hypotheses for testing the regression coefficient of Price. Based on the results, what do you conclude at α = .05?
e. State the hypotheses for testing the regression coefficient of Advertising Expenditure. Based on the results, what do you conclude at α = .05?
f. Predict the sales for a store that sells the Samsung 7 Series for $2199 and spends 10% of its advertising budget on the product.
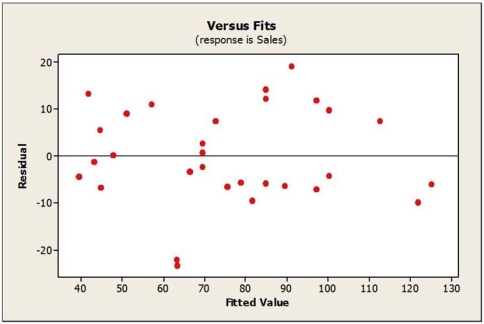
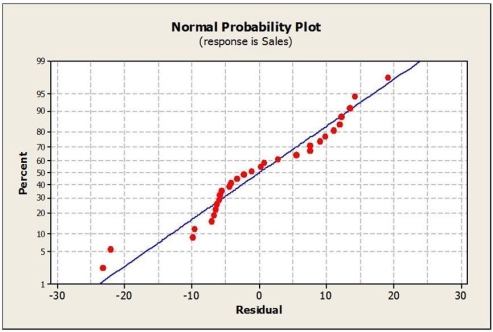
g. Comment on whether the conditions for multiple regression are satisfied based on the plots shown below.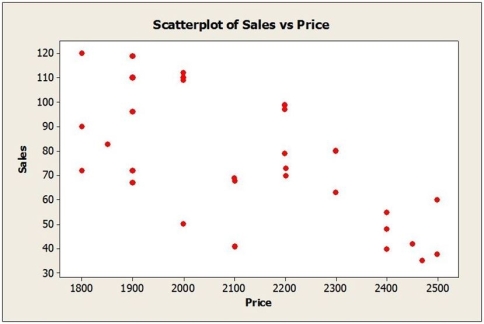
a. Write out the estimated regression equation.b. Is the regression equation significant overall? Explain.
c. How much of the variability in Sales is explained by the regression equation?
d. State the hypotheses for testing the regression coefficient of Price. Based on the results, what do you conclude at α = .05?
e. State the hypotheses for testing the regression coefficient of Advertising Expenditure. Based on the results, what do you conclude at α = .05?
f. Predict the sales for a store that sells the Samsung 7 Series for $2199 and spends 10% of its advertising budget on the product.
g. Comment on whether the conditions for multiple regression are satisfied based on the plots shown below.
Question
Consider the following to answer the question(s) below:
In determining the best companies to work for, a number of variables are considered, including size, average annual pay, and turnover rate, etc. Moreover, employee surveys are conducted in order to assess aspects of the organization's culture, such as trust and openness to change. In an attempt to determine what affects turnover rate, a sample of 33 companies was randomly selected and data collected on the average annual bonus and turnover rate (%) for 2015. In addition, a questionnaire was administered to the employees of each company to arrive at a trust index (measured on a scale of 0-100). Below are the multiple regression results.
The correct null hypotheses for testing the regression coefficient of Trust Index (suppose that it is the first variable)
A) β1 ≠ 0.
B) β1 > 0.
C) β1 = 0.
D) β1 < 0.
E) The regression equation is significant.
Question
Consider the following to answer the question(s) below:
National birth rates (births per 1,000) may be influenced by the average national life expectancy in years and the national literacy rate (% of population that can read and write). Data for 49 countries were obtained and the regression results follow.
How much of the variation in the National Birth Rate can be explained by the regression model?
A) 73.51%
B) 0.7231 %
C) 0.7351%
D) 61.07%
E) 85.74%
Question
Consider the following to answer the question(s) below:
National birth rates (births per 1,000) may be influenced by the average national life expectancy in years and the national literacy rate (% of population that can read and write). Data for 49 countries were obtained and the regression results follow.
The calculated t-statistic to determine if Literacy Rate is a significant independent variable in explaining birth rates is
A) - 5.48.
B) 5.48.
C) 5.23.
D) 61.07.
E) - 5.23.
Question
Consider the following to answer the question(s) below:
National birth rates (births per 1,000) may be influenced by the average national life expectancy in years and the national literacy rate (% of population that can read and write). Data for 49 countries were obtained and the regression results follow.
If an additional explanatory variable was added to the model, what would happen to R2?
A) It would stay the same or increase.
B) It would always decrease.
C) It can decrease.
D) It can become negative.
E) If the coefficient of the additional variable is negative, R2 dramatically decreases.
Question
Consider the following to answer the question(s) below:
What affects 4K Ultra HD Smart TV sales? TVs are sold through a variety of outlets. Sales figures (number of units) for the Samsung 7 Series were obtained for last quarter from a sample of 30 different stores. Also collected were data on the selling price and amount spent on advertising the Samsung 7 Series (as a percentage of total advertising expenditure in the previous quarter) at each store. Below are the results.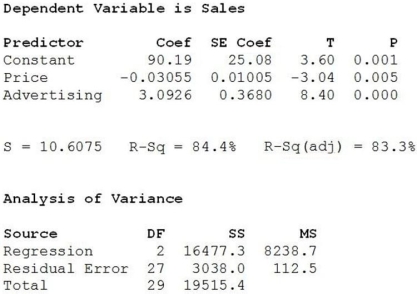
Using the estimated multiple regression model, the number of units sold on average at a store that sells the Samsung 7 Series for $2199 and spends 10% of its advertising budget on the product is
A) 53.94 ≈ 54 units.
B) 120 units.
C) 66.94 ≈ 67 units.
D) 90.34 ≈ 90 units.
E) 689 units.
Question
Consider the following to answer the question(s) below:
What affects 4K Ultra HD Smart TV sales? TVs are sold through a variety of outlets. Sales figures (number of units) for the Samsung 7 Series were obtained for last quarter from a sample of 30 different stores. Also collected were data on the selling price and amount spent on advertising the Samsung 7 Series (as a percentage of total advertising expenditure in the previous quarter) at each store. Below are the results.
The calculated F-statistic to determine the overall significance of the estimated multiple regression model is
A) 10.61.
B) 73.23.
C) 112.5.
D) 3.60.
E) 8.40.
Question
Consider the following to answer the question(s) below:
National birth rates (births per 1,000) may be influenced by the average national life expectancy in years and the national literacy rate (% of population that can read and write). Data for 49 countries were obtained and the regression results follow.
What would the predicted National Birth Rate be in a country with a Life Expectancy of 60 years and a Literacy Rate of 75?
A) 26.76
B) 104.33
C) 35.54
D) 55.84
E) 63.52
Question
Consider the following to answer the question(s) below:
What affects 4K Ultra HD Smart TV sales? TVs are sold through a variety of outlets. Sales figures (number of units) for the Samsung 7 Series were obtained for last quarter from a sample of 30 different stores. Also collected were data on the selling price and amount spent on advertising the Samsung 7 Series (as a percentage of total advertising expenditure in the previous quarter) at each store. Below are the results.
Which of the following statements is true at α = .05?
A) The multiple regression model is not significant overall.
B) Price is not a significant independent variable in explaining Samsung 7 Series sales.
C) There is no evidence that Advertising is a significant independent variable in explaining Samsung 7 Series sales.
D) All we can say is that the multiple regression model is significant overall and only Price is a significant independent variable in explaining Samsung 7 Series sales.
E) We can say that the multiple regression model is significant overall. Also, both variables (Price and Advertising) are significant in explaining Samsung 7 Series sales.
Question
Consider the following to answer the question(s) below:
National birth rates (births per 1,000) may be influenced by the average national life expectancy in years and the national literacy rate (% of population that can read and write). Data for 49 countries were obtained and the regression results follow.
Which of the following statements best describes this model (using α = 0 .05)?
A) The regression model is significant overall, and both Life Expectancy and Literacy Rate are significant independent variables in explaining the National Birth Rate.
B) The regression model is not significant overall.
C) Life Expectancy is not a significant independent variable in explaining the National Birth Rate.
D) There is no evidence that Literacy Rate is a significant independent variable in explaining the National Birth Rate.
E) The regression model is not significant overall because only Life Expectancy is significant independent variable in explaining the National Birth Rate.
Question
In determining the best companies to work for, a number of variables are considered, including size, average annual pay, and turnover rate, etc. Moreover, employee surveys are conducted in order to assess aspects of the organization's culture, such as trust and openness to change. In an attempt to determine what affects turnover rate, a sample of 33 companies was randomly selected and data collected on the average annual bonus and turnover rate (%) for 2015. In addition, a questionnaire was administered to the employees of each company to arrive at a trust index (measured on a scale of 0-100). Below are the multiple regression results. 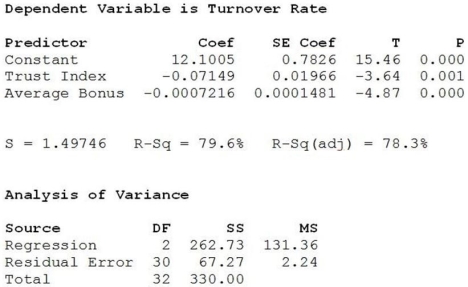 a. Write out the estimated regression equation.
b. Is the regression equation significant overall? Explain.
c. How much of the variability in Turnover Rate is explained by the regression equation?
d. State the hypotheses for testing the regression coefficient of Trust Index. Based on the results, what do you conclude at α = .01?
e. State the hypotheses for testing the regression coefficient of Average Annual Bonus. Based on the results, what do you conclude at α = .01?
f. Predict the turnover rate for a company with a trust index score of 70 and an average annual bonus of $6500.
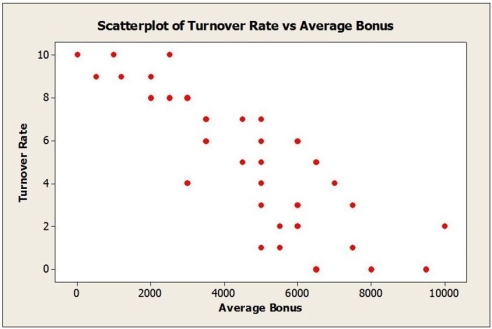
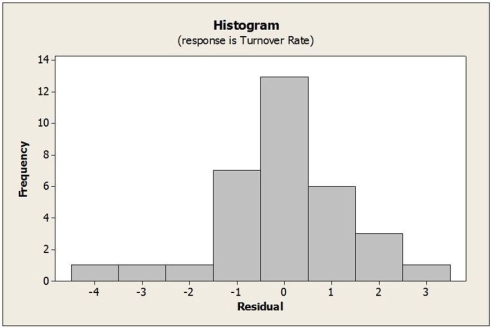
g. Comment on whether the assumptions/conditions for multiple regression are satisfied based on the plots shown below.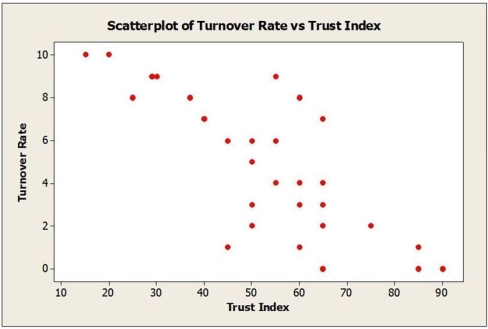
a. Write out the estimated regression equation.b. Is the regression equation significant overall? Explain.
c. How much of the variability in Turnover Rate is explained by the regression equation?
d. State the hypotheses for testing the regression coefficient of Trust Index. Based on the results, what do you conclude at α = .01?
e. State the hypotheses for testing the regression coefficient of Average Annual Bonus. Based on the results, what do you conclude at α = .01?
f. Predict the turnover rate for a company with a trust index score of 70 and an average annual bonus of $6500.
g. Comment on whether the assumptions/conditions for multiple regression are satisfied based on the plots shown below.
Question
Consider the following to answer the question(s) below:
What affects 4K Ultra HD Smart TV sales? TVs are sold through a variety of outlets. Sales figures (number of units) for the Samsung 7 Series were obtained for last quarter from a sample of 30 different stores. Also collected were data on the selling price and amount spent on advertising the Samsung 7 Series (as a percentage of total advertising expenditure in the previous quarter) at each store. Below are the results.
The calculated t-statistic to determine if amount spent on advertising is a significant independent variable in explaining Samsung 7 Series sales is
A) 3.60.
B) - 3.04.
C) 8.40.
D) 10.61.
E) 0.3680.
Question
Question
Consider the following to answer the question(s) below:
In determining the best companies to work for, a number of variables are considered, including size, average annual pay, and turnover rate, etc. Moreover, employee surveys are conducted in order to assess aspects of the organization's culture, such as trust and openness to change. In an attempt to determine what affects turnover rate, a sample of 33 companies was randomly selected and data collected on the average annual bonus and turnover rate (%) for 2015. In addition, a questionnaire was administered to the employees of each company to arrive at a trust index (measured on a scale of 0-100). Below are the multiple regression results.
How much of the variability in Turnover Rate is explained by the estimated multiple regression model?
A) 2.24%
B) 79.6%
C) 12.1%
D) 95.4%
E) 63.36%.
Question
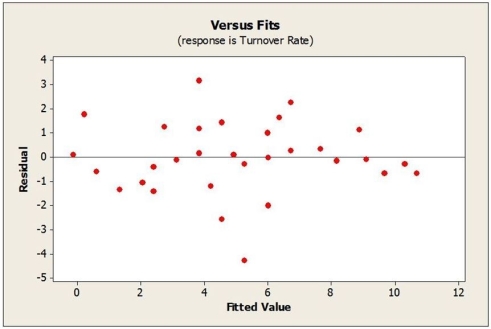
Below is the plot of residuals versus predicted values for this estimated multiple regression model. What does the residual plot suggest? 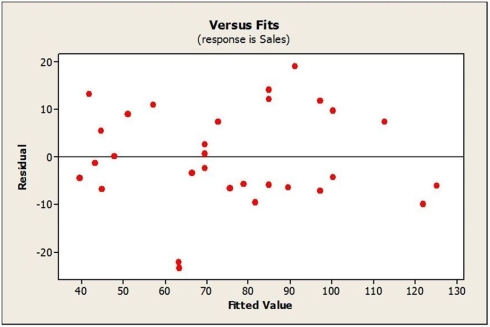
A) The Linearity condition is not satisfied.
B) There is an extreme departure from normality.
C) The variance changes a lot.
D) There are a couple of possible outliers.
E) The plot thickens from left to right.
A) The Linearity condition is not satisfied.
B) There is an extreme departure from normality.
C) The variance changes a lot.
D) There are a couple of possible outliers.
E) The plot thickens from left to right.
Question
Consider the following to answer the question(s) below:
In determining the best companies to work for, a number of variables are considered, including size, average annual pay, and turnover rate, etc. Moreover, employee surveys are conducted in order to assess aspects of the organization's culture, such as trust and openness to change. In an attempt to determine what affects turnover rate, a sample of 33 companies was randomly selected and data collected on the average annual bonus and turnover rate (%) for 2015. In addition, a questionnaire was administered to the employees of each company to arrive at a trust index (measured on a scale of 0-100). Below are the multiple regression results.
At α = 0.01, we can conclude that
A) the multiple regression model is not significant overall.
B) Trust Index is not significant independent variable in explaining turnover rate.
C) there is no evidence that Average Annual Bonus is a significant independent variable in explaining turnover rate.
D) the multiple regression model is not significant overall because only Trust Index is a significant independent variable in explaining turnover rate.
E) the multiple regression model is significant overall. Also, both variables (Trust Index and Average Annual Bonus) are significant in explaining turnover rate.
Question
Consider the following to answer the question(s) below:
National birth rates (births per 1,000) may be influenced by the average national life expectancy in years and the national literacy rate (% of population that can read and write). Data for 49 countries were obtained and the regression results follow.
Suppose that Life Expectancy is the first variable and Literacy Rate is the second variable. The correct alternative hypothesis for the overall significance for this model is
A) HA: at least one β ≠ 0.
B) HA: β1 = β2 = 0.
C) HA: β1 = 0.
D) HA: β2 = 0.
E) HA: all β ≠ 0.
Question
Question

Unlock Deck
Sign up to unlock the cards in this deck!
Unlock Deck
Unlock Deck
1/22
Play
Full screen (f)
Deck 20: Multiple Regression
1
Consider the following to answer the question(s) below:
National birth rates (births per 1,000) may be influenced by the average national life expectancy in years and the national literacy rate (% of population that can read and write). Data for 49 countries were obtained and the regression results follow.
The calculated F-statistic to determine the overall significance of the estimated multiple regression model is
A) 61.07.
B) 16.58.
C) 5.23.
D) 5.47.
E) 0.8574.
61.07.
2
Based on the estimated multiple regression model, a company having a trust index score of 70 and an average annual bonus of $6500 has a predicted turnover rate of
A) 3.50%.
B) 4.21%.
C) 1.90%.
D) 2.41%.
E) 4.52%.
A) 3.50%.
B) 4.21%.
C) 1.90%.
D) 2.41%.
E) 4.52%.
2.41%.
3
Consider the following to answer the question(s) below:
In determining the best companies to work for, a number of variables are considered, including size, average annual pay, and turnover rate, etc. Moreover, employee surveys are conducted in order to assess aspects of the organization's culture, such as trust and openness to change. In an attempt to determine what affects turnover rate, a sample of 33 companies was randomly selected and data collected on the average annual bonus and turnover rate (%) for 2015. In addition, a questionnaire was administered to the employees of each company to arrive at a trust index (measured on a scale of 0-100). Below are the multiple regression results.
The calculated F-statistic to determine the overall significance of the estimated multiple regression model is
A) 58.64.
B) 1.497.
C) 131.36.
D) 78.3.
E) 2.24.
58.64.
4
What affects 4K Ultra HD Smart TV sales? TVs are sold through a variety of outlets such as large electronics stores, department stores, large discount chains and online. Sales figures (number of units) for the Samsung 7 Series were obtained for last quarter from a sample of 30 different stores. Also collected were data on the selling price and amount spent on advertising the Samsung 7 Series (as a percentage of total advertising expenditure in the previous quarter) at each store. Below are the multiple regression results. a. Write out the estimated regression equation.
b. Is the regression equation significant overall? Explain.
c. How much of the variability in Sales is explained by the regression equation?
d. State the hypotheses for testing the regression coefficient of Price. Based on the results, what do you conclude at α = .05?
e. State the hypotheses for testing the regression coefficient of Advertising Expenditure. Based on the results, what do you conclude at α = .05?
f. Predict the sales for a store that sells the Samsung 7 Series for $2199 and spends 10% of its advertising budget on the product.
g. Comment on whether the conditions for multiple regression are satisfied based on the plots shown below.
a. Write out the estimated regression equation.b. Is the regression equation significant overall? Explain.
c. How much of the variability in Sales is explained by the regression equation?
d. State the hypotheses for testing the regression coefficient of Price. Based on the results, what do you conclude at α = .05?
e. State the hypotheses for testing the regression coefficient of Advertising Expenditure. Based on the results, what do you conclude at α = .05?
f. Predict the sales for a store that sells the Samsung 7 Series for $2199 and spends 10% of its advertising budget on the product.
g. Comment on whether the conditions for multiple regression are satisfied based on the plots shown below.
Unlock Deck
Unlock for access to all 22 flashcards in this deck.
Unlock Deck
k this deck
5
Consider the following to answer the question(s) below:
In determining the best companies to work for, a number of variables are considered, including size, average annual pay, and turnover rate, etc. Moreover, employee surveys are conducted in order to assess aspects of the organization's culture, such as trust and openness to change. In an attempt to determine what affects turnover rate, a sample of 33 companies was randomly selected and data collected on the average annual bonus and turnover rate (%) for 2015. In addition, a questionnaire was administered to the employees of each company to arrive at a trust index (measured on a scale of 0-100). Below are the multiple regression results.
The correct null hypotheses for testing the regression coefficient of Trust Index (suppose that it is the first variable)
A) β1 ≠ 0.
B) β1 > 0.
C) β1 = 0.
D) β1 < 0.
E) The regression equation is significant.
Unlock Deck
Unlock for access to all 22 flashcards in this deck.
Unlock Deck
k this deck
6
Consider the following to answer the question(s) below:
National birth rates (births per 1,000) may be influenced by the average national life expectancy in years and the national literacy rate (% of population that can read and write). Data for 49 countries were obtained and the regression results follow.
How much of the variation in the National Birth Rate can be explained by the regression model?
A) 73.51%
B) 0.7231 %
C) 0.7351%
D) 61.07%
E) 85.74%
Unlock Deck
Unlock for access to all 22 flashcards in this deck.
Unlock Deck
k this deck
7
Consider the following to answer the question(s) below:
National birth rates (births per 1,000) may be influenced by the average national life expectancy in years and the national literacy rate (% of population that can read and write). Data for 49 countries were obtained and the regression results follow.
The calculated t-statistic to determine if Literacy Rate is a significant independent variable in explaining birth rates is
A) - 5.48.
B) 5.48.
C) 5.23.
D) 61.07.
E) - 5.23.
Unlock Deck
Unlock for access to all 22 flashcards in this deck.
Unlock Deck
k this deck
8
Consider the following to answer the question(s) below:
National birth rates (births per 1,000) may be influenced by the average national life expectancy in years and the national literacy rate (% of population that can read and write). Data for 49 countries were obtained and the regression results follow.
If an additional explanatory variable was added to the model, what would happen to R2?
A) It would stay the same or increase.
B) It would always decrease.
C) It can decrease.
D) It can become negative.
E) If the coefficient of the additional variable is negative, R2 dramatically decreases.
Unlock Deck
Unlock for access to all 22 flashcards in this deck.
Unlock Deck
k this deck
9
Consider the following to answer the question(s) below:
What affects 4K Ultra HD Smart TV sales? TVs are sold through a variety of outlets. Sales figures (number of units) for the Samsung 7 Series were obtained for last quarter from a sample of 30 different stores. Also collected were data on the selling price and amount spent on advertising the Samsung 7 Series (as a percentage of total advertising expenditure in the previous quarter) at each store. Below are the results.
Using the estimated multiple regression model, the number of units sold on average at a store that sells the Samsung 7 Series for $2199 and spends 10% of its advertising budget on the product is
A) 53.94 ≈ 54 units.
B) 120 units.
C) 66.94 ≈ 67 units.
D) 90.34 ≈ 90 units.
E) 689 units.
Unlock Deck
Unlock for access to all 22 flashcards in this deck.
Unlock Deck
k this deck
10
Consider the following to answer the question(s) below:
What affects 4K Ultra HD Smart TV sales? TVs are sold through a variety of outlets. Sales figures (number of units) for the Samsung 7 Series were obtained for last quarter from a sample of 30 different stores. Also collected were data on the selling price and amount spent on advertising the Samsung 7 Series (as a percentage of total advertising expenditure in the previous quarter) at each store. Below are the results.
The calculated F-statistic to determine the overall significance of the estimated multiple regression model is
A) 10.61.
B) 73.23.
C) 112.5.
D) 3.60.
E) 8.40.
Unlock Deck
Unlock for access to all 22 flashcards in this deck.
Unlock Deck
k this deck
11
Consider the following to answer the question(s) below:
National birth rates (births per 1,000) may be influenced by the average national life expectancy in years and the national literacy rate (% of population that can read and write). Data for 49 countries were obtained and the regression results follow.
What would the predicted National Birth Rate be in a country with a Life Expectancy of 60 years and a Literacy Rate of 75?
A) 26.76
B) 104.33
C) 35.54
D) 55.84
E) 63.52
Unlock Deck
Unlock for access to all 22 flashcards in this deck.
Unlock Deck
k this deck
12
Consider the following to answer the question(s) below:
What affects 4K Ultra HD Smart TV sales? TVs are sold through a variety of outlets. Sales figures (number of units) for the Samsung 7 Series were obtained for last quarter from a sample of 30 different stores. Also collected were data on the selling price and amount spent on advertising the Samsung 7 Series (as a percentage of total advertising expenditure in the previous quarter) at each store. Below are the results.
Which of the following statements is true at α = .05?
A) The multiple regression model is not significant overall.
B) Price is not a significant independent variable in explaining Samsung 7 Series sales.
C) There is no evidence that Advertising is a significant independent variable in explaining Samsung 7 Series sales.
D) All we can say is that the multiple regression model is significant overall and only Price is a significant independent variable in explaining Samsung 7 Series sales.
E) We can say that the multiple regression model is significant overall. Also, both variables (Price and Advertising) are significant in explaining Samsung 7 Series sales.
Unlock Deck
Unlock for access to all 22 flashcards in this deck.
Unlock Deck
k this deck
13
Consider the following to answer the question(s) below:
National birth rates (births per 1,000) may be influenced by the average national life expectancy in years and the national literacy rate (% of population that can read and write). Data for 49 countries were obtained and the regression results follow.
Which of the following statements best describes this model (using α = 0 .05)?
A) The regression model is significant overall, and both Life Expectancy and Literacy Rate are significant independent variables in explaining the National Birth Rate.
B) The regression model is not significant overall.
C) Life Expectancy is not a significant independent variable in explaining the National Birth Rate.
D) There is no evidence that Literacy Rate is a significant independent variable in explaining the National Birth Rate.
E) The regression model is not significant overall because only Life Expectancy is significant independent variable in explaining the National Birth Rate.
Unlock Deck
Unlock for access to all 22 flashcards in this deck.
Unlock Deck
k this deck
14
In determining the best companies to work for, a number of variables are considered, including size, average annual pay, and turnover rate, etc. Moreover, employee surveys are conducted in order to assess aspects of the organization's culture, such as trust and openness to change. In an attempt to determine what affects turnover rate, a sample of 33 companies was randomly selected and data collected on the average annual bonus and turnover rate (%) for 2015. In addition, a questionnaire was administered to the employees of each company to arrive at a trust index (measured on a scale of 0-100). Below are the multiple regression results. a. Write out the estimated regression equation.
b. Is the regression equation significant overall? Explain.
c. How much of the variability in Turnover Rate is explained by the regression equation?
d. State the hypotheses for testing the regression coefficient of Trust Index. Based on the results, what do you conclude at α = .01?
e. State the hypotheses for testing the regression coefficient of Average Annual Bonus. Based on the results, what do you conclude at α = .01?
f. Predict the turnover rate for a company with a trust index score of 70 and an average annual bonus of $6500.
g. Comment on whether the assumptions/conditions for multiple regression are satisfied based on the plots shown below.
a. Write out the estimated regression equation.b. Is the regression equation significant overall? Explain.
c. How much of the variability in Turnover Rate is explained by the regression equation?
d. State the hypotheses for testing the regression coefficient of Trust Index. Based on the results, what do you conclude at α = .01?
e. State the hypotheses for testing the regression coefficient of Average Annual Bonus. Based on the results, what do you conclude at α = .01?
f. Predict the turnover rate for a company with a trust index score of 70 and an average annual bonus of $6500.
g. Comment on whether the assumptions/conditions for multiple regression are satisfied based on the plots shown below.
Unlock Deck
Unlock for access to all 22 flashcards in this deck.
Unlock Deck
k this deck
15
Consider the following to answer the question(s) below:
What affects 4K Ultra HD Smart TV sales? TVs are sold through a variety of outlets. Sales figures (number of units) for the Samsung 7 Series were obtained for last quarter from a sample of 30 different stores. Also collected were data on the selling price and amount spent on advertising the Samsung 7 Series (as a percentage of total advertising expenditure in the previous quarter) at each store. Below are the results.
The calculated t-statistic to determine if amount spent on advertising is a significant independent variable in explaining Samsung 7 Series sales is
A) 3.60.
B) - 3.04.
C) 8.40.
D) 10.61.
E) 0.3680.
Unlock Deck
Unlock for access to all 22 flashcards in this deck.
Unlock Deck
k this deck
16
Consider the following to answer the question(s) below:
A regression was performed to predict the Selling Price of a yacht in thousands of dollars based on the number of Rooms it had, its Age (years), and its Length (feet). The R2 is 68.45%. The equation is given here.
Selling Price = 120.51 + 7.46 Rooms - 1.78 Age + 2.83 Length
Which of the following statements is true?
A) For a given Age and Length, every extra room is associated with an additional $7,460 in the average selling price of the yacht.
B) The model fits 68.45% of the data.
C) Every additional foot of Length causes the selling price of the yacht to increase 2.83 times.
D) The price of a yacht decreases 1.78 times with every year it ages.
E) The selling price of an individual yacht cannot be predicted with this model.
Unlock Deck
Unlock for access to all 22 flashcards in this deck.
Unlock Deck
k this deck
17
Consider the following to answer the question(s) below:
In determining the best companies to work for, a number of variables are considered, including size, average annual pay, and turnover rate, etc. Moreover, employee surveys are conducted in order to assess aspects of the organization's culture, such as trust and openness to change. In an attempt to determine what affects turnover rate, a sample of 33 companies was randomly selected and data collected on the average annual bonus and turnover rate (%) for 2015. In addition, a questionnaire was administered to the employees of each company to arrive at a trust index (measured on a scale of 0-100). Below are the multiple regression results.
How much of the variability in Turnover Rate is explained by the estimated multiple regression model?
A) 2.24%
B) 79.6%
C) 12.1%
D) 95.4%
E) 63.36%.
Unlock Deck
Unlock for access to all 22 flashcards in this deck.
Unlock Deck
k this deck
18
Below is the plot of residuals versus predicted values for this estimated multiple regression model. What does the residual plot suggest?
A) The Linearity condition is not satisfied.
B) There is an extreme departure from normality.
C) The variance changes a lot.
D) There are a couple of possible outliers.
E) The plot thickens from left to right.
A) The Linearity condition is not satisfied.
B) There is an extreme departure from normality.
C) The variance changes a lot.
D) There are a couple of possible outliers.
E) The plot thickens from left to right.
Unlock Deck
Unlock for access to all 22 flashcards in this deck.
Unlock Deck
k this deck
19
Consider the following to answer the question(s) below:
In determining the best companies to work for, a number of variables are considered, including size, average annual pay, and turnover rate, etc. Moreover, employee surveys are conducted in order to assess aspects of the organization's culture, such as trust and openness to change. In an attempt to determine what affects turnover rate, a sample of 33 companies was randomly selected and data collected on the average annual bonus and turnover rate (%) for 2015. In addition, a questionnaire was administered to the employees of each company to arrive at a trust index (measured on a scale of 0-100). Below are the multiple regression results.
At α = 0.01, we can conclude that
A) the multiple regression model is not significant overall.
B) Trust Index is not significant independent variable in explaining turnover rate.
C) there is no evidence that Average Annual Bonus is a significant independent variable in explaining turnover rate.
D) the multiple regression model is not significant overall because only Trust Index is a significant independent variable in explaining turnover rate.
E) the multiple regression model is significant overall. Also, both variables (Trust Index and Average Annual Bonus) are significant in explaining turnover rate.
Unlock Deck
Unlock for access to all 22 flashcards in this deck.
Unlock Deck
k this deck
20
Consider the following to answer the question(s) below:
National birth rates (births per 1,000) may be influenced by the average national life expectancy in years and the national literacy rate (% of population that can read and write). Data for 49 countries were obtained and the regression results follow.
Suppose that Life Expectancy is the first variable and Literacy Rate is the second variable. The correct alternative hypothesis for the overall significance for this model is
A) HA: at least one β ≠ 0.
B) HA: β1 = β2 = 0.
C) HA: β1 = 0.
D) HA: β2 = 0.
E) HA: all β ≠ 0.
Unlock Deck
Unlock for access to all 22 flashcards in this deck.
Unlock Deck
k this deck
21
Consider the following to answer the question(s) below:
A regression was performed to predict the Selling Price of a yacht in thousands of dollars based on the number of Rooms it had, its Age (years), and its Length (feet). The R2 is 68.45%. The equation is given here.
Selling Price = 120.51 + 7.46 Rooms - 1.78 Age + 2.83 Length
If a yacht has 5 rooms, is 4 years old, and is 60 feet long, what would the model predict the selling price to be?
A) $320,490
B) $250,960
C) $332,650
D) $199,340
E) $301,490
Unlock Deck
Unlock for access to all 22 flashcards in this deck.
Unlock Deck
k this deck
22
Consider the following to answer the question(s) below:
A regression was performed to predict the Selling Price of a yacht in thousands of dollars based on the number of Rooms it had, its Age (years), and its Length (feet). The R2 is 68.45%. The equation is given here.
Selling Price = 120.51 + 7.46 Rooms - 1.78 Age + 2.83 Length
What does the coefficient of Rooms mean in the context of the regression model?
A) The average selling price will increase by $7,460 for every additional room for yachts with the same length and age.
B) The average selling price will increase 7.46 times for every additional room.
C) With every additional room the selling price will increase by 7.46%, all other things being equal.
D) There is always a decrease in selling price of $7,460 for every additional room on a yacht.
E) The average selling price will increase by $120.51 for every additional room for yachts with the same length and age.
Unlock Deck
Unlock for access to all 22 flashcards in this deck.
Unlock Deck
k this deck
Unlock Deck
Unlock for access to all 22 flashcards in this deck.


