Deck 14: Comparing Two Means
Full screen (f)
Question
Consider the following to answer the question(s) below:
Data were collected on annual personal time (in hours) taken by a random sample of 16 women and 7 men employed by a medium sized company. The women took an average of 24.75 hours of personal time per year with a standard deviation of 2.84 hours. The men took an average of 21.86 hours with a standard deviation of 3.29 hours. The Human Resources Department believes that women tend to take more personal time than men because they tend to be the primary child care givers in the family.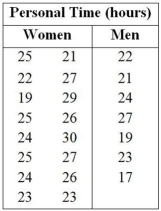
Based on the data, the correct 90% confidence interval for the difference between women and men in the average number of hours of personal time taken per year is
A) 0.30 to 5.48 hours.
B) -0.50 to 3.21 hours.
C) -4.67 to -0.62 hours.
D) 1.27 to 6.89 hours.
E) -3.21 to 0.5.
Question
Consider the following to answer the question(s) below:
A consumer group was interested in comparing the operating time of cordless toothbrushes manufactured by two different companies. They took a random sample of 18 toothbrushes from Company A and 15 from Company B. Each was charged overnight and the number of hours of use before needing to be recharged was recorded. Company A toothbrushes operated for an average of 119.7 hours with a standard deviation of 1.74 hours; Company B toothbrushes operated for an average of 120.6 hours with a standard deviation of 1.72 hours. Do these samples indicate that Company B toothbrushes operate more hours on average than Company A toothbrushes?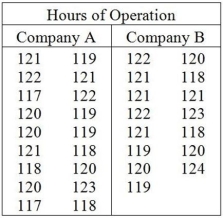
Which of the following statements is true?
A) This is a one-tailed test for the difference in the means of two dependent groups.
B) This is a two-tailed test for the difference in the means of two independent groups.
C) This is a one-tailed test for the difference in the means of two independent groups.
D) These samples are matched.
E) This is a two-tailed test for the difference in the means of two dependent groups.
Question
Consider the following to answer the question(s) below:
Data were collected on annual personal time (in hours) taken by a random sample of 16 women and 7 men employed by a medium sized company. The women took an average of 24.75 hours of personal time per year with a standard deviation of 2.84 hours. The men took an average of 21.86 hours with a standard deviation of 3.29 hours. The Human Resources Department believes that women tend to take more personal time than men because they tend to be the primary child care givers in the family.
The correct null and alternative hypotheses (assuming women are group 1 and men are group 2) are
A) H0 : µ1 - µ2 = 0 and HA : µ1 - µ2 < 0.
B) H0 : µ1 - µ2 = 0 and HA : µ1 - µ2 ≠ 0.
C) H0 : µ1 - µ2 = 0 and HA : µ1 - µ2 > 0.
D) H0 : µ1 - µ2 > 0 and HA : µ1 - µ2 < 0.
E) H0 : µ1 - µ2 < 0 and HA : µ1 - µ2 > 0.
Question
Consider the following to answer the question(s) below:
Data were collected on annual personal time (in hours) taken by a random sample of 16 women and 7 men employed by a medium sized company. The women took an average of 24.75 hours of personal time per year with a standard deviation of 2.84 hours. The men took an average of 21.86 hours with a standard deviation of 3.29 hours. The Human Resources Department believes that women tend to take more personal time than men because they tend to be the primary child care givers in the family.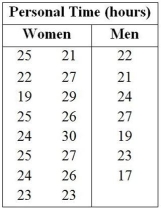
State your conclusion using α = 0.05.
Question
Consider the following to answer the question(s) below:
A consumer group was interested in comparing the operating time of cordless toothbrushes manufactured by two different companies. They took a random sample of 18 toothbrushes from Company A and 15 from Company B. Each was charged overnight and the number of hours of use before needing to be recharged was recorded. Company A toothbrushes operated for an average of 119.7 hours with a standard deviation of 1.74 hours; Company B toothbrushes operated for an average of 120.6 hours with a standard deviation of 1.72 hours. Do these samples indicate that Company B toothbrushes operate more hours on average than Company A toothbrushes?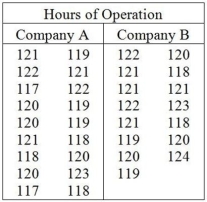
Create and interpret a 90% confidence interval.
Question
Consider the following to answer the question(s) below:
A consumer group was interested in comparing the operating time of cordless toothbrushes manufactured by two different companies. They took a random sample of 18 toothbrushes from Company A and 15 from Company B. Each was charged overnight and the number of hours of use before needing to be recharged was recorded. Company A toothbrushes operated for an average of 119.7 hours with a standard deviation of 1.74 hours; Company B toothbrushes operated for an average of 120.6 hours with a standard deviation of 1.72 hours. Do these samples indicate that Company B toothbrushes operate more hours on average than Company A toothbrushes?
Write the null and alternative hypotheses. Assume Company A is group 1 and Company B is group 2.
Question
Consider the following to answer the question(s) below:
A consumer group was interested in comparing the operating time of cordless toothbrushes manufactured by two different companies. They took a random sample of 18 toothbrushes from Company A and 15 from Company B. Each was charged overnight and the number of hours of use before needing to be recharged was recorded. Company A toothbrushes operated for an average of 119.7 hours with a standard deviation of 1.74 hours; Company B toothbrushes operated for an average of 120.6 hours with a standard deviation of 1.72 hours. Do these samples indicate that Company B toothbrushes operate more hours on average than Company A toothbrushes?
The correct null and alternative hypotheses (assuming Company A is group 1 and Company B is group 2) are
A) H0 : µ1 - µ2 = 0 and HA : µ1 - µ2 > 0.
B) H0 : µ1 - µ2 > 0 and HA : µ1 - µ2 < 0.
C) H0 : µ1 - µ2 = 0 and HA : µ1 - µ2 < 0.
D) H0 : µ1 - µ2 = 0 and HA : µ1 - µ2 ≠ 0.
E) H0 : µ1 - µ2 < 0 and HA : µ1 - µ2 > 0.
Question
Consider the following to answer the question(s) below:
Data were collected on annual personal time (in hours) taken by a random sample of 16 women and 7 men employed by a medium sized company. The women took an average of 24.75 hours of personal time per year with a standard deviation of 2.84 hours. The men took an average of 21.86 hours with a standard deviation of 3.29 hours. The Human Resources Department believes that women tend to take more personal time than men because they tend to be the primary child care givers in the family.
Write the null and alternative hypotheses (assuming women are group 1 and men are group 2).
Question
Consider the following to answer the question(s) below:
A consumer group was interested in comparing the operating time of cordless toothbrushes manufactured by two different companies. They took a random sample of 18 toothbrushes from Company A and 15 from Company B. Each was charged overnight and the number of hours of use before needing to be recharged was recorded. Company A toothbrushes operated for an average of 119.7 hours with a standard deviation of 1.74 hours; Company B toothbrushes operated for an average of 120.6 hours with a standard deviation of 1.72 hours. Do these samples indicate that Company B toothbrushes operate more hours on average than Company A toothbrushes?
What is the associated P-value?
Question
Consider the following to answer the question(s) below:
A consumer group was interested in comparing the operating time of cordless toothbrushes manufactured by two different companies. They took a random sample of 18 toothbrushes from Company A and 15 from Company B. Each was charged overnight and the number of hours of use before needing to be recharged was recorded. Company A toothbrushes operated for an average of 119.7 hours with a standard deviation of 1.74 hours; Company B toothbrushes operated for an average of 120.6 hours with a standard deviation of 1.72 hours. Do these samples indicate that Company B toothbrushes operate more hours on average than Company A toothbrushes?
Are the assumptions and conditions for carrying out the t-test for two means satisfied? Explain.
Question
Consider the following to answer the question(s) below:
Data were collected on annual personal time (in hours) taken by a random sample of 16 women and 7 men employed by a medium sized company. The women took an average of 24.75 hours of personal time per year with a standard deviation of 2.84 hours. The men took an average of 21.86 hours with a standard deviation of 3.29 hours. The Human Resources Department believes that women tend to take more personal time than men because they tend to be the primary child care givers in the family.
Create and interpret a 90% confidence interval.
Question
Consider the following to answer the question(s) below:
Data were collected on annual personal time (in hours) taken by a random sample of 16 women and 7 men employed by a medium sized company. The women took an average of 24.75 hours of personal time per year with a standard deviation of 2.84 hours. The men took an average of 21.86 hours with a standard deviation of 3.29 hours. The Human Resources Department believes that women tend to take more personal time than men because they tend to be the primary child care givers in the family.
At α = 0.05,
A) we reject the alternative hypothesis.
B) we fail to reject the null hypothesis.
C) we can conclude that women take a smaller average number of hours of personal time per year compared to men.
D) we reject the null hypothesis. There is strong evidence that women take a higher average number of hours of personal time per year compared to men.
E) there is no evidence of a difference in the true average number of hours of personal time taken by women and men.
Question
Consider the following to answer the question(s) below:
A consumer group was interested in comparing the operating time of cordless toothbrushes manufactured by two different companies. They took a random sample of 18 toothbrushes from Company A and 15 from Company B. Each was charged overnight and the number of hours of use before needing to be recharged was recorded. Company A toothbrushes operated for an average of 119.7 hours with a standard deviation of 1.74 hours; Company B toothbrushes operated for an average of 120.6 hours with a standard deviation of 1.72 hours. Do these samples indicate that Company B toothbrushes operate more hours on average than Company A toothbrushes?
What is the value of the test statistic?
Question
Consider the following to answer the question(s) below:
Data were collected on annual personal time (in hours) taken by a random sample of 16 women and 7 men employed by a medium sized company. The women took an average of 24.75 hours of personal time per year with a standard deviation of 2.84 hours. The men took an average of 21.86 hours with a standard deviation of 3.29 hours. The Human Resources Department believes that women tend to take more personal time than men because they tend to be the primary child care givers in the family.
What is the value of the test statistic?
Question
Consider the following to answer the question(s) below:
A consumer group was interested in comparing the operating time of cordless toothbrushes manufactured by two different companies. They took a random sample of 18 toothbrushes from Company A and 15 from Company B. Each was charged overnight and the number of hours of use before needing to be recharged was recorded. Company A toothbrushes operated for an average of 119.7 hours with a standard deviation of 1.74 hours; Company B toothbrushes operated for an average of 120.6 hours with a standard deviation of 1.72 hours. Do these samples indicate that Company B toothbrushes operate more hours on average than Company A toothbrushes?
The correct value of the test statistic is
A) t = -1.489.
B) t = -4.421.
C) t = 2.566.
D) t = 1.488.
E) t = -2.566.
Question
Consider the following to answer the question(s) below:
Data were collected on annual personal time (in hours) taken by a random sample of 16 women and 7 men employed by a medium sized company. The women took an average of 24.75 hours of personal time per year with a standard deviation of 2.84 hours. The men took an average of 21.86 hours with a standard deviation of 3.29 hours. The Human Resources Department believes that women tend to take more personal time than men because they tend to be the primary child care givers in the family.
Are the assumptions and conditions for carrying out the t-test for two means satisfied? Explain.
Question
Consider the following to answer the question(s) below:
Data were collected on annual personal time (in hours) taken by a random sample of 16 women and 7 men employed by a medium sized company. The women took an average of 24.75 hours of personal time per year with a standard deviation of 2.84 hours. The men took an average of 21.86 hours with a standard deviation of 3.29 hours. The Human Resources Department believes that women tend to take more personal time than men because they tend to be the primary child care givers in the family.
The correct value of the test statistic is
A) t = 2.02.
B) t = - 1.997.
C) t = 0.458.
D) t = 4.02.
E) t = - 4.02.
Question
Consider the following to answer the question(s) below:
Data were collected on annual personal time (in hours) taken by a random sample of 16 women and 7 men employed by a medium sized company. The women took an average of 24.75 hours of personal time per year with a standard deviation of 2.84 hours. The men took an average of 21.86 hours with a standard deviation of 3.29 hours. The Human Resources Department believes that women tend to take more personal time than men because they tend to be the primary child care givers in the family.
The t-test for two means is appropriate in this situation because
A) women and men are dependent samples.
B) women and men are independent samples.
C) women and men are matched samples.
D) the observations are paired.
E) the variances of the two groups are the same.
Question
Consider the following to answer the question(s) below:
Data were collected on annual personal time (in hours) taken by a random sample of 16 women and 7 men employed by a medium sized company. The women took an average of 24.75 hours of personal time per year with a standard deviation of 2.84 hours. The men took an average of 21.86 hours with a standard deviation of 3.29 hours. The Human Resources Department believes that women tend to take more personal time than men because they tend to be the primary child care givers in the family.
What is the associated P-value?
Question
Consider the following to answer the question(s) below:
A consumer group was interested in comparing the operating time of cordless toothbrushes manufactured by two different companies. They took a random sample of 18 toothbrushes from Company A and 15 from Company B. Each was charged overnight and the number of hours of use before needing to be recharged was recorded. Company A toothbrushes operated for an average of 119.7 hours with a standard deviation of 1.74 hours; Company B toothbrushes operated for an average of 120.6 hours with a standard deviation of 1.72 hours. Do these samples indicate that Company B toothbrushes operate more hours on average than Company A toothbrushes?
State your conclusion using α = 0.05.
Question
Consider the following to answer the question(s) below:
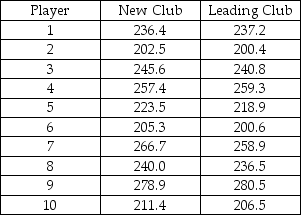
A company in the golfing industry is interested in testing its new driver to see if it has greater length off the tee than the best-selling driver. To do this, it has selected a group of golfers of differing abilities and ages. Its plan is to have each player use each of the two clubs to hit five balls. It will record the average length in yards of the drives with each club for each player.
At α = 0.05,
A) We reject the null hypothesis and conclude that the evidence indicates that the new driver has greater length off the tee than the best-selling driver, on average.
B) We are 95% certain that the new driver is not better than the leading driver.
C) We know the new driver has smaller length off the tee than the best-selling driver, on average.
D) We reject the alternative hypothesis.
E) We fail to reject the null hypothesis.
Question
Consider the following to answer the question(s) below:
A company in the golfing industry is interested in testing its new driver to see if it has greater length off the tee than the best-selling driver. To do this, it has selected a group of golfers of differing abilities and ages. Its plan is to have each player use each of the two clubs to hit five balls. It will record the average length in yards of the drives with each club for each player.
The correct value of the test statistic is
A) 2.726.
B) 1.83.
C) 2.62.
D) 0.235.
E) 1.734.
Question
Question
Question
Consider the following to answer the question(s) below:
A consumer group was interested in comparing the operating time of cordless toothbrushes manufactured by two different companies. They took a random sample of 18 toothbrushes from Company A and 15 from Company B. Each was charged overnight and the number of hours of use before needing to be recharged was recorded. Company A toothbrushes operated for an average of 119.7 hours with a standard deviation of 1.74 hours; Company B toothbrushes operated for an average of 120.6 hours with a standard deviation of 1.72 hours. Do these samples indicate that Company B toothbrushes operate more hours on average than Company A toothbrushes?
At α = 0.05,
A) we reject the null hypothesis.
B) we fail to reject the alternative hypothesis.
C) we can conclude that there is significant difference between the mean operating times of cordless toothbrushes manufactured by the two companies.
D) we fail to reject the null hypothesis. There is not enough evidence to indicate that Company B cordless toothbrushes operate longer, on average, than those of Company A.
E) we fail to reject the alternative hypothesis. There is strong evidence indicating that Company B cordless toothbrushes operate longer on average than those of Company A.
Question
Consider the following to answer the question(s) below:
A consumer group was interested in comparing the operating time of cordless toothbrushes manufactured by two different companies. They took a random sample of 18 toothbrushes from Company A and 15 from Company B. Each was charged overnight and the number of hours of use before needing to be recharged was recorded. Company A toothbrushes operated for an average of 119.7 hours with a standard deviation of 1.74 hours; Company B toothbrushes operated for an average of 120.6 hours with a standard deviation of 1.72 hours. Do these samples indicate that Company B toothbrushes operate more hours on average than Company A toothbrushes?
Suppose that we test the hypotheses (assuming Company A is group 1 and Company B is group 2): H0 : µ1 - µ2 = 0 vs. HA : µ1 - µ2 ≠ 0. Provided that the P-value is greater than α = 0.05, we fail to reject the null hypothesis. If we want to construct a 95% confidence interval for the difference between the mean operating times of cordless toothbrushes of Company A and Company B, we will expect
A) both the upper and lower limits be negative.
B) both the upper and lower limits to be positive.
C) that zero is not included in the interval.
D) that zero falls into the interval.
E) both the upper and lower limits be positive and fairly high.
Question
Consider the following to answer the question(s) below:
A company in the golfing industry is interested in testing its new driver to see if it has greater length off the tee than the best-selling driver. To do this, it has selected a group of golfers of differing abilities and ages. Its plan is to have each player use each of the two clubs to hit five balls. It will record the average length in yards of the drives with each club for each player.
The correct null and alternative hypotheses (assuming the new club is group 1, leading club is group 2, and d = group 1 value - group 2 value) are
A) H0 : µd = 0 and HA : µd > 0.
B) H0 : µd = 0 and HA : µd ≠ 0.
C) H0 : µd ≠ 0 and HA : µd = 0.
D) H0 : µ1 - µ2 = 0 and HA : µ1 - µ2 < 0.
E) H0 : µ1 - µ2 < 0 and HA : µ1 - µ2 > 0.
Question
Consider the following to answer the question(s) below:
A company in the golfing industry is interested in testing its new driver to see if it has greater length off the tee than the best-selling driver. To do this, it has selected a group of golfers of differing abilities and ages. Its plan is to have each player use each of the two clubs to hit five balls. It will record the average length in yards of the drives with each club for each player.
Based on the data, the 90% confidence interval for the difference in the length off the tee is
A) 0.92 to 4.70 yards.
B) 0.48 to 5.14 yards.
C) 0.04 to 5.58 yards.
D) 0.16 to 5.46 yards.
E) 1.25 to 6.75 yards.
Question
Question
Question
Question
Consider the following to answer the question(s) below:
A company in the golfing industry is interested in testing its new driver to see if it has greater length off the tee than the best-selling driver. To do this, it has selected a group of golfers of differing abilities and ages. Its plan is to have each player use each of the two clubs to hit five balls. It will record the average length in yards of the drives with each club for each player.
The correct critical value for α = 0.05 is
A) 1.833.
B) 2.262.
C) 1.734.
D) 2.101.
E) 1.645.

Unlock Deck
Sign up to unlock the cards in this deck!
Unlock Deck
Unlock Deck
1/32
Play
Full screen (f)
Deck 14: Comparing Two Means
1
Consider the following to answer the question(s) below:
Data were collected on annual personal time (in hours) taken by a random sample of 16 women and 7 men employed by a medium sized company. The women took an average of 24.75 hours of personal time per year with a standard deviation of 2.84 hours. The men took an average of 21.86 hours with a standard deviation of 3.29 hours. The Human Resources Department believes that women tend to take more personal time than men because they tend to be the primary child care givers in the family.
Based on the data, the correct 90% confidence interval for the difference between women and men in the average number of hours of personal time taken per year is
A) 0.30 to 5.48 hours.
B) -0.50 to 3.21 hours.
C) -4.67 to -0.62 hours.
D) 1.27 to 6.89 hours.
E) -3.21 to 0.5.
0.30 to 5.48 hours.
2
Consider the following to answer the question(s) below:
A consumer group was interested in comparing the operating time of cordless toothbrushes manufactured by two different companies. They took a random sample of 18 toothbrushes from Company A and 15 from Company B. Each was charged overnight and the number of hours of use before needing to be recharged was recorded. Company A toothbrushes operated for an average of 119.7 hours with a standard deviation of 1.74 hours; Company B toothbrushes operated for an average of 120.6 hours with a standard deviation of 1.72 hours. Do these samples indicate that Company B toothbrushes operate more hours on average than Company A toothbrushes?
Which of the following statements is true?
A) This is a one-tailed test for the difference in the means of two dependent groups.
B) This is a two-tailed test for the difference in the means of two independent groups.
C) This is a one-tailed test for the difference in the means of two independent groups.
D) These samples are matched.
E) This is a two-tailed test for the difference in the means of two dependent groups.
This is a one-tailed test for the difference in the means of two independent groups.
3
Consider the following to answer the question(s) below:
Data were collected on annual personal time (in hours) taken by a random sample of 16 women and 7 men employed by a medium sized company. The women took an average of 24.75 hours of personal time per year with a standard deviation of 2.84 hours. The men took an average of 21.86 hours with a standard deviation of 3.29 hours. The Human Resources Department believes that women tend to take more personal time than men because they tend to be the primary child care givers in the family.
The correct null and alternative hypotheses (assuming women are group 1 and men are group 2) are
A) H0 : µ1 - µ2 = 0 and HA : µ1 - µ2 < 0.
B) H0 : µ1 - µ2 = 0 and HA : µ1 - µ2 ≠ 0.
C) H0 : µ1 - µ2 = 0 and HA : µ1 - µ2 > 0.
D) H0 : µ1 - µ2 > 0 and HA : µ1 - µ2 < 0.
E) H0 : µ1 - µ2 < 0 and HA : µ1 - µ2 > 0.
H0 : µ1 - µ2 = 0 and HA : µ1 - µ2 > 0.
4
Consider the following to answer the question(s) below:
Data were collected on annual personal time (in hours) taken by a random sample of 16 women and 7 men employed by a medium sized company. The women took an average of 24.75 hours of personal time per year with a standard deviation of 2.84 hours. The men took an average of 21.86 hours with a standard deviation of 3.29 hours. The Human Resources Department believes that women tend to take more personal time than men because they tend to be the primary child care givers in the family.
State your conclusion using α = 0.05.
Unlock Deck
Unlock for access to all 32 flashcards in this deck.
Unlock Deck
k this deck
5
Consider the following to answer the question(s) below:
A consumer group was interested in comparing the operating time of cordless toothbrushes manufactured by two different companies. They took a random sample of 18 toothbrushes from Company A and 15 from Company B. Each was charged overnight and the number of hours of use before needing to be recharged was recorded. Company A toothbrushes operated for an average of 119.7 hours with a standard deviation of 1.74 hours; Company B toothbrushes operated for an average of 120.6 hours with a standard deviation of 1.72 hours. Do these samples indicate that Company B toothbrushes operate more hours on average than Company A toothbrushes?
Create and interpret a 90% confidence interval.
Unlock Deck
Unlock for access to all 32 flashcards in this deck.
Unlock Deck
k this deck
6
Consider the following to answer the question(s) below:
A consumer group was interested in comparing the operating time of cordless toothbrushes manufactured by two different companies. They took a random sample of 18 toothbrushes from Company A and 15 from Company B. Each was charged overnight and the number of hours of use before needing to be recharged was recorded. Company A toothbrushes operated for an average of 119.7 hours with a standard deviation of 1.74 hours; Company B toothbrushes operated for an average of 120.6 hours with a standard deviation of 1.72 hours. Do these samples indicate that Company B toothbrushes operate more hours on average than Company A toothbrushes?
Write the null and alternative hypotheses. Assume Company A is group 1 and Company B is group 2.
Unlock Deck
Unlock for access to all 32 flashcards in this deck.
Unlock Deck
k this deck
7
Consider the following to answer the question(s) below:
A consumer group was interested in comparing the operating time of cordless toothbrushes manufactured by two different companies. They took a random sample of 18 toothbrushes from Company A and 15 from Company B. Each was charged overnight and the number of hours of use before needing to be recharged was recorded. Company A toothbrushes operated for an average of 119.7 hours with a standard deviation of 1.74 hours; Company B toothbrushes operated for an average of 120.6 hours with a standard deviation of 1.72 hours. Do these samples indicate that Company B toothbrushes operate more hours on average than Company A toothbrushes?
The correct null and alternative hypotheses (assuming Company A is group 1 and Company B is group 2) are
A) H0 : µ1 - µ2 = 0 and HA : µ1 - µ2 > 0.
B) H0 : µ1 - µ2 > 0 and HA : µ1 - µ2 < 0.
C) H0 : µ1 - µ2 = 0 and HA : µ1 - µ2 < 0.
D) H0 : µ1 - µ2 = 0 and HA : µ1 - µ2 ≠ 0.
E) H0 : µ1 - µ2 < 0 and HA : µ1 - µ2 > 0.
Unlock Deck
Unlock for access to all 32 flashcards in this deck.
Unlock Deck
k this deck
8
Consider the following to answer the question(s) below:
Data were collected on annual personal time (in hours) taken by a random sample of 16 women and 7 men employed by a medium sized company. The women took an average of 24.75 hours of personal time per year with a standard deviation of 2.84 hours. The men took an average of 21.86 hours with a standard deviation of 3.29 hours. The Human Resources Department believes that women tend to take more personal time than men because they tend to be the primary child care givers in the family.
Write the null and alternative hypotheses (assuming women are group 1 and men are group 2).
Unlock Deck
Unlock for access to all 32 flashcards in this deck.
Unlock Deck
k this deck
9
Consider the following to answer the question(s) below:
A consumer group was interested in comparing the operating time of cordless toothbrushes manufactured by two different companies. They took a random sample of 18 toothbrushes from Company A and 15 from Company B. Each was charged overnight and the number of hours of use before needing to be recharged was recorded. Company A toothbrushes operated for an average of 119.7 hours with a standard deviation of 1.74 hours; Company B toothbrushes operated for an average of 120.6 hours with a standard deviation of 1.72 hours. Do these samples indicate that Company B toothbrushes operate more hours on average than Company A toothbrushes?
What is the associated P-value?
Unlock Deck
Unlock for access to all 32 flashcards in this deck.
Unlock Deck
k this deck
10
Consider the following to answer the question(s) below:
A consumer group was interested in comparing the operating time of cordless toothbrushes manufactured by two different companies. They took a random sample of 18 toothbrushes from Company A and 15 from Company B. Each was charged overnight and the number of hours of use before needing to be recharged was recorded. Company A toothbrushes operated for an average of 119.7 hours with a standard deviation of 1.74 hours; Company B toothbrushes operated for an average of 120.6 hours with a standard deviation of 1.72 hours. Do these samples indicate that Company B toothbrushes operate more hours on average than Company A toothbrushes?
Are the assumptions and conditions for carrying out the t-test for two means satisfied? Explain.
Unlock Deck
Unlock for access to all 32 flashcards in this deck.
Unlock Deck
k this deck
11
Consider the following to answer the question(s) below:
Data were collected on annual personal time (in hours) taken by a random sample of 16 women and 7 men employed by a medium sized company. The women took an average of 24.75 hours of personal time per year with a standard deviation of 2.84 hours. The men took an average of 21.86 hours with a standard deviation of 3.29 hours. The Human Resources Department believes that women tend to take more personal time than men because they tend to be the primary child care givers in the family.
Create and interpret a 90% confidence interval.
Unlock Deck
Unlock for access to all 32 flashcards in this deck.
Unlock Deck
k this deck
12
Consider the following to answer the question(s) below:
Data were collected on annual personal time (in hours) taken by a random sample of 16 women and 7 men employed by a medium sized company. The women took an average of 24.75 hours of personal time per year with a standard deviation of 2.84 hours. The men took an average of 21.86 hours with a standard deviation of 3.29 hours. The Human Resources Department believes that women tend to take more personal time than men because they tend to be the primary child care givers in the family.
At α = 0.05,
A) we reject the alternative hypothesis.
B) we fail to reject the null hypothesis.
C) we can conclude that women take a smaller average number of hours of personal time per year compared to men.
D) we reject the null hypothesis. There is strong evidence that women take a higher average number of hours of personal time per year compared to men.
E) there is no evidence of a difference in the true average number of hours of personal time taken by women and men.
Unlock Deck
Unlock for access to all 32 flashcards in this deck.
Unlock Deck
k this deck
13
Consider the following to answer the question(s) below:
A consumer group was interested in comparing the operating time of cordless toothbrushes manufactured by two different companies. They took a random sample of 18 toothbrushes from Company A and 15 from Company B. Each was charged overnight and the number of hours of use before needing to be recharged was recorded. Company A toothbrushes operated for an average of 119.7 hours with a standard deviation of 1.74 hours; Company B toothbrushes operated for an average of 120.6 hours with a standard deviation of 1.72 hours. Do these samples indicate that Company B toothbrushes operate more hours on average than Company A toothbrushes?
What is the value of the test statistic?
Unlock Deck
Unlock for access to all 32 flashcards in this deck.
Unlock Deck
k this deck
14
Consider the following to answer the question(s) below:
Data were collected on annual personal time (in hours) taken by a random sample of 16 women and 7 men employed by a medium sized company. The women took an average of 24.75 hours of personal time per year with a standard deviation of 2.84 hours. The men took an average of 21.86 hours with a standard deviation of 3.29 hours. The Human Resources Department believes that women tend to take more personal time than men because they tend to be the primary child care givers in the family.
What is the value of the test statistic?
Unlock Deck
Unlock for access to all 32 flashcards in this deck.
Unlock Deck
k this deck
15
Consider the following to answer the question(s) below:
A consumer group was interested in comparing the operating time of cordless toothbrushes manufactured by two different companies. They took a random sample of 18 toothbrushes from Company A and 15 from Company B. Each was charged overnight and the number of hours of use before needing to be recharged was recorded. Company A toothbrushes operated for an average of 119.7 hours with a standard deviation of 1.74 hours; Company B toothbrushes operated for an average of 120.6 hours with a standard deviation of 1.72 hours. Do these samples indicate that Company B toothbrushes operate more hours on average than Company A toothbrushes?
The correct value of the test statistic is
A) t = -1.489.
B) t = -4.421.
C) t = 2.566.
D) t = 1.488.
E) t = -2.566.
Unlock Deck
Unlock for access to all 32 flashcards in this deck.
Unlock Deck
k this deck
16
Consider the following to answer the question(s) below:
Data were collected on annual personal time (in hours) taken by a random sample of 16 women and 7 men employed by a medium sized company. The women took an average of 24.75 hours of personal time per year with a standard deviation of 2.84 hours. The men took an average of 21.86 hours with a standard deviation of 3.29 hours. The Human Resources Department believes that women tend to take more personal time than men because they tend to be the primary child care givers in the family.
Are the assumptions and conditions for carrying out the t-test for two means satisfied? Explain.
Unlock Deck
Unlock for access to all 32 flashcards in this deck.
Unlock Deck
k this deck
17
Consider the following to answer the question(s) below:
Data were collected on annual personal time (in hours) taken by a random sample of 16 women and 7 men employed by a medium sized company. The women took an average of 24.75 hours of personal time per year with a standard deviation of 2.84 hours. The men took an average of 21.86 hours with a standard deviation of 3.29 hours. The Human Resources Department believes that women tend to take more personal time than men because they tend to be the primary child care givers in the family.
The correct value of the test statistic is
A) t = 2.02.
B) t = - 1.997.
C) t = 0.458.
D) t = 4.02.
E) t = - 4.02.
Unlock Deck
Unlock for access to all 32 flashcards in this deck.
Unlock Deck
k this deck
18
Consider the following to answer the question(s) below:
Data were collected on annual personal time (in hours) taken by a random sample of 16 women and 7 men employed by a medium sized company. The women took an average of 24.75 hours of personal time per year with a standard deviation of 2.84 hours. The men took an average of 21.86 hours with a standard deviation of 3.29 hours. The Human Resources Department believes that women tend to take more personal time than men because they tend to be the primary child care givers in the family.
The t-test for two means is appropriate in this situation because
A) women and men are dependent samples.
B) women and men are independent samples.
C) women and men are matched samples.
D) the observations are paired.
E) the variances of the two groups are the same.
Unlock Deck
Unlock for access to all 32 flashcards in this deck.
Unlock Deck
k this deck
19
Consider the following to answer the question(s) below:
Data were collected on annual personal time (in hours) taken by a random sample of 16 women and 7 men employed by a medium sized company. The women took an average of 24.75 hours of personal time per year with a standard deviation of 2.84 hours. The men took an average of 21.86 hours with a standard deviation of 3.29 hours. The Human Resources Department believes that women tend to take more personal time than men because they tend to be the primary child care givers in the family.
What is the associated P-value?
Unlock Deck
Unlock for access to all 32 flashcards in this deck.
Unlock Deck
k this deck
20
Consider the following to answer the question(s) below:
A consumer group was interested in comparing the operating time of cordless toothbrushes manufactured by two different companies. They took a random sample of 18 toothbrushes from Company A and 15 from Company B. Each was charged overnight and the number of hours of use before needing to be recharged was recorded. Company A toothbrushes operated for an average of 119.7 hours with a standard deviation of 1.74 hours; Company B toothbrushes operated for an average of 120.6 hours with a standard deviation of 1.72 hours. Do these samples indicate that Company B toothbrushes operate more hours on average than Company A toothbrushes?
State your conclusion using α = 0.05.
Unlock Deck
Unlock for access to all 32 flashcards in this deck.
Unlock Deck
k this deck
21
Consider the following to answer the question(s) below:
A company in the golfing industry is interested in testing its new driver to see if it has greater length off the tee than the best-selling driver. To do this, it has selected a group of golfers of differing abilities and ages. Its plan is to have each player use each of the two clubs to hit five balls. It will record the average length in yards of the drives with each club for each player.
At α = 0.05,
A) We reject the null hypothesis and conclude that the evidence indicates that the new driver has greater length off the tee than the best-selling driver, on average.
B) We are 95% certain that the new driver is not better than the leading driver.
C) We know the new driver has smaller length off the tee than the best-selling driver, on average.
D) We reject the alternative hypothesis.
E) We fail to reject the null hypothesis.
Unlock Deck
Unlock for access to all 32 flashcards in this deck.
Unlock Deck
k this deck
22
Consider the following to answer the question(s) below:
A company in the golfing industry is interested in testing its new driver to see if it has greater length off the tee than the best-selling driver. To do this, it has selected a group of golfers of differing abilities and ages. Its plan is to have each player use each of the two clubs to hit five balls. It will record the average length in yards of the drives with each club for each player.
The correct value of the test statistic is
A) 2.726.
B) 1.83.
C) 2.62.
D) 0.235.
E) 1.734.
Unlock Deck
Unlock for access to all 32 flashcards in this deck.
Unlock Deck
k this deck
23
Consider the following to answer the question(s) below.
A recent study of two brands of golf balls was undertaken to determine whether there is a difference in the mean distance that the two golf ball brands will fly off the tee. To conduct the test, a robot which swings the club at the same speed and with the same swing pattern each time was used. The following data reflect sample data for a random sample of balls of each brand. We assume that the variances of the two groups are the same.
Brand A: 234 236 230 227 234 233 228 229 230 238
Brand B: 240 236 241 236 239 243 230 239 243 240
Which test would be most appropriate for testing this hypothesis?
A) the pooled t-test
B) the two sample t-test
C) the paired t-test
D) the two proportion z-test
E) the one sample t-test
Unlock Deck
Unlock for access to all 32 flashcards in this deck.
Unlock Deck
k this deck
24
Consider the following to answer the question(s) below.
A recent study of two brands of golf balls was undertaken to determine whether there is a difference in the mean distance that the two golf ball brands will fly off the tee. To conduct the test, a robot which swings the club at the same speed and with the same swing pattern each time was used. The following data reflect sample data for a random sample of balls of each brand. We assume that the variances of the two groups are the same.
Brand A: 234 236 230 227 234 233 228 229 230 238
Brand B: 240 236 241 236 239 243 230 239 243 240
The correct null and alternative hypotheses (assuming Brand A is group 1 and Brand B is group 2) are
A) H0 : µ1 - µ2 = 0 and HA : µ1 - µ2 ≠ 0.
B) H0 : µ1 - µ2 = 0 and HA : µ1 - µ2 > 0.
C) H0 : µ1 - µ2 = 0 and HA : µ1 - µ2 < 0.
D) H0 : µ1 - µ2 < 0 and HA : µ1 - µ2 > 0.
E) H0 : µ1 - µ2 ≠ 0 and HA : µ1 - µ2 = 0.
Unlock Deck
Unlock for access to all 32 flashcards in this deck.
Unlock Deck
k this deck
25
Consider the following to answer the question(s) below:
A consumer group was interested in comparing the operating time of cordless toothbrushes manufactured by two different companies. They took a random sample of 18 toothbrushes from Company A and 15 from Company B. Each was charged overnight and the number of hours of use before needing to be recharged was recorded. Company A toothbrushes operated for an average of 119.7 hours with a standard deviation of 1.74 hours; Company B toothbrushes operated for an average of 120.6 hours with a standard deviation of 1.72 hours. Do these samples indicate that Company B toothbrushes operate more hours on average than Company A toothbrushes?
At α = 0.05,
A) we reject the null hypothesis.
B) we fail to reject the alternative hypothesis.
C) we can conclude that there is significant difference between the mean operating times of cordless toothbrushes manufactured by the two companies.
D) we fail to reject the null hypothesis. There is not enough evidence to indicate that Company B cordless toothbrushes operate longer, on average, than those of Company A.
E) we fail to reject the alternative hypothesis. There is strong evidence indicating that Company B cordless toothbrushes operate longer on average than those of Company A.
Unlock Deck
Unlock for access to all 32 flashcards in this deck.
Unlock Deck
k this deck
26
Consider the following to answer the question(s) below:
A consumer group was interested in comparing the operating time of cordless toothbrushes manufactured by two different companies. They took a random sample of 18 toothbrushes from Company A and 15 from Company B. Each was charged overnight and the number of hours of use before needing to be recharged was recorded. Company A toothbrushes operated for an average of 119.7 hours with a standard deviation of 1.74 hours; Company B toothbrushes operated for an average of 120.6 hours with a standard deviation of 1.72 hours. Do these samples indicate that Company B toothbrushes operate more hours on average than Company A toothbrushes?
Suppose that we test the hypotheses (assuming Company A is group 1 and Company B is group 2): H0 : µ1 - µ2 = 0 vs. HA : µ1 - µ2 ≠ 0. Provided that the P-value is greater than α = 0.05, we fail to reject the null hypothesis. If we want to construct a 95% confidence interval for the difference between the mean operating times of cordless toothbrushes of Company A and Company B, we will expect
A) both the upper and lower limits be negative.
B) both the upper and lower limits to be positive.
C) that zero is not included in the interval.
D) that zero falls into the interval.
E) both the upper and lower limits be positive and fairly high.
Unlock Deck
Unlock for access to all 32 flashcards in this deck.
Unlock Deck
k this deck
27
Consider the following to answer the question(s) below:
A company in the golfing industry is interested in testing its new driver to see if it has greater length off the tee than the best-selling driver. To do this, it has selected a group of golfers of differing abilities and ages. Its plan is to have each player use each of the two clubs to hit five balls. It will record the average length in yards of the drives with each club for each player.
The correct null and alternative hypotheses (assuming the new club is group 1, leading club is group 2, and d = group 1 value - group 2 value) are
A) H0 : µd = 0 and HA : µd > 0.
B) H0 : µd = 0 and HA : µd ≠ 0.
C) H0 : µd ≠ 0 and HA : µd = 0.
D) H0 : µ1 - µ2 = 0 and HA : µ1 - µ2 < 0.
E) H0 : µ1 - µ2 < 0 and HA : µ1 - µ2 > 0.
Unlock Deck
Unlock for access to all 32 flashcards in this deck.
Unlock Deck
k this deck
28
Consider the following to answer the question(s) below:
A company in the golfing industry is interested in testing its new driver to see if it has greater length off the tee than the best-selling driver. To do this, it has selected a group of golfers of differing abilities and ages. Its plan is to have each player use each of the two clubs to hit five balls. It will record the average length in yards of the drives with each club for each player.
Based on the data, the 90% confidence interval for the difference in the length off the tee is
A) 0.92 to 4.70 yards.
B) 0.48 to 5.14 yards.
C) 0.04 to 5.58 yards.
D) 0.16 to 5.46 yards.
E) 1.25 to 6.75 yards.
Unlock Deck
Unlock for access to all 32 flashcards in this deck.
Unlock Deck
k this deck
29
Consider the following to answer the question(s) below.
A recent study of two brands of golf balls was undertaken to determine whether there is a difference in the mean distance that the two golf ball brands will fly off the tee. To conduct the test, a robot which swings the club at the same speed and with the same swing pattern each time was used. The following data reflect sample data for a random sample of balls of each brand. We assume that the variances of the two groups are the same.
Brand A: 234 236 230 227 234 233 228 229 230 238
Brand B: 240 236 241 236 239 243 230 239 243 240
The correct critical value(s) at α = 0.05 (assuming Brand A is group 1 and Brand B is group 2) is(are)
A) -1.734.
B) 1.734.
C) ±2.101.
D) ±1.645.
E) -1.960.
Unlock Deck
Unlock for access to all 32 flashcards in this deck.
Unlock Deck
k this deck
30
Consider the following to answer the question(s) below.
A recent study of two brands of golf balls was undertaken to determine whether there is a difference in the mean distance that the two golf ball brands will fly off the tee. To conduct the test, a robot which swings the club at the same speed and with the same swing pattern each time was used. The following data reflect sample data for a random sample of balls of each brand. We assume that the variances of the two groups are the same.
Brand A: 234 236 230 227 234 233 228 229 230 238
Brand B: 240 236 241 236 239 243 230 239 243 240
The correct value of the test statistic (assuming Brand A is group 1 and Brand B is group 2) is
A) -4.04.
B) 4.04.
C) 1.7340.
D) 2.1009.
E) -1.7340.
Unlock Deck
Unlock for access to all 32 flashcards in this deck.
Unlock Deck
k this deck
31
Consider the following to answer the question(s) below.
A recent study of two brands of golf balls was undertaken to determine whether there is a difference in the mean distance that the two golf ball brands will fly off the tee. To conduct the test, a robot which swings the club at the same speed and with the same swing pattern each time was used. The following data reflect sample data for a random sample of balls of each brand. We assume that the variances of the two groups are the same.
Brand A: 234 236 230 227 234 233 228 229 230 238
Brand B: 240 236 241 236 239 243 230 239 243 240
At α = 0.05,
A) we reject the null hypothesis and can conclude that there is a significant difference in the mean distance that the two golf ball brands will fly off the tee.
B) we reject the null alternative hypothesis.
C) we fail to reject the null hypothesis and can conclude that there is no significant difference in the mean distance that the two golf ball brands will fly off the tee.
D) we fail to reject the null hypothesis.
E) we know there is a no difference between the two brands.
Unlock Deck
Unlock for access to all 32 flashcards in this deck.
Unlock Deck
k this deck
32
Consider the following to answer the question(s) below:
A company in the golfing industry is interested in testing its new driver to see if it has greater length off the tee than the best-selling driver. To do this, it has selected a group of golfers of differing abilities and ages. Its plan is to have each player use each of the two clubs to hit five balls. It will record the average length in yards of the drives with each club for each player.
The correct critical value for α = 0.05 is
A) 1.833.
B) 2.262.
C) 1.734.
D) 2.101.
E) 1.645.
Unlock Deck
Unlock for access to all 32 flashcards in this deck.
Unlock Deck
k this deck
Unlock Deck
Unlock for access to all 32 flashcards in this deck.


