Deck 15: Design of Experiments and Analysis of Variance Anova
Full screen (f)
Question
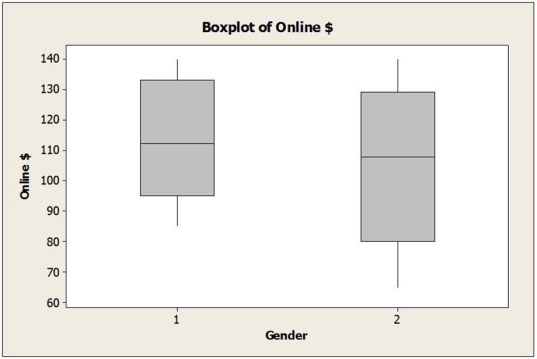
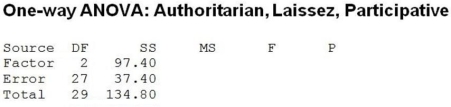
A survey of online consumers asked respondents to indicate how much money they spent for online purchases during the most recent Christmas holiday season. These data were analyzed to see if gender (1= Female; 2 = Male) and income level (1 = Low, 2 = Middle, 3 = High) influence the amount consumers spend online for holiday shopping. The two-way ANOVA results appear below. 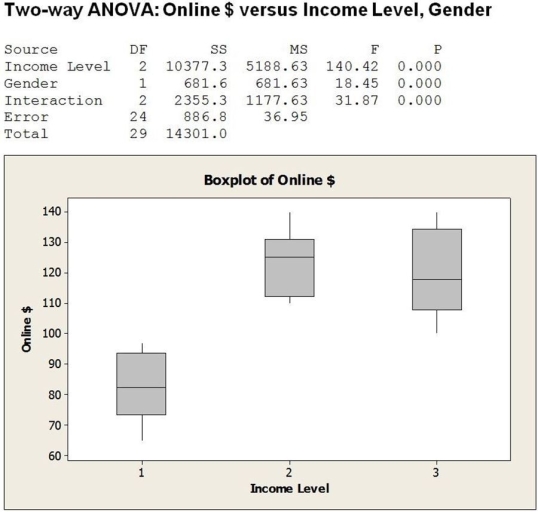
 a. Is this an experiment or observational study?
b. Are the conditions for two-way ANOVA met?
c. If so, perform the hypothesis tests and state your conclusions in terms of amount spent online, gender and income level.
d. Is it appropriate to interpret the main effects in this case separately? Explain.
a. Is this an experiment or observational study?b. Are the conditions for two-way ANOVA met?
c. If so, perform the hypothesis tests and state your conclusions in terms of amount spent online, gender and income level.
d. Is it appropriate to interpret the main effects in this case separately? Explain.
Question
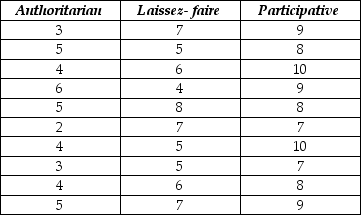
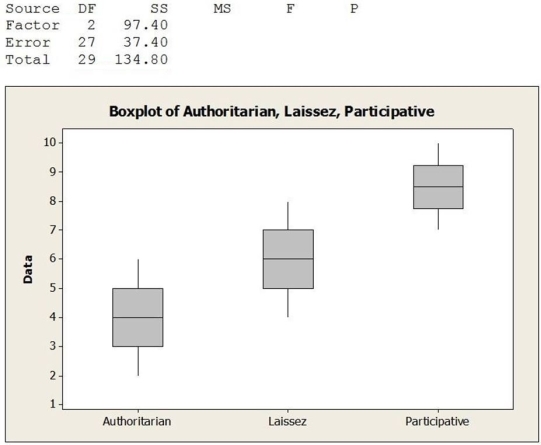
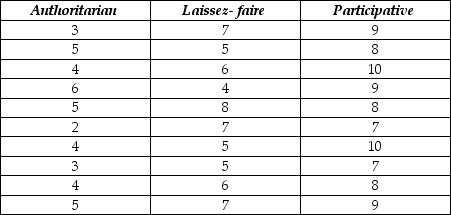
Management styles differ among organizations and may potentially affect employee job satisfaction. A sample of employees was randomly selected from each of three companies with different management styles (Authoritarian, Laissez-faire and Participative) and asked to rate their level of job satisfaction on a 10-point scale (10 being the highest level of satisfaction). The data collected and partial ANOVA results appear below.
 a. What are the null and alternative hypotheses (in words, not symbols)?
b. Are the conditions / assumptions for ANOVA met?
c. Calculate the F-statistic.
d. The P-value for this statistic turns out to be < .001. State the conclusion.
e. Suppose that employees fall into several job categories, such as clerical, technical, or professional. How might this affect the study results? Suggest how the design for the study could have been improved.
a. What are the null and alternative hypotheses (in words, not symbols)?b. Are the conditions / assumptions for ANOVA met?
c. Calculate the F-statistic.
d. The P-value for this statistic turns out to be < .001. State the conclusion.
e. Suppose that employees fall into several job categories, such as clerical, technical, or professional. How might this affect the study results? Suggest how the design for the study could have been improved.
Question
Consider the following to answer the question(s) below:
An Internet service provider is interested in testing to see if there is a difference in the mean weekly connect time for users who come into the service through a dial-up line, DSL, or cable Internet. To test this, the ISP has selected random samples from each category of users and recorded the connect time during a week period. The following is partial Excel output for the data.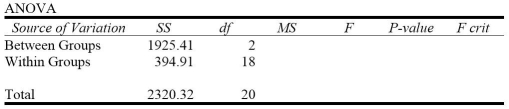
The correct null hypothesis is
A) mean weekly connect times are equal regardless of the method of connection.
B) mean weekly connect times are not all equal regardless of the method of connection.
C) two mean weekly connect times are equal, and one mean is different.
D) method of internet connection has an impact on average weekly connect times.
E) only DSL and Cable Internet are significant.
Question
Given the following output, which of the following statements is not true at α = 0.05? 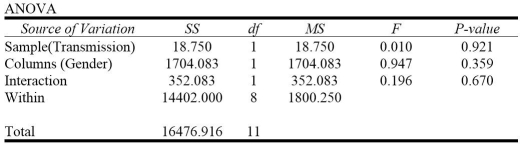
A) Since the interaction effect of gender and transmission type on miles driven is significant, it is appropriate to interpret the main effects due to gender and transmission type separately.
B) We fail to reject the null hypothesis that the mean number of miles driven per day is the same for both types of transmission.
C) We fail to reject the null hypothesis that the mean number of miles driven per day is the same for male and female customers.
D) Since the P-value is fairly high, the interaction effect of gender and transmission type on miles driven is not significant.
E) Since all P-values are fairly high, we fail to reject all three null hypotheses.
Question
Consider the following to answer the question(s) below:
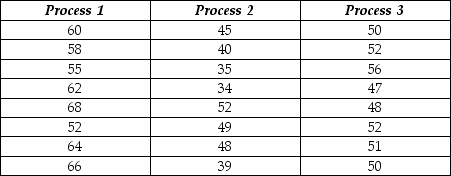
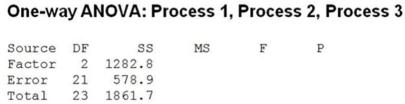
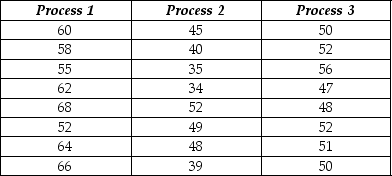
A health food company wants to determine the best process for blanching dark green vegetable material so it can be added to other food products without losing vitamin A. They are examining three different blanching processes to determine which is best in terms of vitamin A retention (mg/100mg). The data collected and partial ANOVA results appear below.
The P-value for this statistic turns out to be < 0.001. Therefore, at α = 0.05
A) we fail to reject the null hypothesis.
B) we reject the alternative hypothesis.
C) we conclude that mean vitamin A retention amounts are all equal across the different blanching processes.
D) we support the null hypothesis and conclude that at least two mean vitamin A retention amounts are equal.
E) we reject the null hypothesis and conclude that at least one mean vitamin A retention amount is different from the others.
Question
Consider the following to answer the question(s) below:
Management styles differ among organizations and may potentially affect employee job satisfaction. A sample of employees was randomly selected from each of three companies with different management styles (Authoritarian, Laissez-faire and Participative) and asked to rate their level of job satisfaction on a 10-point scale (10 being the highest level of satisfaction). The data collected and partial ANOVA results appear below.
The correct null hypothesis is
A) exactly two mean employee job satisfaction ratings are equal, and one mean is different.
B) mean employee job satisfaction ratings are not all equal across companies with different management styles.
C) management style affects employee job satisfaction rating.
D) mean employee job satisfaction ratings are equal across companies with different management styles.
E) two particular management styles affect employee job satisfaction rating, and one style is not significant.
Question
Consider the following to answer the question(s) below:
A health food company wants to determine the best process for blanching dark green vegetable material so it can be added to other food products without losing vitamin A. They are examining three different blanching processes to determine which is best in terms of vitamin A retention (mg/100mg). The data collected and partial ANOVA results appear below.
The F-statistic value is
A) F = 23.267.
B) F = 2.215.
C) F = 27.57.
D) F = 7.999.
E) F = 3.22.
Question
Consider the following to answer the question(s) below:
A health food company wants to determine the best process for blanching dark green vegetable material so it can be added to other food products without losing vitamin A. They are examining three different blanching processes to determine which is best in terms of vitamin A retention (mg/100mg). The data collected and partial ANOVA results appear below.
The correct null hypothesis is
A) mean vitamin A retention amounts are not all equal across the three blanching processes.
B) mean vitamin A retention amounts are equal across the three blanching processes.
C) blanching process has an effect on vitamin A retention.
D) all three blanching processes are different from each other.
E) exactly two mean vitamin A retention amounts are equal across the two particular blanching processes, and one mean is different.
Question
Consider the following to answer the question(s) below:
An Internet service provider is interested in testing to see if there is a difference in the mean weekly connect time for users who come into the service through a dial-up line, DSL, or cable Internet. To test this, the ISP has selected random samples from each category of users and recorded the connect time during a week period. The following is partial Excel output for the data.
The F-statistic value is
A) 43.88.
B) 962.72.
C) 21.94.
D) 0.02.
E) 3.554.
Question
A survey of online consumers asked respondents to indicate how much money they spent for online purchases during the most recent Christmas holiday season. These data were analyzed to see if gender and income level influence the amount consumers spend online for holiday shopping. The two-way ANOVA results appear below.  Which of the following statements is true?
A) This is an experiment.
B) This is a randomized block design.
C) Since the interaction effect of gender and income level on online expenditure is significant, it is not appropriate to interpret the main effects due to gender and income level separately.
D) Only income level is significant.
E) The interaction effect of gender and income level on online expenditure is not significant.
Which of the following statements is true?A) This is an experiment.
B) This is a randomized block design.
C) Since the interaction effect of gender and income level on online expenditure is significant, it is not appropriate to interpret the main effects due to gender and income level separately.
D) Only income level is significant.
E) The interaction effect of gender and income level on online expenditure is not significant.
Question
Consider the following to answer the question(s) below:
Management styles differ among organizations and may potentially affect employee job satisfaction. A sample of employees was randomly selected from each of three companies with different management styles (Authoritarian, Laissez-faire and Participative) and asked to rate their level of job satisfaction on a 10-point scale (10 being the highest level of satisfaction). The data collected and partial ANOVA results appear below.
The P-value for this statistic turns out to be < 0.001. Therefore, at α = 0.05
A) we fail to reject the null hypothesis.
B) we reject the null hypothesis and conclude that at least two mean employee job satisfaction ratings are different.
C) we conclude that mean employee job satisfaction ratings are all equal across companies with different management styles.
D) we support the null hypothesis and conclude that management style does not affect employee job satisfaction rating.
E) we reject the alternative hypothesis and conclude that mean employee job satisfaction ratings are all equal across companies with different management styles.
Question
A health food company wants to determine the best process for blanching dark green vegetable material so it can be added to other food products without losing vitamin A. They are examining three different blanching processes to determine which is best in terms of vitamin A retention (mg/100mg). The data collected and partial ANOVA results appear below.
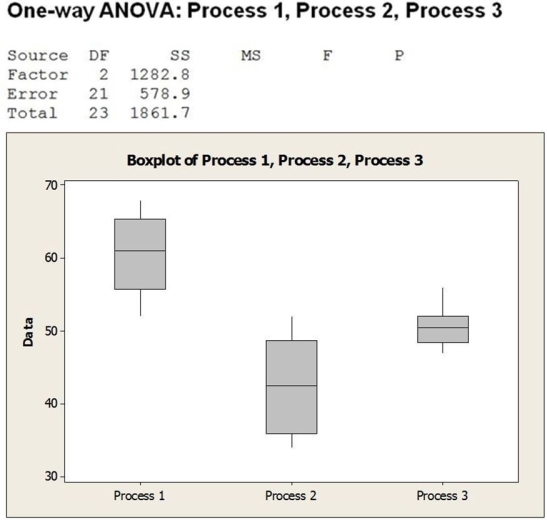
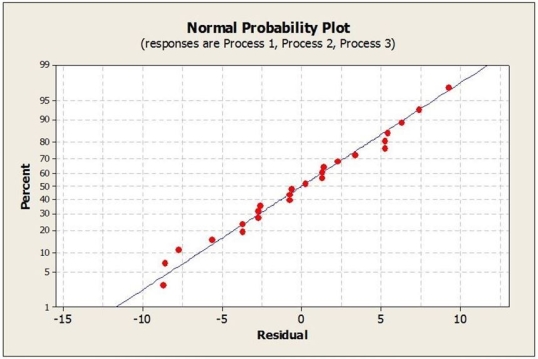 a. What are the null and alternative hypotheses (in words, not symbols)?
b. Are the conditions / assumptions for ANOVA met?
c. Calculate the F-statistic.
d. The P-value for this statistic turns out to be < .001. State the conclusion.
e. Suppose the company is concerned about whether different batches of green vegetable material would blanch differently. Suggest how the design for the study could have been improved to take this into account.
a. What are the null and alternative hypotheses (in words, not symbols)?b. Are the conditions / assumptions for ANOVA met?
c. Calculate the F-statistic.
d. The P-value for this statistic turns out to be < .001. State the conclusion.
e. Suppose the company is concerned about whether different batches of green vegetable material would blanch differently. Suggest how the design for the study could have been improved to take this into account.
Question
Consider the following to answer the question(s) below:
Management styles differ among organizations and may potentially affect employee job satisfaction. A sample of employees was randomly selected from each of three companies with different management styles (Authoritarian, Laissez-faire and Participative) and asked to rate their level of job satisfaction on a 10-point scale (10 being the highest level of satisfaction). The data collected and partial ANOVA results appear below.
Suppose that employees fall into several job categories, such as clerical, technical, or professional. Which of the following statements is true?
A) We are sure that job category is not a confounding variable.
B) Job category may be an outlier variable.
C) A randomized block design using job category as the blocking variable cannot improve the study.
D) Job category may be a confounding variable, and a randomized block design using job category as the blocking variable might improve the study.
E) Job category is not a lurking variable, and a randomized block design using job category as the blocking variable cannot improve the study.
Question
Consider the following to answer the question(s):
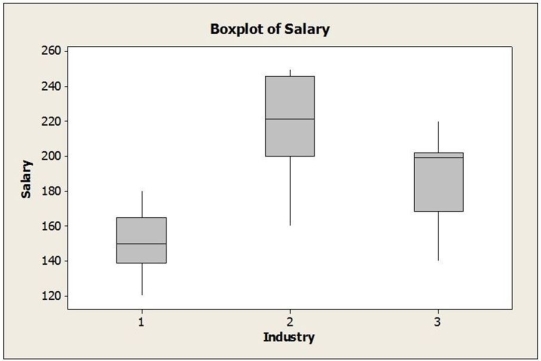
An advocacy group is interested in determining if gender (1 = Female, 2 = Male) affects executive level salaries. They take a random sample of executives in three different industries: (1 = Consumer Goods, 2 = Financial, 3 = Health Care). Salary data are collected. The two-way ANOVA results appear below.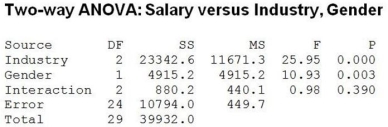
At α = 0.05, we can conclude
A) that mean executive salaries are the same across the three different industry sectors.
B) that mean executive salaries are the same for males and females.
C) that there is a significant interaction effect.
D) that mean executive salaries are not the same across the three different industry sectors and that mean executive salaries are not the same for males and females.
E) that the P-value for the interaction effect = 0.390 > 0.05. Thus, it is not appropriate to interpret the main effects separately.
Question
Consider the following to answer the question(s) below:
Management styles differ among organizations and may potentially affect employee job satisfaction. A sample of employees was randomly selected from each of three companies with different management styles (Authoritarian, Laissez-faire and Participative) and asked to rate their level of job satisfaction on a 10-point scale (10 being the highest level of satisfaction). The data collected and partial ANOVA results appear below.
The F-statistic value is
A) F = 35.16.
B) F = 2.604.
C) F = 48.7.
D) F = 1.385.
E) F = 3.60.
Question
An advocacy group is interested in determining if gender (1 = Female, 2 = Male) affects executive level salaries. They take a random sample of executives in three different industries: (1 = Consumer Goods, 2 = Financial, 3 = Health Care). Salary data are collected. The two-way ANOVA results appear below. 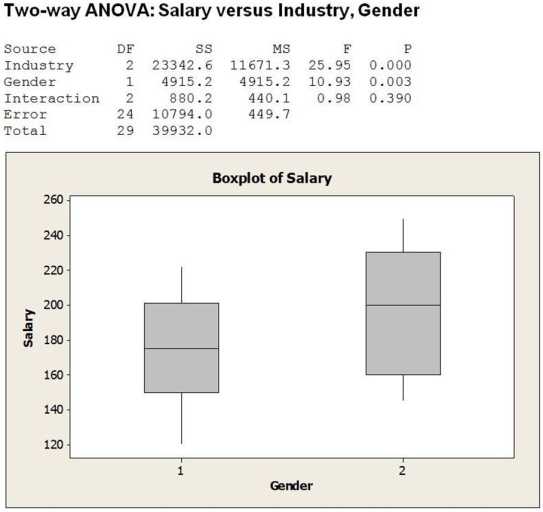
 a. Is this an experiment or observational study?
b. Are the conditions for two-way ANOVA met?
c. If so, perform the hypothesis tests and state your conclusions in terms of amount spent online, gender, and income level.
d. Is it appropriate to interpret the main effects in this case separately? Explain.
a. Is this an experiment or observational study?b. Are the conditions for two-way ANOVA met?
c. If so, perform the hypothesis tests and state your conclusions in terms of amount spent online, gender, and income level.
d. Is it appropriate to interpret the main effects in this case separately? Explain.
Question
Consider the following to answer the question(s):
An advocacy group is interested in determining if gender (1 = Female, 2 = Male) affects executive level salaries. They take a random sample of executives in three different industries: (1 = Consumer Goods, 2 = Financial, 3 = Health Care). Salary data are collected. The two-way ANOVA results appear below.
Which of the following statements is true?
A) This is an experiment.
B) This is an observational study.
C) This is a randomized block design.
D) This is an experimental study involving a randomized block design.
E) This is a completely randomized design.
Question
Consider the following to answer the question(s) below:
An Internet service provider is interested in testing to see if there is a difference in the mean weekly connect time for users who come into the service through a dial-up line, DSL, or cable Internet. To test this, the ISP has selected random samples from each category of users and recorded the connect time during a week period. The following is partial Excel output for the data.
The P-value for this statistic is < 0.001. Therefore, at α = 0.05
A) we reject the null hypothesis and conclude that at least two of the mean weekly connect times are different.
B) we fail to reject the null hypothesis.
C) we know average connect times are the same for all connection methods.
D) we reject the alternative hypothesis and conclude that the average weekly connect times are the same for all three methods of connection.
E) we support the null hypothesis and conclude that the method of connection is not significant.
Question
Question
Consider the following to answer the question(s) below:
A national car rental company recently conducted a study in which cars with automatic and standard transmissions were rented to male and female customers. Three customers in each category were randomly selected and the number of miles driven per day was recorded as follows:
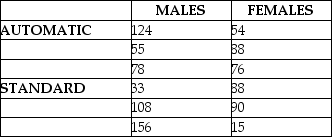
Based on the design of this study, how many degrees of freedom will be associated with the mean squares for the type of transmission?
A) 1
B) 2
C) 3
D) 6
E) 8
A national car rental company recently conducted a study in which cars with automatic and standard transmissions were rented to male and female customers. Three customers in each category were randomly selected and the number of miles driven per day was recorded as follows:
Based on the design of this study, how many degrees of freedom will be associated with the mean squares for the type of transmission?
A) 1
B) 2
C) 3
D) 6
E) 8
Question
Consider the following to answer the question(s) below:
To test the fuel efficiency of three new car models, random samples of twenty were selected from each of the models and litres/100 kilometres data obtained. Partial output follows.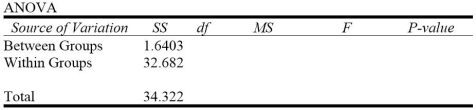
What is the mean square due to treatments?
A) 0.82
B) 0.57
C) 0.03
D) 1.63
E) 0.55
To test the fuel efficiency of three new car models, random samples of twenty were selected from each of the models and litres/100 kilometres data obtained. Partial output follows.
What is the mean square due to treatments?
A) 0.82
B) 0.57
C) 0.03
D) 1.63
E) 0.55
Question
Consider the following to answer the question(s) below:
To test the fuel efficiency of three new car models, random samples of twenty were selected from each of the models and litres/100 kilometres data obtained. Partial output follows.
The correct value of the F-statistic is
A) 1.44.
B) 0.70.
C) 1.49.
D) 0.50.
E) 1.04.
To test the fuel efficiency of three new car models, random samples of twenty were selected from each of the models and litres/100 kilometres data obtained. Partial output follows.
The correct value of the F-statistic is
A) 1.44.
B) 0.70.
C) 1.49.
D) 0.50.
E) 1.04.
Question
Question
Consider the following to answer the question(s) below:
To test the fuel efficiency of three new car models, random samples of twenty were selected from each of the models and litres/100 kilometres data obtained. Partial output follows.
What is the mean square due to the error?
A) 0.57
B) 0.82
C) 0.03
D) 0.55
E) 1.63
To test the fuel efficiency of three new car models, random samples of twenty were selected from each of the models and litres/100 kilometres data obtained. Partial output follows.
What is the mean square due to the error?
A) 0.57
B) 0.82
C) 0.03
D) 0.55
E) 1.63

Unlock Deck
Sign up to unlock the cards in this deck!
Unlock Deck
Unlock Deck
1/24
Play
Full screen (f)
Deck 15: Design of Experiments and Analysis of Variance Anova
1
A survey of online consumers asked respondents to indicate how much money they spent for online purchases during the most recent Christmas holiday season. These data were analyzed to see if gender (1= Female; 2 = Male) and income level (1 = Low, 2 = Middle, 3 = High) influence the amount consumers spend online for holiday shopping. The two-way ANOVA results appear below. a. Is this an experiment or observational study?
b. Are the conditions for two-way ANOVA met?
c. If so, perform the hypothesis tests and state your conclusions in terms of amount spent online, gender and income level.
d. Is it appropriate to interpret the main effects in this case separately? Explain.
a. Is this an experiment or observational study?b. Are the conditions for two-way ANOVA met?
c. If so, perform the hypothesis tests and state your conclusions in terms of amount spent online, gender and income level.
d. Is it appropriate to interpret the main effects in this case separately? Explain.
a. Observational study.
b. Boxplots of online expenditures ($) during the last holiday shopping season by both income level and gender appear to satisfy the equal variance assumption. Also, the boxplots appear fairly symmetric. We can only assume that the survey participants were selected at random.
c. All P-values are very small. This indicates a significant interaction effect as well as significant main effects.
d. Since the interaction effect of gender and income level on online expenditure is significant, it is not appropriate to interpret the main effects due to gender and income level separately.
2
Management styles differ among organizations and may potentially affect employee job satisfaction. A sample of employees was randomly selected from each of three companies with different management styles (Authoritarian, Laissez-faire and Participative) and asked to rate their level of job satisfaction on a 10-point scale (10 being the highest level of satisfaction). The data collected and partial ANOVA results appear below.
a. What are the null and alternative hypotheses (in words, not symbols)?
b. Are the conditions / assumptions for ANOVA met?
c. Calculate the F-statistic.
d. The P-value for this statistic turns out to be < .001. State the conclusion.
e. Suppose that employees fall into several job categories, such as clerical, technical, or professional. How might this affect the study results? Suggest how the design for the study could have been improved.
a. What are the null and alternative hypotheses (in words, not symbols)?b. Are the conditions / assumptions for ANOVA met?
c. Calculate the F-statistic.
d. The P-value for this statistic turns out to be < .001. State the conclusion.
e. Suppose that employees fall into several job categories, such as clerical, technical, or professional. How might this affect the study results? Suggest how the design for the study could have been improved.
a. H0: Mean employee job satisfaction ratings are equal across companies with different management styles.
HA: At least one mean employee job satisfaction rating is different from the others.
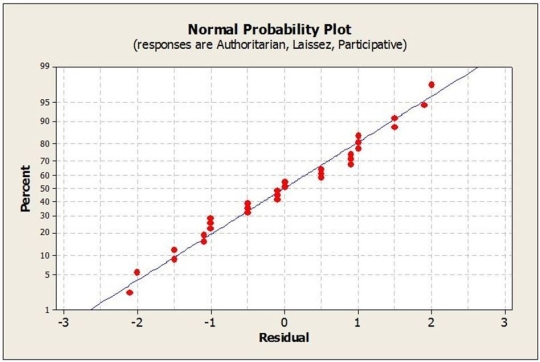
b. Employees were randomly selected from each of the three companies. Therefore, the independence assumption holds. Boxplots of the original data indicate that the equal variance assumption is reasonable. The Normal probability plot of residuals indicates that the Nearly Normal Condition is reasonable.
c. F = 35.16
d. With such a small P-value = 3.039E-08 (using technology), we can reject the null hypothesis and conclude that at least one mean employee job satisfaction rating is different from the others.
e. Job category may be a confounding variable. A randomized block design using job category as the blocking variable might improve the study.
HA: At least one mean employee job satisfaction rating is different from the others.
b. Employees were randomly selected from each of the three companies. Therefore, the independence assumption holds. Boxplots of the original data indicate that the equal variance assumption is reasonable. The Normal probability plot of residuals indicates that the Nearly Normal Condition is reasonable.
c. F = 35.16
d. With such a small P-value = 3.039E-08 (using technology), we can reject the null hypothesis and conclude that at least one mean employee job satisfaction rating is different from the others.
e. Job category may be a confounding variable. A randomized block design using job category as the blocking variable might improve the study.
3
Consider the following to answer the question(s) below:
An Internet service provider is interested in testing to see if there is a difference in the mean weekly connect time for users who come into the service through a dial-up line, DSL, or cable Internet. To test this, the ISP has selected random samples from each category of users and recorded the connect time during a week period. The following is partial Excel output for the data.
The correct null hypothesis is
A) mean weekly connect times are equal regardless of the method of connection.
B) mean weekly connect times are not all equal regardless of the method of connection.
C) two mean weekly connect times are equal, and one mean is different.
D) method of internet connection has an impact on average weekly connect times.
E) only DSL and Cable Internet are significant.
mean weekly connect times are equal regardless of the method of connection.
4
Given the following output, which of the following statements is not true at α = 0.05?
A) Since the interaction effect of gender and transmission type on miles driven is significant, it is appropriate to interpret the main effects due to gender and transmission type separately.
B) We fail to reject the null hypothesis that the mean number of miles driven per day is the same for both types of transmission.
C) We fail to reject the null hypothesis that the mean number of miles driven per day is the same for male and female customers.
D) Since the P-value is fairly high, the interaction effect of gender and transmission type on miles driven is not significant.
E) Since all P-values are fairly high, we fail to reject all three null hypotheses.
Unlock Deck
Unlock for access to all 24 flashcards in this deck.
Unlock Deck
k this deck
5
Consider the following to answer the question(s) below:
A health food company wants to determine the best process for blanching dark green vegetable material so it can be added to other food products without losing vitamin A. They are examining three different blanching processes to determine which is best in terms of vitamin A retention (mg/100mg). The data collected and partial ANOVA results appear below.
The P-value for this statistic turns out to be < 0.001. Therefore, at α = 0.05
A) we fail to reject the null hypothesis.
B) we reject the alternative hypothesis.
C) we conclude that mean vitamin A retention amounts are all equal across the different blanching processes.
D) we support the null hypothesis and conclude that at least two mean vitamin A retention amounts are equal.
E) we reject the null hypothesis and conclude that at least one mean vitamin A retention amount is different from the others.
Unlock Deck
Unlock for access to all 24 flashcards in this deck.
Unlock Deck
k this deck
6
Consider the following to answer the question(s) below:
Management styles differ among organizations and may potentially affect employee job satisfaction. A sample of employees was randomly selected from each of three companies with different management styles (Authoritarian, Laissez-faire and Participative) and asked to rate their level of job satisfaction on a 10-point scale (10 being the highest level of satisfaction). The data collected and partial ANOVA results appear below.
The correct null hypothesis is
A) exactly two mean employee job satisfaction ratings are equal, and one mean is different.
B) mean employee job satisfaction ratings are not all equal across companies with different management styles.
C) management style affects employee job satisfaction rating.
D) mean employee job satisfaction ratings are equal across companies with different management styles.
E) two particular management styles affect employee job satisfaction rating, and one style is not significant.
Unlock Deck
Unlock for access to all 24 flashcards in this deck.
Unlock Deck
k this deck
7
Consider the following to answer the question(s) below:
A health food company wants to determine the best process for blanching dark green vegetable material so it can be added to other food products without losing vitamin A. They are examining three different blanching processes to determine which is best in terms of vitamin A retention (mg/100mg). The data collected and partial ANOVA results appear below.
The F-statistic value is
A) F = 23.267.
B) F = 2.215.
C) F = 27.57.
D) F = 7.999.
E) F = 3.22.
Unlock Deck
Unlock for access to all 24 flashcards in this deck.
Unlock Deck
k this deck
8
Consider the following to answer the question(s) below:
A health food company wants to determine the best process for blanching dark green vegetable material so it can be added to other food products without losing vitamin A. They are examining three different blanching processes to determine which is best in terms of vitamin A retention (mg/100mg). The data collected and partial ANOVA results appear below.
The correct null hypothesis is
A) mean vitamin A retention amounts are not all equal across the three blanching processes.
B) mean vitamin A retention amounts are equal across the three blanching processes.
C) blanching process has an effect on vitamin A retention.
D) all three blanching processes are different from each other.
E) exactly two mean vitamin A retention amounts are equal across the two particular blanching processes, and one mean is different.
Unlock Deck
Unlock for access to all 24 flashcards in this deck.
Unlock Deck
k this deck
9
Consider the following to answer the question(s) below:
An Internet service provider is interested in testing to see if there is a difference in the mean weekly connect time for users who come into the service through a dial-up line, DSL, or cable Internet. To test this, the ISP has selected random samples from each category of users and recorded the connect time during a week period. The following is partial Excel output for the data.
The F-statistic value is
A) 43.88.
B) 962.72.
C) 21.94.
D) 0.02.
E) 3.554.
Unlock Deck
Unlock for access to all 24 flashcards in this deck.
Unlock Deck
k this deck
10
A survey of online consumers asked respondents to indicate how much money they spent for online purchases during the most recent Christmas holiday season. These data were analyzed to see if gender and income level influence the amount consumers spend online for holiday shopping. The two-way ANOVA results appear below. Which of the following statements is true?
A) This is an experiment.
B) This is a randomized block design.
C) Since the interaction effect of gender and income level on online expenditure is significant, it is not appropriate to interpret the main effects due to gender and income level separately.
D) Only income level is significant.
E) The interaction effect of gender and income level on online expenditure is not significant.
Which of the following statements is true?A) This is an experiment.
B) This is a randomized block design.
C) Since the interaction effect of gender and income level on online expenditure is significant, it is not appropriate to interpret the main effects due to gender and income level separately.
D) Only income level is significant.
E) The interaction effect of gender and income level on online expenditure is not significant.
Unlock Deck
Unlock for access to all 24 flashcards in this deck.
Unlock Deck
k this deck
11
Consider the following to answer the question(s) below:
Management styles differ among organizations and may potentially affect employee job satisfaction. A sample of employees was randomly selected from each of three companies with different management styles (Authoritarian, Laissez-faire and Participative) and asked to rate their level of job satisfaction on a 10-point scale (10 being the highest level of satisfaction). The data collected and partial ANOVA results appear below.
The P-value for this statistic turns out to be < 0.001. Therefore, at α = 0.05
A) we fail to reject the null hypothesis.
B) we reject the null hypothesis and conclude that at least two mean employee job satisfaction ratings are different.
C) we conclude that mean employee job satisfaction ratings are all equal across companies with different management styles.
D) we support the null hypothesis and conclude that management style does not affect employee job satisfaction rating.
E) we reject the alternative hypothesis and conclude that mean employee job satisfaction ratings are all equal across companies with different management styles.
Unlock Deck
Unlock for access to all 24 flashcards in this deck.
Unlock Deck
k this deck
12
A health food company wants to determine the best process for blanching dark green vegetable material so it can be added to other food products without losing vitamin A. They are examining three different blanching processes to determine which is best in terms of vitamin A retention (mg/100mg). The data collected and partial ANOVA results appear below.
a. What are the null and alternative hypotheses (in words, not symbols)?
b. Are the conditions / assumptions for ANOVA met?
c. Calculate the F-statistic.
d. The P-value for this statistic turns out to be < .001. State the conclusion.
e. Suppose the company is concerned about whether different batches of green vegetable material would blanch differently. Suggest how the design for the study could have been improved to take this into account.
a. What are the null and alternative hypotheses (in words, not symbols)?b. Are the conditions / assumptions for ANOVA met?
c. Calculate the F-statistic.
d. The P-value for this statistic turns out to be < .001. State the conclusion.
e. Suppose the company is concerned about whether different batches of green vegetable material would blanch differently. Suggest how the design for the study could have been improved to take this into account.
Unlock Deck
Unlock for access to all 24 flashcards in this deck.
Unlock Deck
k this deck
13
Consider the following to answer the question(s) below:
Management styles differ among organizations and may potentially affect employee job satisfaction. A sample of employees was randomly selected from each of three companies with different management styles (Authoritarian, Laissez-faire and Participative) and asked to rate their level of job satisfaction on a 10-point scale (10 being the highest level of satisfaction). The data collected and partial ANOVA results appear below.
Suppose that employees fall into several job categories, such as clerical, technical, or professional. Which of the following statements is true?
A) We are sure that job category is not a confounding variable.
B) Job category may be an outlier variable.
C) A randomized block design using job category as the blocking variable cannot improve the study.
D) Job category may be a confounding variable, and a randomized block design using job category as the blocking variable might improve the study.
E) Job category is not a lurking variable, and a randomized block design using job category as the blocking variable cannot improve the study.
Unlock Deck
Unlock for access to all 24 flashcards in this deck.
Unlock Deck
k this deck
14
Consider the following to answer the question(s):
An advocacy group is interested in determining if gender (1 = Female, 2 = Male) affects executive level salaries. They take a random sample of executives in three different industries: (1 = Consumer Goods, 2 = Financial, 3 = Health Care). Salary data are collected. The two-way ANOVA results appear below.
At α = 0.05, we can conclude
A) that mean executive salaries are the same across the three different industry sectors.
B) that mean executive salaries are the same for males and females.
C) that there is a significant interaction effect.
D) that mean executive salaries are not the same across the three different industry sectors and that mean executive salaries are not the same for males and females.
E) that the P-value for the interaction effect = 0.390 > 0.05. Thus, it is not appropriate to interpret the main effects separately.
Unlock Deck
Unlock for access to all 24 flashcards in this deck.
Unlock Deck
k this deck
15
Consider the following to answer the question(s) below:
Management styles differ among organizations and may potentially affect employee job satisfaction. A sample of employees was randomly selected from each of three companies with different management styles (Authoritarian, Laissez-faire and Participative) and asked to rate their level of job satisfaction on a 10-point scale (10 being the highest level of satisfaction). The data collected and partial ANOVA results appear below.
The F-statistic value is
A) F = 35.16.
B) F = 2.604.
C) F = 48.7.
D) F = 1.385.
E) F = 3.60.
Unlock Deck
Unlock for access to all 24 flashcards in this deck.
Unlock Deck
k this deck
16
An advocacy group is interested in determining if gender (1 = Female, 2 = Male) affects executive level salaries. They take a random sample of executives in three different industries: (1 = Consumer Goods, 2 = Financial, 3 = Health Care). Salary data are collected. The two-way ANOVA results appear below. a. Is this an experiment or observational study?
b. Are the conditions for two-way ANOVA met?
c. If so, perform the hypothesis tests and state your conclusions in terms of amount spent online, gender, and income level.
d. Is it appropriate to interpret the main effects in this case separately? Explain.
a. Is this an experiment or observational study?b. Are the conditions for two-way ANOVA met?
c. If so, perform the hypothesis tests and state your conclusions in terms of amount spent online, gender, and income level.
d. Is it appropriate to interpret the main effects in this case separately? Explain.
Unlock Deck
Unlock for access to all 24 flashcards in this deck.
Unlock Deck
k this deck
17
Consider the following to answer the question(s):
An advocacy group is interested in determining if gender (1 = Female, 2 = Male) affects executive level salaries. They take a random sample of executives in three different industries: (1 = Consumer Goods, 2 = Financial, 3 = Health Care). Salary data are collected. The two-way ANOVA results appear below.
Which of the following statements is true?
A) This is an experiment.
B) This is an observational study.
C) This is a randomized block design.
D) This is an experimental study involving a randomized block design.
E) This is a completely randomized design.
Unlock Deck
Unlock for access to all 24 flashcards in this deck.
Unlock Deck
k this deck
18
Consider the following to answer the question(s) below:
An Internet service provider is interested in testing to see if there is a difference in the mean weekly connect time for users who come into the service through a dial-up line, DSL, or cable Internet. To test this, the ISP has selected random samples from each category of users and recorded the connect time during a week period. The following is partial Excel output for the data.
The P-value for this statistic is < 0.001. Therefore, at α = 0.05
A) we reject the null hypothesis and conclude that at least two of the mean weekly connect times are different.
B) we fail to reject the null hypothesis.
C) we know average connect times are the same for all connection methods.
D) we reject the alternative hypothesis and conclude that the average weekly connect times are the same for all three methods of connection.
E) we support the null hypothesis and conclude that the method of connection is not significant.
Unlock Deck
Unlock for access to all 24 flashcards in this deck.
Unlock Deck
k this deck
19
In a completely randomized design, which of the following is true?
A) The mean squares due to treatments will be larger than the mean squares due to error if the null hypothesis is rejected.
B) The mean squares due to treatments will be smaller than the mean squares due to error if the null hypothesis is rejected.
C) The sum of squares due to treatments will be equal to the sum of squares due to error if the null hypothesis is rejected.
D) The populations must have equal means.
E) The sample sizes must be equal.
Unlock Deck
Unlock for access to all 24 flashcards in this deck.
Unlock Deck
k this deck
20
Consider the following to answer the question(s) below:
A national car rental company recently conducted a study in which cars with automatic and standard transmissions were rented to male and female customers. Three customers in each category were randomly selected and the number of miles driven per day was recorded as follows:
Based on the design of this study, how many degrees of freedom will be associated with the mean squares for the type of transmission?
A) 1
B) 2
C) 3
D) 6
E) 8
Unlock Deck
Unlock for access to all 24 flashcards in this deck.
Unlock Deck
k this deck
21
Consider the following to answer the question(s) below:
To test the fuel efficiency of three new car models, random samples of twenty were selected from each of the models and litres/100 kilometres data obtained. Partial output follows.
What is the mean square due to treatments?
A) 0.82
B) 0.57
C) 0.03
D) 1.63
E) 0.55
To test the fuel efficiency of three new car models, random samples of twenty were selected from each of the models and litres/100 kilometres data obtained. Partial output follows.
What is the mean square due to treatments?
A) 0.82
B) 0.57
C) 0.03
D) 1.63
E) 0.55
Unlock Deck
Unlock for access to all 24 flashcards in this deck.
Unlock Deck
k this deck
22
Consider the following to answer the question(s) below:
To test the fuel efficiency of three new car models, random samples of twenty were selected from each of the models and litres/100 kilometres data obtained. Partial output follows.
The correct value of the F-statistic is
A) 1.44.
B) 0.70.
C) 1.49.
D) 0.50.
E) 1.04.
To test the fuel efficiency of three new car models, random samples of twenty were selected from each of the models and litres/100 kilometres data obtained. Partial output follows.
The correct value of the F-statistic is
A) 1.44.
B) 0.70.
C) 1.49.
D) 0.50.
E) 1.04.
Unlock Deck
Unlock for access to all 24 flashcards in this deck.
Unlock Deck
k this deck
23
Which of the following is not a principle of experimental design?
A) Balance
B) Control
C) Randomization
D) Blocking
E) Replication
A) Balance
B) Control
C) Randomization
D) Blocking
E) Replication
Unlock Deck
Unlock for access to all 24 flashcards in this deck.
Unlock Deck
k this deck
24
Consider the following to answer the question(s) below:
To test the fuel efficiency of three new car models, random samples of twenty were selected from each of the models and litres/100 kilometres data obtained. Partial output follows.
What is the mean square due to the error?
A) 0.57
B) 0.82
C) 0.03
D) 0.55
E) 1.63
To test the fuel efficiency of three new car models, random samples of twenty were selected from each of the models and litres/100 kilometres data obtained. Partial output follows.
What is the mean square due to the error?
A) 0.57
B) 0.82
C) 0.03
D) 0.55
E) 1.63
Unlock Deck
Unlock for access to all 24 flashcards in this deck.
Unlock Deck
k this deck
Unlock Deck
Unlock for access to all 24 flashcards in this deck.


