Deck 7: Introduction to Linear Regression
Full screen (f)
Question
Consider the following to answer the question(s) below:
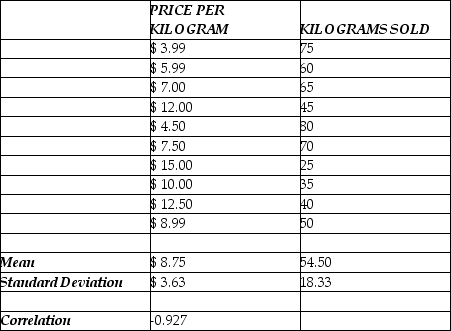
A small independent organic food store offers a variety of specialty coffees. To determine whether price has an impact on sales, the managers kept track of how many kilograms of each variety of coffee were sold last month. The data, scatterplot, and summary statistics are shown below.
 Note: In answers to problems 2, 4, and 5 we will be using regression equation coefficients received by computer software. If we apply textbook formulae, the value of intercept will be a little bit different.
Using the estimated regression equation,
a. Estimate the monthly sales (kilograms sold) for a variety of coffee that costs $12.00 per kilogram.
b. What is the residual for this estimate? What does it mean?
A small independent organic food store offers a variety of specialty coffees. To determine whether price has an impact on sales, the managers kept track of how many kilograms of each variety of coffee were sold last month. The data, scatterplot, and summary statistics are shown below.
Note: In answers to problems 2, 4, and 5 we will be using regression equation coefficients received by computer software. If we apply textbook formulae, the value of intercept will be a little bit different.Using the estimated regression equation,
a. Estimate the monthly sales (kilograms sold) for a variety of coffee that costs $12.00 per kilogram.
b. What is the residual for this estimate? What does it mean?
Question
Consider the following to answer the question(s) below:
A small independent organic food store offers a variety of specialty coffees. To determine whether price has an impact on sales, the managers kept track of how many kilograms of each variety of coffee were sold last month. The data, scatterplot and summary statistics are shown below.


The intercept of the estimated regression line that relates the response variable (Kilograms Sold) to the predictor variable (Price per Kilogram) is
A) 95.47.
B) 0.858.
C) -4.684.
D) -0.858.
E) -8.999.
A small independent organic food store offers a variety of specialty coffees. To determine whether price has an impact on sales, the managers kept track of how many kilograms of each variety of coffee were sold last month. The data, scatterplot and summary statistics are shown below.
The intercept of the estimated regression line that relates the response variable (Kilograms Sold) to the predictor variable (Price per Kilogram) is
A) 95.47.
B) 0.858.
C) -4.684.
D) -0.858.
E) -8.999.
Question
Consider the following to answer the question(s) below:
A small independent organic food store offers a variety of specialty coffees. To determine whether price has an impact on sales, the managers kept track of how many kilograms of each variety of coffee were sold last month. The data, scatterplot, and summary statistics are shown below.
Note: In answers to problems 2, 4, and 5 we will be using regression equation coefficients received by computer software. If we apply textbook formulae, the value of intercept will be a little bit different.
Comment on whether each of the following conditions for correlation / linear regression is met.
a. Quantitative Variables Condition
b. Linearity Condition
c. Outlier Condition
A small independent organic food store offers a variety of specialty coffees. To determine whether price has an impact on sales, the managers kept track of how many kilograms of each variety of coffee were sold last month. The data, scatterplot, and summary statistics are shown below.
Note: In answers to problems 2, 4, and 5 we will be using regression equation coefficients received by computer software. If we apply textbook formulae, the value of intercept will be a little bit different.Comment on whether each of the following conditions for correlation / linear regression is met.
a. Quantitative Variables Condition
b. Linearity Condition
c. Outlier Condition
Question
Consider the following to answer the question(s) below:
A small independent organic food store offers a variety of specialty coffees. To determine whether price has an impact on sales, the managers kept track of how many kilograms of each variety of coffee were sold last month. The data, scatterplot, and summary statistics are shown below.
Note: In answers to problems 2, 4, and 5 we will be using regression equation coefficients received by computer software. If we apply textbook formulae, the value of intercept will be a little bit different.
Using the estimated regression equation,
a. Estimate the monthly sales for a variety of coffee that costs $20.00 per kilogram.
b. How confident should you be in this estimate? Explain.
A small independent organic food store offers a variety of specialty coffees. To determine whether price has an impact on sales, the managers kept track of how many kilograms of each variety of coffee were sold last month. The data, scatterplot, and summary statistics are shown below.
Note: In answers to problems 2, 4, and 5 we will be using regression equation coefficients received by computer software. If we apply textbook formulae, the value of intercept will be a little bit different.Using the estimated regression equation,
a. Estimate the monthly sales for a variety of coffee that costs $20.00 per kilogram.
b. How confident should you be in this estimate? Explain.
Question
Consider the following to answer the question(s) below:
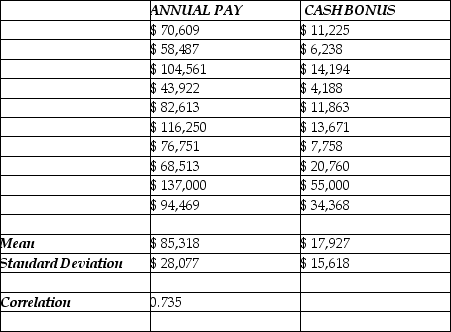
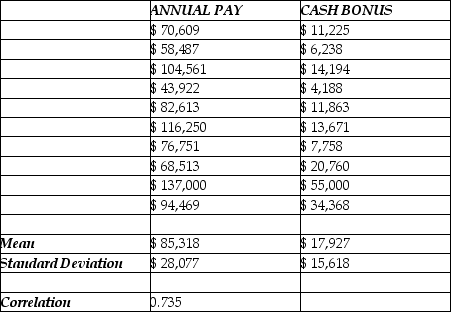
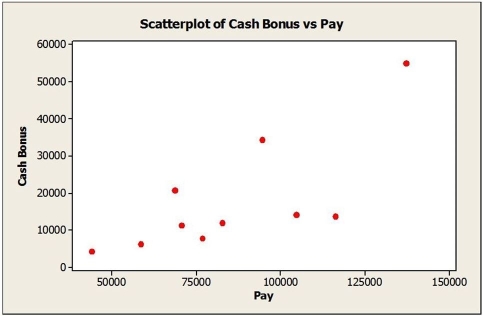
To determine whether the cash bonuses paid by Johnson Financial Group are related to annual pay, data were gathered for 10 account executives who received such bonuses in 2007. The data, scatterplot and summary statistics are shown below.
The intercept of the estimated regression line that relates the response variable (Cash Bonus) to the predictor variable (Annual Pay) is
A) 0.409.
B) -16,945.
C) 0.54.
D) 3.45.
E) 1.32.
Question
Consider the following to answer the question(s) below:
To determine whether the cash bonuses paid by Johnson Financial Group are related to annual pay, data were gathered for 10 account executives who received such bonuses in 2007. The data, scatterplot and summary statistics are shown below.
Based on the estimated regression equation, the residual for the estimated cash bonus of an executive at Johnson Financial Group earning $82,613 a year would be
A) $0.
B) -$4,981.
C) -$15,819.
D) -$4,958.
E) $15,819.
Question
Consider the following to answer the question(s) below:
A small independent organic food store offers a variety of specialty coffees. To determine whether price has an impact on sales, the managers kept track of how many kilograms of each variety of coffee were sold last month. The data, scatterplot, and summary statistics are shown below.
Note: In answers to problems 2, 4, and 5 we will be using regression equation coefficients received by computer software. If we apply textbook formulae, the value of intercept will be a little bit different.
Estimate the linear regression model that relates the response variable (Kilograms Sold) to the predictor variable (Price per Kilogram).
a. Find the slope of the regression line.
b. Find the intercept of the regression line.
c. Write the equation of the linear model.
A small independent organic food store offers a variety of specialty coffees. To determine whether price has an impact on sales, the managers kept track of how many kilograms of each variety of coffee were sold last month. The data, scatterplot, and summary statistics are shown below.
Note: In answers to problems 2, 4, and 5 we will be using regression equation coefficients received by computer software. If we apply textbook formulae, the value of intercept will be a little bit different.Estimate the linear regression model that relates the response variable (Kilograms Sold) to the predictor variable (Price per Kilogram).
a. Find the slope of the regression line.
b. Find the intercept of the regression line.
c. Write the equation of the linear model.
Question
Consider the following to answer the question(s) below:
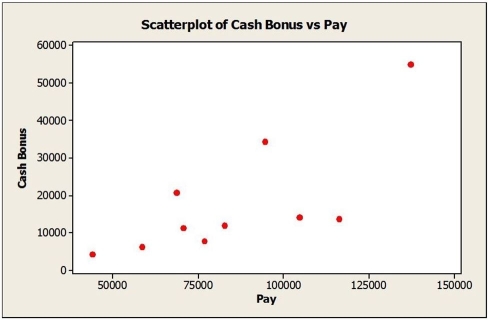
To determine whether the cash bonuses paid by Johnson Financial Group are related to annual pay, data were gathered for 10 account executives who received such bonuses in 2007. The data, scatterplot and summary statistics are shown below.
 Note: In answers to problems 2, 4, and 5 we will be using regression equation coefficients received by computer software. If we apply textbook formulae, the value of intercept will be a little bit different.
Comment on whether each of the following conditions for correlation / linear regression is met.
a. Quantitative Variables Condition
b. Linearity Condition
c. Outlier Condition
To determine whether the cash bonuses paid by Johnson Financial Group are related to annual pay, data were gathered for 10 account executives who received such bonuses in 2007. The data, scatterplot and summary statistics are shown below.
Note: In answers to problems 2, 4, and 5 we will be using regression equation coefficients received by computer software. If we apply textbook formulae, the value of intercept will be a little bit different.Comment on whether each of the following conditions for correlation / linear regression is met.
a. Quantitative Variables Condition
b. Linearity Condition
c. Outlier Condition
Question
Consider the following to answer the question(s) below:
A small independent organic food store offers a variety of specialty coffees. To determine whether price has an impact on sales, the managers kept track of how many kilograms of each variety of coffee were sold last month. The data, scatterplot, and summary statistics are shown below.
Note: In answers to problems 2, 4, and 5 we will be using regression equation coefficients received by computer software. If we apply textbook formulae, the value of intercept will be a little bit different.
Below is a plot showing residuals versus fitted values for the estimated regression equation relating monthly sales of coffee to price per kilogram. Are all the conditions for linear regression met? Explain.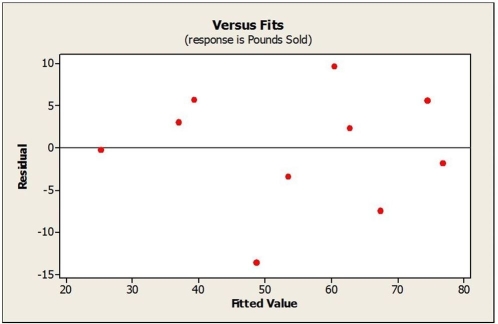
A small independent organic food store offers a variety of specialty coffees. To determine whether price has an impact on sales, the managers kept track of how many kilograms of each variety of coffee were sold last month. The data, scatterplot, and summary statistics are shown below.
Note: In answers to problems 2, 4, and 5 we will be using regression equation coefficients received by computer software. If we apply textbook formulae, the value of intercept will be a little bit different.Below is a plot showing residuals versus fitted values for the estimated regression equation relating monthly sales of coffee to price per kilogram. Are all the conditions for linear regression met? Explain.
Question
Consider the following to answer the question(s) below:
To determine whether the cash bonuses paid by Johnson Financial Group are related to annual pay, data were gathered for 10 account executives who received such bonuses in 2007. The data, scatterplot and summary statistics are shown below.
Note: In answers to problems 2, 4, and 5 we will be using regression equation coefficients received by computer software. If we apply textbook formulae, the value of intercept will be a little bit different.
Estimate the linear regression model that relates the response variable (Cash Bonus) to the predictor variable (Annual Pay).
a. Find the slope of the regression line.
b. Find the intercept of the regression line.
c. Write the equation of the linear model.
To determine whether the cash bonuses paid by Johnson Financial Group are related to annual pay, data were gathered for 10 account executives who received such bonuses in 2007. The data, scatterplot and summary statistics are shown below.
Note: In answers to problems 2, 4, and 5 we will be using regression equation coefficients received by computer software. If we apply textbook formulae, the value of intercept will be a little bit different.Estimate the linear regression model that relates the response variable (Cash Bonus) to the predictor variable (Annual Pay).
a. Find the slope of the regression line.
b. Find the intercept of the regression line.
c. Write the equation of the linear model.
Question
Consider the following to answer the question(s) below:
To determine whether the cash bonuses paid by Johnson Financial Group are related to annual pay, data were gathered for 10 account executives who received such bonuses in 2007. The data, scatterplot and summary statistics are shown below.
Note: In answers to problems 2, 4, and 5 we will be using regression equation coefficients received by computer software. If we apply textbook formulae, the value of intercept will be a little bit different.
Find the value of R2. Interpret its meaning in this context.
To determine whether the cash bonuses paid by Johnson Financial Group are related to annual pay, data were gathered for 10 account executives who received such bonuses in 2007. The data, scatterplot and summary statistics are shown below.
Note: In answers to problems 2, 4, and 5 we will be using regression equation coefficients received by computer software. If we apply textbook formulae, the value of intercept will be a little bit different.Find the value of R2. Interpret its meaning in this context.
Question
Consider the following to answer the question(s) below:
To determine whether the cash bonuses paid by Johnson Financial Group are related to annual pay, data were gathered for 10 account executives who received such bonuses in 2007. The data, scatterplot and summary statistics are shown below.
Note: In answers to problems 2, 4, and 5 we will be using regression equation coefficients received by computer software. If we apply textbook formulae, the value of intercept will be a little bit different.
Using the regression equation,
a. Estimate the cash bonus for an executive at Johnson Financial Group earning $82,613 a year.
b. What is the residual for this estimate? What does it mean?
To determine whether the cash bonuses paid by Johnson Financial Group are related to annual pay, data were gathered for 10 account executives who received such bonuses in 2007. The data, scatterplot and summary statistics are shown below.
Note: In answers to problems 2, 4, and 5 we will be using regression equation coefficients received by computer software. If we apply textbook formulae, the value of intercept will be a little bit different.Using the regression equation,
a. Estimate the cash bonus for an executive at Johnson Financial Group earning $82,613 a year.
b. What is the residual for this estimate? What does it mean?
Question
Consider the following to answer the question(s) below:
To determine whether the cash bonuses paid by Johnson Financial Group are related to annual pay, data were gathered for 10 account executives who received such bonuses in 2007. The data, scatterplot and summary statistics are shown below.
Note: In answers to problems 2, 4, and 5 we will be using regression equation coefficients received by computer software. If we apply textbook formulae, the value of intercept will be a little bit different.
Using the regression equation,
a. Estimate the cash bonus for an executive at Johnson Financial earning $200,000 a year.
b. How confident should you be in this estimate? Explain.
To determine whether the cash bonuses paid by Johnson Financial Group are related to annual pay, data were gathered for 10 account executives who received such bonuses in 2007. The data, scatterplot and summary statistics are shown below.
Note: In answers to problems 2, 4, and 5 we will be using regression equation coefficients received by computer software. If we apply textbook formulae, the value of intercept will be a little bit different.Using the regression equation,
a. Estimate the cash bonus for an executive at Johnson Financial earning $200,000 a year.
b. How confident should you be in this estimate? Explain.
Question
Consider the following to answer the question(s) below:
To determine whether the cash bonuses paid by Johnson Financial Group are related to annual pay, data were gathered for 10 account executives who received such bonuses in 2007. The data, scatterplot and summary statistics are shown below.
The slope of the estimated regression line that relates the response variable (Cash Bonus) to the predictor variable (Annual Pay) is
A) 0.409.
B) -16,945.
C) 0.54.
D) 3.45.
E) 1.32.
Question
Consider the following to answer the question(s) below:
To determine whether the cash bonuses paid by Johnson Financial Group are related to annual pay, data were gathered for 10 account executives who received such bonuses in 2007. The data, scatterplot and summary statistics are shown below.
Note: In answers to problems 2, 4, and 5 we will be using regression equation coefficients received by computer software. If we apply textbook formulae, the value of intercept will be a little bit different.
Below is a plot showing residuals versus fitted values for the estimated regression equation relating cash bonus to annual pay for the account executives at Johnson Financial Group. Are all the conditions for linear regression met? Explain.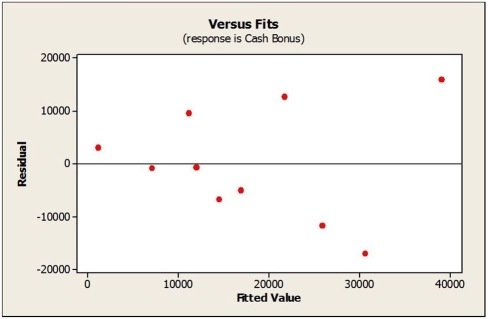
To determine whether the cash bonuses paid by Johnson Financial Group are related to annual pay, data were gathered for 10 account executives who received such bonuses in 2007. The data, scatterplot and summary statistics are shown below.
Note: In answers to problems 2, 4, and 5 we will be using regression equation coefficients received by computer software. If we apply textbook formulae, the value of intercept will be a little bit different.Below is a plot showing residuals versus fitted values for the estimated regression equation relating cash bonus to annual pay for the account executives at Johnson Financial Group. Are all the conditions for linear regression met? Explain.
Question
Consider the following to answer the question(s) below:
To determine whether the cash bonuses paid by Johnson Financial Group are related to annual pay, data were gathered for 10 account executives who received such bonuses in 2007. The data, scatterplot and summary statistics are shown below.
Based on the estimated regression equation, the cash bonus for an executive at Johnson Financial Group earning $82,613 a year would be
A) $11,863.
B) $16,844.
C) $27,682.
D) $4,958.
E) $15,819.
Question
Consider the following to answer the question(s) below:
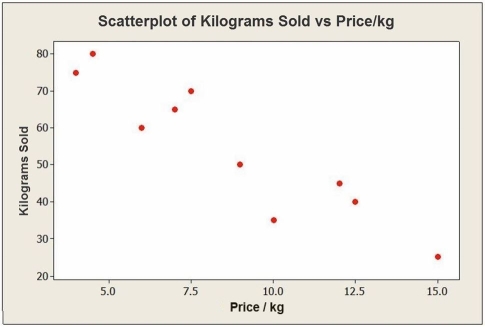
A small independent organic food store offers a variety of specialty coffees. To determine whether price has an impact on sales, the managers kept track of how many kilograms of each variety of coffee were sold last month. The data, scatterplot and summary statistics are shown below.
Which of the following statements is true?
A) The Quantitative Variables Condition is not satisfied.
B) The Linearity Condition is not satisfied.
C) There are obvious outliers.
D) The Quantitative Variables Condition is satisfied.
E) The intercept of the line of best fit is approximately zero.
Question
Consider the following to answer the question(s) below:
A small independent organic food store offers a variety of specialty coffees. To determine whether price has an impact on sales, the managers kept track of how many kilograms of each variety of coffee were sold last month. The data, scatterplot, and summary statistics are shown below.
Note: In answers to problems 2, 4, and 5 we will be using regression equation coefficients received by computer software. If we apply textbook formulae, the value of intercept will be a little bit different.
Find the value of R2. Interpret its meaning in this context.
A small independent organic food store offers a variety of specialty coffees. To determine whether price has an impact on sales, the managers kept track of how many kilograms of each variety of coffee were sold last month. The data, scatterplot, and summary statistics are shown below.
Note: In answers to problems 2, 4, and 5 we will be using regression equation coefficients received by computer software. If we apply textbook formulae, the value of intercept will be a little bit different.Find the value of R2. Interpret its meaning in this context.
Question
Consider the following to answer the question(s) below:
To determine whether the cash bonuses paid by Johnson Financial Group are related to annual pay, data were gathered for 10 account executives who received such bonuses in 2007. The data, scatterplot and summary statistics are shown below.
What percent of the variation of the cash bonus can be explained by variation of the annual pay?
A) 100%
B) 85%
C) 73%
D) 30%
E) 54%
Question
Consider the following to answer the question(s) below:
A small independent organic food store offers a variety of specialty coffees. To determine whether price has an impact on sales, the managers kept track of how many kilograms of each variety of coffee were sold last month. The data, scatterplot and summary statistics are shown below.
The slope of the estimated regression line that relates the response variable (Kilograms Sold) to the predictor variable (Price per Kilogram) is
A) 95.47
B) 0.858
C) -4.684
D) -0.858
E) -8.999
Question
Consider the following to answer the question(s) below:
A small independent organic food store offers a variety of specialty coffees. To determine whether price has an impact on sales, the managers kept track of how many kilograms of each variety of coffee were sold last month. The data, scatterplot and summary statistics are shown below.
A pair of variables, x and y, have a correlation coefficient of -0.8851. Which of the following statements is true?
A) variation of x explains about 78.34 % of the variation of y
B) variation of x explains about 88.51 % of the variation of y
C) variation of y explains about 78.34% of the variation of x
D) variation of x cannot explain about 78.34 % of the variation of y
E) variation of y explains about 88.51% of the variation of x
Question
Consider the following to answer the question(s) below:
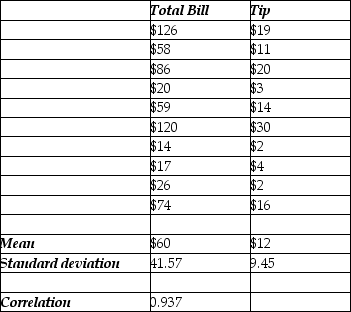
To determine whether the tip left at the end of a meal is related to the size of the total bill at their restaurant, Chez Michelle, data were gathered for 10 customers. The data and summary statistics are shown below.
The intercept of the estimated regression line that relates the response variable (Tip) to the predictor variable (Total Bill) is
A) -0.6684.
B) 0.6684.
C) 57.42.
D) -57.42.
E) 12.0.
Question
Consider the following to answer the question(s) below:
A small independent organic food store offers a variety of specialty coffees. To determine whether price has an impact on sales, the managers kept track of how many kilograms of each variety of coffee were sold last month. The data, scatterplot and summary statistics are shown below.
A regression of two variables, x and y, results in the value of R2 equal to 0.7834. Which of the following statements is true?
A) The correlation coefficient must be 0.7834.
B) The correlation coefficient must be -0.8851.
C) The correlation coefficient must be -0.7834.
D) The correlation coefficient can be either 0.8851 or -0.8851.
E) The correlation coefficient must be 0.8851.
Question
Consider the following to answer the question(s) below:
To determine whether the tip left at the end of a meal is related to the size of the total bill at their restaurant, Chez Michelle, data were gathered for 10 customers. The data and summary statistics are shown below.
The regression equation would predict what size of tip if the total bill was $120?
A) $24.89
B) $15.55
C) $26.03
D) $30.00
E) $20.62
Question
Consider the following to answer the question(s) below:
To determine whether the tip left at the end of a meal is related to the size of the total bill at their restaurant, Chez Michelle, data were gathered for 10 customers. The data and summary statistics are shown below.
The residual for the estimated tip for a total bill of $120 would be
A) $5.11
B) $19.00
C) 0
D) -$11.45
E) $9.38
Question
Consider the following to answer the question(s) below:
A small independent organic food store offers a variety of specialty coffees. To determine whether price has an impact on sales, the managers kept track of how many kilograms of each variety of coffee were sold last month. The data, scatterplot and summary statistics are shown below.
Below is a plot showing residuals versus fitted values for the estimated regression equation relating monthly sales (kilograms sold) of coffee to price per kilogram. Based on this plot we can say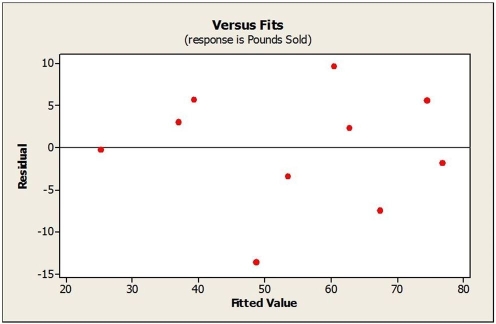
A) the Linearity Condition is not satisfied.
B) the Linearity Condition is reasonably satisfied.
C) there are several extreme outliers.
D) the correlation coefficient is close to 1.
E) the correlation coefficient is 0.
Question
Consider the following to answer the question(s) below:
To determine whether the tip left at the end of a meal is related to the size of the total bill at their restaurant, Chez Michelle, data were gathered for 10 customers. The data and summary statistics are shown below.
The slope of the estimated regression line that relates the response variable (Tip) to the predictor variable (Total Bill) is
A) 0.213.
B) -0.213.
C) 0.877.
D) 0.937.
E) -0.937.
Question
Consider the following to answer the question(s) below:
To determine whether the tip left at the end of a meal is related to the size of the total bill at their restaurant, Chez Michelle, data were gathered for 10 customers. The data and summary statistics are shown below.
Analyze the scatterplot below. What solution strategy would be most appropriate?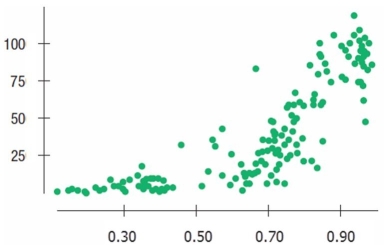
A) The relationship is perfectly linear. We should construct a linear regression model.
B) The relationship is straight enough. We should construct a linear regression model.
C) The scatterplot shows extreme outliers. We can swap the variables to transform it to linear model.
D) We should collect new data as we cannot identify the type of relationship.
E) This is an example of non-linear relationship. We can try to transform it to linear model by a function such as logarithm.
Question
Consider the following to answer the question(s) below:
A small independent organic food store offers a variety of specialty coffees. To determine whether price has an impact on sales, the managers kept track of how many kilograms of each variety of coffee were sold last month. The data, scatterplot and summary statistics are shown below.
What percent of the variation of the number of kilograms of coffee sold per month can be explained by variation of price per kilogram?
A) 93%
B) 100%
C) 86%
D) 96%
E) 14%
Question
Consider the following to answer the question(s) below:
To determine whether the tip left at the end of a meal is related to the size of the total bill at their restaurant, Chez Michelle, data were gathered for 10 customers. The data and summary statistics are shown below.
Which of the following is a correct interpretation for the regression slope coefficient b1?
A) The average change in y of a one-unit change in x will be b1 units.
B) For a one-unit change in y, we can expect the value of the independent variable to change by b1 units on average.
C) For each unit change in x, the dependent variable will change by b1 units.
D) The average change in x of a one-unit change in y will be b1 units.
E) The change in y of a one-unit change in x will always be b1 units.
Question
Consider the following to answer the question(s) below:
To determine whether the tip left at the end of a meal is related to the size of the total bill at their restaurant, Chez Michelle, data were gathered for 10 customers. The data and summary statistics are shown below.
The regression equation, = -3.61+0.106x, expresses statistical dependence of vacation expenses (y) on personal income (x) in a sample of 45 clients of a large travel agency (both numbers in $thousands). A client with $80,000 income is expected to spend
A) $12,090.
B) $8,476.
C) $8,467.
D) $4,870.
E) $1,209.
To determine whether the tip left at the end of a meal is related to the size of the total bill at their restaurant, Chez Michelle, data were gathered for 10 customers. The data and summary statistics are shown below.
The regression equation,
= -3.61+0.106x, expresses statistical dependence of vacation expenses (y) on personal income (x) in a sample of 45 clients of a large travel agency (both numbers in $thousands). A client with $80,000 income is expected to spendA) $12,090.
B) $8,476.
C) $8,467.
D) $4,870.
E) $1,209.
Question
Consider the following to answer the question(s) below:
To determine whether the tip left at the end of a meal is related to the size of the total bill at their restaurant, Chez Michelle, data were gathered for 10 customers. The data and summary statistics are shown below.
The percentage of the variation of the tip that can be explained by the variation of the total bill is
A) 87.7%.
B) 93.7%.
C) 21.3%.
D) 66.8%.
E) 96.8%.

Unlock Deck
Sign up to unlock the cards in this deck!
Unlock Deck
Unlock Deck
1/32
Play
Full screen (f)
Deck 7: Introduction to Linear Regression
1
Consider the following to answer the question(s) below:
A small independent organic food store offers a variety of specialty coffees. To determine whether price has an impact on sales, the managers kept track of how many kilograms of each variety of coffee were sold last month. The data, scatterplot, and summary statistics are shown below.
Note: In answers to problems 2, 4, and 5 we will be using regression equation coefficients received by computer software. If we apply textbook formulae, the value of intercept will be a little bit different.
Using the estimated regression equation,
a. Estimate the monthly sales (kilograms sold) for a variety of coffee that costs $12.00 per kilogram.
b. What is the residual for this estimate? What does it mean?
A small independent organic food store offers a variety of specialty coffees. To determine whether price has an impact on sales, the managers kept track of how many kilograms of each variety of coffee were sold last month. The data, scatterplot, and summary statistics are shown below.
Note: In answers to problems 2, 4, and 5 we will be using regression equation coefficients received by computer software. If we apply textbook formulae, the value of intercept will be a little bit different.Using the estimated regression equation,
a. Estimate the monthly sales (kilograms sold) for a variety of coffee that costs $12.00 per kilogram.
b. What is the residual for this estimate? What does it mean?
a. 39.26 kilograms
b. 5.74 kilograms. It tells us that the actual number of kilograms sold were 5.74 kilograms more than the model predicted.
b. 5.74 kilograms. It tells us that the actual number of kilograms sold were 5.74 kilograms more than the model predicted.
2
Consider the following to answer the question(s) below:
A small independent organic food store offers a variety of specialty coffees. To determine whether price has an impact on sales, the managers kept track of how many kilograms of each variety of coffee were sold last month. The data, scatterplot and summary statistics are shown below.
The intercept of the estimated regression line that relates the response variable (Kilograms Sold) to the predictor variable (Price per Kilogram) is
A) 95.47.
B) 0.858.
C) -4.684.
D) -0.858.
E) -8.999.
95.47.
3
Consider the following to answer the question(s) below:
A small independent organic food store offers a variety of specialty coffees. To determine whether price has an impact on sales, the managers kept track of how many kilograms of each variety of coffee were sold last month. The data, scatterplot, and summary statistics are shown below.
Note: In answers to problems 2, 4, and 5 we will be using regression equation coefficients received by computer software. If we apply textbook formulae, the value of intercept will be a little bit different.
Comment on whether each of the following conditions for correlation / linear regression is met.
a. Quantitative Variables Condition
b. Linearity Condition
c. Outlier Condition
A small independent organic food store offers a variety of specialty coffees. To determine whether price has an impact on sales, the managers kept track of how many kilograms of each variety of coffee were sold last month. The data, scatterplot, and summary statistics are shown below.
Note: In answers to problems 2, 4, and 5 we will be using regression equation coefficients received by computer software. If we apply textbook formulae, the value of intercept will be a little bit different.Comment on whether each of the following conditions for correlation / linear regression is met.
a. Quantitative Variables Condition
b. Linearity Condition
c. Outlier Condition
a. Yes, both variables are quantitative.
b. Yes, the relationship appears straight enough.
c. Yes, no obvious outliers.
b. Yes, the relationship appears straight enough.
c. Yes, no obvious outliers.
4
Consider the following to answer the question(s) below:
A small independent organic food store offers a variety of specialty coffees. To determine whether price has an impact on sales, the managers kept track of how many kilograms of each variety of coffee were sold last month. The data, scatterplot, and summary statistics are shown below.
Note: In answers to problems 2, 4, and 5 we will be using regression equation coefficients received by computer software. If we apply textbook formulae, the value of intercept will be a little bit different.
Using the estimated regression equation,
a. Estimate the monthly sales for a variety of coffee that costs $20.00 per kilogram.
b. How confident should you be in this estimate? Explain.
A small independent organic food store offers a variety of specialty coffees. To determine whether price has an impact on sales, the managers kept track of how many kilograms of each variety of coffee were sold last month. The data, scatterplot, and summary statistics are shown below.
Note: In answers to problems 2, 4, and 5 we will be using regression equation coefficients received by computer software. If we apply textbook formulae, the value of intercept will be a little bit different.Using the estimated regression equation,
a. Estimate the monthly sales for a variety of coffee that costs $20.00 per kilogram.
b. How confident should you be in this estimate? Explain.
Unlock Deck
Unlock for access to all 32 flashcards in this deck.
Unlock Deck
k this deck
5
Consider the following to answer the question(s) below:
To determine whether the cash bonuses paid by Johnson Financial Group are related to annual pay, data were gathered for 10 account executives who received such bonuses in 2007. The data, scatterplot and summary statistics are shown below.
The intercept of the estimated regression line that relates the response variable (Cash Bonus) to the predictor variable (Annual Pay) is
A) 0.409.
B) -16,945.
C) 0.54.
D) 3.45.
E) 1.32.
Unlock Deck
Unlock for access to all 32 flashcards in this deck.
Unlock Deck
k this deck
6
Consider the following to answer the question(s) below:
To determine whether the cash bonuses paid by Johnson Financial Group are related to annual pay, data were gathered for 10 account executives who received such bonuses in 2007. The data, scatterplot and summary statistics are shown below.
Based on the estimated regression equation, the residual for the estimated cash bonus of an executive at Johnson Financial Group earning $82,613 a year would be
A) $0.
B) -$4,981.
C) -$15,819.
D) -$4,958.
E) $15,819.
Unlock Deck
Unlock for access to all 32 flashcards in this deck.
Unlock Deck
k this deck
7
Consider the following to answer the question(s) below:
A small independent organic food store offers a variety of specialty coffees. To determine whether price has an impact on sales, the managers kept track of how many kilograms of each variety of coffee were sold last month. The data, scatterplot, and summary statistics are shown below.
Note: In answers to problems 2, 4, and 5 we will be using regression equation coefficients received by computer software. If we apply textbook formulae, the value of intercept will be a little bit different.
Estimate the linear regression model that relates the response variable (Kilograms Sold) to the predictor variable (Price per Kilogram).
a. Find the slope of the regression line.
b. Find the intercept of the regression line.
c. Write the equation of the linear model.
A small independent organic food store offers a variety of specialty coffees. To determine whether price has an impact on sales, the managers kept track of how many kilograms of each variety of coffee were sold last month. The data, scatterplot, and summary statistics are shown below.
Note: In answers to problems 2, 4, and 5 we will be using regression equation coefficients received by computer software. If we apply textbook formulae, the value of intercept will be a little bit different.Estimate the linear regression model that relates the response variable (Kilograms Sold) to the predictor variable (Price per Kilogram).
a. Find the slope of the regression line.
b. Find the intercept of the regression line.
c. Write the equation of the linear model.
Unlock Deck
Unlock for access to all 32 flashcards in this deck.
Unlock Deck
k this deck
8
Consider the following to answer the question(s) below:
To determine whether the cash bonuses paid by Johnson Financial Group are related to annual pay, data were gathered for 10 account executives who received such bonuses in 2007. The data, scatterplot and summary statistics are shown below.
Note: In answers to problems 2, 4, and 5 we will be using regression equation coefficients received by computer software. If we apply textbook formulae, the value of intercept will be a little bit different.
Comment on whether each of the following conditions for correlation / linear regression is met.
a. Quantitative Variables Condition
b. Linearity Condition
c. Outlier Condition
To determine whether the cash bonuses paid by Johnson Financial Group are related to annual pay, data were gathered for 10 account executives who received such bonuses in 2007. The data, scatterplot and summary statistics are shown below.
Note: In answers to problems 2, 4, and 5 we will be using regression equation coefficients received by computer software. If we apply textbook formulae, the value of intercept will be a little bit different.Comment on whether each of the following conditions for correlation / linear regression is met.
a. Quantitative Variables Condition
b. Linearity Condition
c. Outlier Condition
Unlock Deck
Unlock for access to all 32 flashcards in this deck.
Unlock Deck
k this deck
9
Consider the following to answer the question(s) below:
A small independent organic food store offers a variety of specialty coffees. To determine whether price has an impact on sales, the managers kept track of how many kilograms of each variety of coffee were sold last month. The data, scatterplot, and summary statistics are shown below.
Note: In answers to problems 2, 4, and 5 we will be using regression equation coefficients received by computer software. If we apply textbook formulae, the value of intercept will be a little bit different.
Below is a plot showing residuals versus fitted values for the estimated regression equation relating monthly sales of coffee to price per kilogram. Are all the conditions for linear regression met? Explain.
A small independent organic food store offers a variety of specialty coffees. To determine whether price has an impact on sales, the managers kept track of how many kilograms of each variety of coffee were sold last month. The data, scatterplot, and summary statistics are shown below.
Note: In answers to problems 2, 4, and 5 we will be using regression equation coefficients received by computer software. If we apply textbook formulae, the value of intercept will be a little bit different.Below is a plot showing residuals versus fitted values for the estimated regression equation relating monthly sales of coffee to price per kilogram. Are all the conditions for linear regression met? Explain.
Unlock Deck
Unlock for access to all 32 flashcards in this deck.
Unlock Deck
k this deck
10
Consider the following to answer the question(s) below:
To determine whether the cash bonuses paid by Johnson Financial Group are related to annual pay, data were gathered for 10 account executives who received such bonuses in 2007. The data, scatterplot and summary statistics are shown below.
Note: In answers to problems 2, 4, and 5 we will be using regression equation coefficients received by computer software. If we apply textbook formulae, the value of intercept will be a little bit different.
Estimate the linear regression model that relates the response variable (Cash Bonus) to the predictor variable (Annual Pay).
a. Find the slope of the regression line.
b. Find the intercept of the regression line.
c. Write the equation of the linear model.
To determine whether the cash bonuses paid by Johnson Financial Group are related to annual pay, data were gathered for 10 account executives who received such bonuses in 2007. The data, scatterplot and summary statistics are shown below.
Note: In answers to problems 2, 4, and 5 we will be using regression equation coefficients received by computer software. If we apply textbook formulae, the value of intercept will be a little bit different.Estimate the linear regression model that relates the response variable (Cash Bonus) to the predictor variable (Annual Pay).
a. Find the slope of the regression line.
b. Find the intercept of the regression line.
c. Write the equation of the linear model.
Unlock Deck
Unlock for access to all 32 flashcards in this deck.
Unlock Deck
k this deck
11
Consider the following to answer the question(s) below:
To determine whether the cash bonuses paid by Johnson Financial Group are related to annual pay, data were gathered for 10 account executives who received such bonuses in 2007. The data, scatterplot and summary statistics are shown below.
Note: In answers to problems 2, 4, and 5 we will be using regression equation coefficients received by computer software. If we apply textbook formulae, the value of intercept will be a little bit different.
Find the value of R2. Interpret its meaning in this context.
To determine whether the cash bonuses paid by Johnson Financial Group are related to annual pay, data were gathered for 10 account executives who received such bonuses in 2007. The data, scatterplot and summary statistics are shown below.
Note: In answers to problems 2, 4, and 5 we will be using regression equation coefficients received by computer software. If we apply textbook formulae, the value of intercept will be a little bit different.Find the value of R2. Interpret its meaning in this context.
Unlock Deck
Unlock for access to all 32 flashcards in this deck.
Unlock Deck
k this deck
12
Consider the following to answer the question(s) below:
To determine whether the cash bonuses paid by Johnson Financial Group are related to annual pay, data were gathered for 10 account executives who received such bonuses in 2007. The data, scatterplot and summary statistics are shown below.
Note: In answers to problems 2, 4, and 5 we will be using regression equation coefficients received by computer software. If we apply textbook formulae, the value of intercept will be a little bit different.
Using the regression equation,
a. Estimate the cash bonus for an executive at Johnson Financial Group earning $82,613 a year.
b. What is the residual for this estimate? What does it mean?
To determine whether the cash bonuses paid by Johnson Financial Group are related to annual pay, data were gathered for 10 account executives who received such bonuses in 2007. The data, scatterplot and summary statistics are shown below.
Note: In answers to problems 2, 4, and 5 we will be using regression equation coefficients received by computer software. If we apply textbook formulae, the value of intercept will be a little bit different.Using the regression equation,
a. Estimate the cash bonus for an executive at Johnson Financial Group earning $82,613 a year.
b. What is the residual for this estimate? What does it mean?
Unlock Deck
Unlock for access to all 32 flashcards in this deck.
Unlock Deck
k this deck
13
Consider the following to answer the question(s) below:
To determine whether the cash bonuses paid by Johnson Financial Group are related to annual pay, data were gathered for 10 account executives who received such bonuses in 2007. The data, scatterplot and summary statistics are shown below.
Note: In answers to problems 2, 4, and 5 we will be using regression equation coefficients received by computer software. If we apply textbook formulae, the value of intercept will be a little bit different.
Using the regression equation,
a. Estimate the cash bonus for an executive at Johnson Financial earning $200,000 a year.
b. How confident should you be in this estimate? Explain.
To determine whether the cash bonuses paid by Johnson Financial Group are related to annual pay, data were gathered for 10 account executives who received such bonuses in 2007. The data, scatterplot and summary statistics are shown below.
Note: In answers to problems 2, 4, and 5 we will be using regression equation coefficients received by computer software. If we apply textbook formulae, the value of intercept will be a little bit different.Using the regression equation,
a. Estimate the cash bonus for an executive at Johnson Financial earning $200,000 a year.
b. How confident should you be in this estimate? Explain.
Unlock Deck
Unlock for access to all 32 flashcards in this deck.
Unlock Deck
k this deck
14
Consider the following to answer the question(s) below:
To determine whether the cash bonuses paid by Johnson Financial Group are related to annual pay, data were gathered for 10 account executives who received such bonuses in 2007. The data, scatterplot and summary statistics are shown below.
The slope of the estimated regression line that relates the response variable (Cash Bonus) to the predictor variable (Annual Pay) is
A) 0.409.
B) -16,945.
C) 0.54.
D) 3.45.
E) 1.32.
Unlock Deck
Unlock for access to all 32 flashcards in this deck.
Unlock Deck
k this deck
15
Consider the following to answer the question(s) below:
To determine whether the cash bonuses paid by Johnson Financial Group are related to annual pay, data were gathered for 10 account executives who received such bonuses in 2007. The data, scatterplot and summary statistics are shown below.
Note: In answers to problems 2, 4, and 5 we will be using regression equation coefficients received by computer software. If we apply textbook formulae, the value of intercept will be a little bit different.
Below is a plot showing residuals versus fitted values for the estimated regression equation relating cash bonus to annual pay for the account executives at Johnson Financial Group. Are all the conditions for linear regression met? Explain.
To determine whether the cash bonuses paid by Johnson Financial Group are related to annual pay, data were gathered for 10 account executives who received such bonuses in 2007. The data, scatterplot and summary statistics are shown below.
Note: In answers to problems 2, 4, and 5 we will be using regression equation coefficients received by computer software. If we apply textbook formulae, the value of intercept will be a little bit different.Below is a plot showing residuals versus fitted values for the estimated regression equation relating cash bonus to annual pay for the account executives at Johnson Financial Group. Are all the conditions for linear regression met? Explain.
Unlock Deck
Unlock for access to all 32 flashcards in this deck.
Unlock Deck
k this deck
16
Consider the following to answer the question(s) below:
To determine whether the cash bonuses paid by Johnson Financial Group are related to annual pay, data were gathered for 10 account executives who received such bonuses in 2007. The data, scatterplot and summary statistics are shown below.
Based on the estimated regression equation, the cash bonus for an executive at Johnson Financial Group earning $82,613 a year would be
A) $11,863.
B) $16,844.
C) $27,682.
D) $4,958.
E) $15,819.
Unlock Deck
Unlock for access to all 32 flashcards in this deck.
Unlock Deck
k this deck
17
Consider the following to answer the question(s) below:
A small independent organic food store offers a variety of specialty coffees. To determine whether price has an impact on sales, the managers kept track of how many kilograms of each variety of coffee were sold last month. The data, scatterplot and summary statistics are shown below.
Which of the following statements is true?
A) The Quantitative Variables Condition is not satisfied.
B) The Linearity Condition is not satisfied.
C) There are obvious outliers.
D) The Quantitative Variables Condition is satisfied.
E) The intercept of the line of best fit is approximately zero.
Unlock Deck
Unlock for access to all 32 flashcards in this deck.
Unlock Deck
k this deck
18
Consider the following to answer the question(s) below:
A small independent organic food store offers a variety of specialty coffees. To determine whether price has an impact on sales, the managers kept track of how many kilograms of each variety of coffee were sold last month. The data, scatterplot, and summary statistics are shown below.
Note: In answers to problems 2, 4, and 5 we will be using regression equation coefficients received by computer software. If we apply textbook formulae, the value of intercept will be a little bit different.
Find the value of R2. Interpret its meaning in this context.
A small independent organic food store offers a variety of specialty coffees. To determine whether price has an impact on sales, the managers kept track of how many kilograms of each variety of coffee were sold last month. The data, scatterplot, and summary statistics are shown below.
Note: In answers to problems 2, 4, and 5 we will be using regression equation coefficients received by computer software. If we apply textbook formulae, the value of intercept will be a little bit different.Find the value of R2. Interpret its meaning in this context.
Unlock Deck
Unlock for access to all 32 flashcards in this deck.
Unlock Deck
k this deck
19
Consider the following to answer the question(s) below:
To determine whether the cash bonuses paid by Johnson Financial Group are related to annual pay, data were gathered for 10 account executives who received such bonuses in 2007. The data, scatterplot and summary statistics are shown below.
What percent of the variation of the cash bonus can be explained by variation of the annual pay?
A) 100%
B) 85%
C) 73%
D) 30%
E) 54%
Unlock Deck
Unlock for access to all 32 flashcards in this deck.
Unlock Deck
k this deck
20
Consider the following to answer the question(s) below:
A small independent organic food store offers a variety of specialty coffees. To determine whether price has an impact on sales, the managers kept track of how many kilograms of each variety of coffee were sold last month. The data, scatterplot and summary statistics are shown below.
The slope of the estimated regression line that relates the response variable (Kilograms Sold) to the predictor variable (Price per Kilogram) is
A) 95.47
B) 0.858
C) -4.684
D) -0.858
E) -8.999
Unlock Deck
Unlock for access to all 32 flashcards in this deck.
Unlock Deck
k this deck
21
Consider the following to answer the question(s) below:
A small independent organic food store offers a variety of specialty coffees. To determine whether price has an impact on sales, the managers kept track of how many kilograms of each variety of coffee were sold last month. The data, scatterplot and summary statistics are shown below.
A pair of variables, x and y, have a correlation coefficient of -0.8851. Which of the following statements is true?
A) variation of x explains about 78.34 % of the variation of y
B) variation of x explains about 88.51 % of the variation of y
C) variation of y explains about 78.34% of the variation of x
D) variation of x cannot explain about 78.34 % of the variation of y
E) variation of y explains about 88.51% of the variation of x
Unlock Deck
Unlock for access to all 32 flashcards in this deck.
Unlock Deck
k this deck
22
Consider the following to answer the question(s) below:
To determine whether the tip left at the end of a meal is related to the size of the total bill at their restaurant, Chez Michelle, data were gathered for 10 customers. The data and summary statistics are shown below.
The intercept of the estimated regression line that relates the response variable (Tip) to the predictor variable (Total Bill) is
A) -0.6684.
B) 0.6684.
C) 57.42.
D) -57.42.
E) 12.0.
Unlock Deck
Unlock for access to all 32 flashcards in this deck.
Unlock Deck
k this deck
23
Consider the following to answer the question(s) below:
A small independent organic food store offers a variety of specialty coffees. To determine whether price has an impact on sales, the managers kept track of how many kilograms of each variety of coffee were sold last month. The data, scatterplot and summary statistics are shown below.
A regression of two variables, x and y, results in the value of R2 equal to 0.7834. Which of the following statements is true?
A) The correlation coefficient must be 0.7834.
B) The correlation coefficient must be -0.8851.
C) The correlation coefficient must be -0.7834.
D) The correlation coefficient can be either 0.8851 or -0.8851.
E) The correlation coefficient must be 0.8851.
Unlock Deck
Unlock for access to all 32 flashcards in this deck.
Unlock Deck
k this deck
24
Consider the following to answer the question(s) below:
To determine whether the tip left at the end of a meal is related to the size of the total bill at their restaurant, Chez Michelle, data were gathered for 10 customers. The data and summary statistics are shown below.
The regression equation would predict what size of tip if the total bill was $120?
A) $24.89
B) $15.55
C) $26.03
D) $30.00
E) $20.62
Unlock Deck
Unlock for access to all 32 flashcards in this deck.
Unlock Deck
k this deck
25
Consider the following to answer the question(s) below:
To determine whether the tip left at the end of a meal is related to the size of the total bill at their restaurant, Chez Michelle, data were gathered for 10 customers. The data and summary statistics are shown below.
The residual for the estimated tip for a total bill of $120 would be
A) $5.11
B) $19.00
C) 0
D) -$11.45
E) $9.38
Unlock Deck
Unlock for access to all 32 flashcards in this deck.
Unlock Deck
k this deck
26
Consider the following to answer the question(s) below:
A small independent organic food store offers a variety of specialty coffees. To determine whether price has an impact on sales, the managers kept track of how many kilograms of each variety of coffee were sold last month. The data, scatterplot and summary statistics are shown below.
Below is a plot showing residuals versus fitted values for the estimated regression equation relating monthly sales (kilograms sold) of coffee to price per kilogram. Based on this plot we can say
A) the Linearity Condition is not satisfied.
B) the Linearity Condition is reasonably satisfied.
C) there are several extreme outliers.
D) the correlation coefficient is close to 1.
E) the correlation coefficient is 0.
Unlock Deck
Unlock for access to all 32 flashcards in this deck.
Unlock Deck
k this deck
27
Consider the following to answer the question(s) below:
To determine whether the tip left at the end of a meal is related to the size of the total bill at their restaurant, Chez Michelle, data were gathered for 10 customers. The data and summary statistics are shown below.
The slope of the estimated regression line that relates the response variable (Tip) to the predictor variable (Total Bill) is
A) 0.213.
B) -0.213.
C) 0.877.
D) 0.937.
E) -0.937.
Unlock Deck
Unlock for access to all 32 flashcards in this deck.
Unlock Deck
k this deck
28
Consider the following to answer the question(s) below:
To determine whether the tip left at the end of a meal is related to the size of the total bill at their restaurant, Chez Michelle, data were gathered for 10 customers. The data and summary statistics are shown below.
Analyze the scatterplot below. What solution strategy would be most appropriate?
A) The relationship is perfectly linear. We should construct a linear regression model.
B) The relationship is straight enough. We should construct a linear regression model.
C) The scatterplot shows extreme outliers. We can swap the variables to transform it to linear model.
D) We should collect new data as we cannot identify the type of relationship.
E) This is an example of non-linear relationship. We can try to transform it to linear model by a function such as logarithm.
Unlock Deck
Unlock for access to all 32 flashcards in this deck.
Unlock Deck
k this deck
29
Consider the following to answer the question(s) below:
A small independent organic food store offers a variety of specialty coffees. To determine whether price has an impact on sales, the managers kept track of how many kilograms of each variety of coffee were sold last month. The data, scatterplot and summary statistics are shown below.
What percent of the variation of the number of kilograms of coffee sold per month can be explained by variation of price per kilogram?
A) 93%
B) 100%
C) 86%
D) 96%
E) 14%
Unlock Deck
Unlock for access to all 32 flashcards in this deck.
Unlock Deck
k this deck
30
Consider the following to answer the question(s) below:
To determine whether the tip left at the end of a meal is related to the size of the total bill at their restaurant, Chez Michelle, data were gathered for 10 customers. The data and summary statistics are shown below.
Which of the following is a correct interpretation for the regression slope coefficient b1?
A) The average change in y of a one-unit change in x will be b1 units.
B) For a one-unit change in y, we can expect the value of the independent variable to change by b1 units on average.
C) For each unit change in x, the dependent variable will change by b1 units.
D) The average change in x of a one-unit change in y will be b1 units.
E) The change in y of a one-unit change in x will always be b1 units.
Unlock Deck
Unlock for access to all 32 flashcards in this deck.
Unlock Deck
k this deck
31
Consider the following to answer the question(s) below:
To determine whether the tip left at the end of a meal is related to the size of the total bill at their restaurant, Chez Michelle, data were gathered for 10 customers. The data and summary statistics are shown below.
The regression equation, = -3.61+0.106x, expresses statistical dependence of vacation expenses (y) on personal income (x) in a sample of 45 clients of a large travel agency (both numbers in $thousands). A client with $80,000 income is expected to spend
A) $12,090.
B) $8,476.
C) $8,467.
D) $4,870.
E) $1,209.
To determine whether the tip left at the end of a meal is related to the size of the total bill at their restaurant, Chez Michelle, data were gathered for 10 customers. The data and summary statistics are shown below.
The regression equation,
= -3.61+0.106x, expresses statistical dependence of vacation expenses (y) on personal income (x) in a sample of 45 clients of a large travel agency (both numbers in $thousands). A client with $80,000 income is expected to spendA) $12,090.
B) $8,476.
C) $8,467.
D) $4,870.
E) $1,209.
Unlock Deck
Unlock for access to all 32 flashcards in this deck.
Unlock Deck
k this deck
32
Consider the following to answer the question(s) below:
To determine whether the tip left at the end of a meal is related to the size of the total bill at their restaurant, Chez Michelle, data were gathered for 10 customers. The data and summary statistics are shown below.
The percentage of the variation of the tip that can be explained by the variation of the total bill is
A) 87.7%.
B) 93.7%.
C) 21.3%.
D) 66.8%.
E) 96.8%.
Unlock Deck
Unlock for access to all 32 flashcards in this deck.
Unlock Deck
k this deck
Unlock Deck
Unlock for access to all 32 flashcards in this deck.


