Deck 20: Magnetic Resonance Imaging Patterns
Full screen (f)
Question
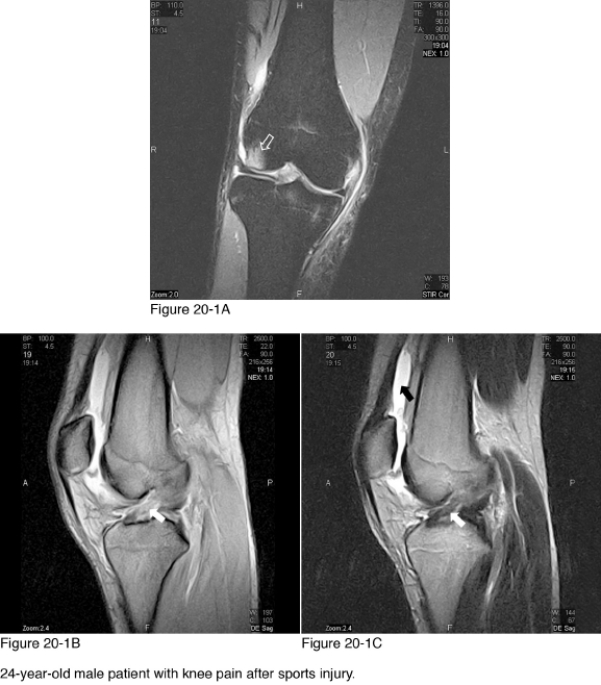
What spine region is imaged in Figure 20-2A through Figure 20-2D?
A) Cervical
B) Thoracic
C) Lumbar
D) Sacrum/coccyx
Question
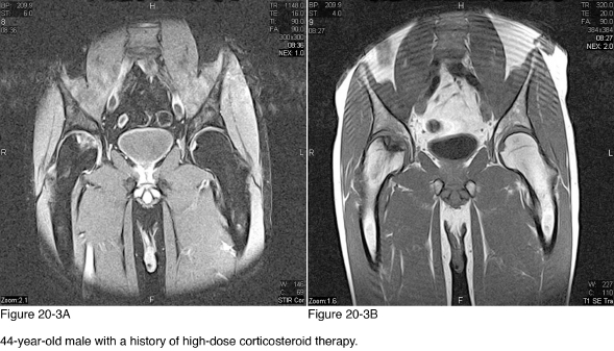
What body region is imaged in Figure 20-3A and Figure 20-3B?
A) Shoulders
B) Hips
C) Abdomen
D) Uterus
Question
Which of the following best explains the abnormality indicated by the white arrows in Figure 20-2C and Figure 20-2D?
A) Abscess
B) Paraspinal soft tissue mass
C) Paraspinal musculature
D) Hemorrhage
Question
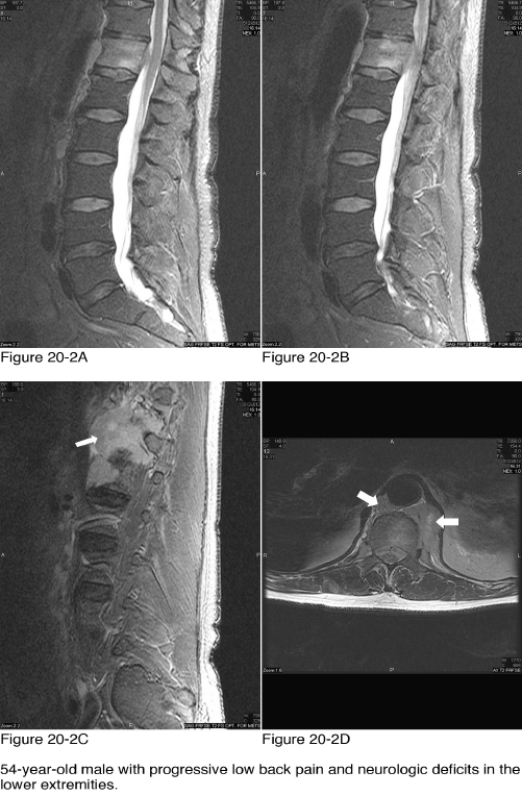
In Figure 20-1C the area of increased signal intensity marked by the black arrow is a(an) __________.
A) Intra-articular effusion
B) Synovitis
C) Baker cyst
D) Arterial aneurysm
Question
What body region is imaged in Figure 20-1A to Figure 20-1C?
A) Ankle
B) Knee
C) Wrist
D) Elbow
Question
Which of the following diagnoses best accounts for the abnormalities observed in Figure 20-2?
A) Infectious spondylodiscitis
B) Osteoporotic compression fracture
C) Hemangioma
D) Lymphoma
Question
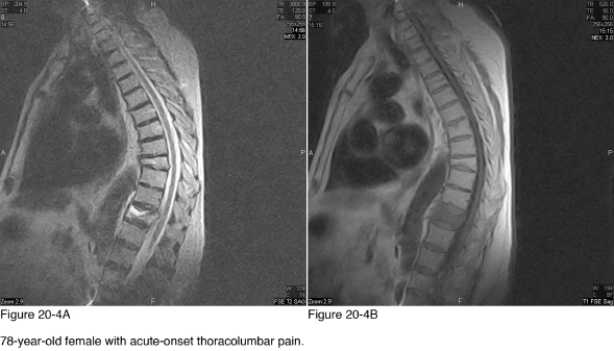
What can be inferred from comparing the signal intensity of the T8 and T11 vertebral bodies?
A) The T8 lesion is acute
B) The T11 lesion is acute
C) Both lesions are acute
D) Both lesions are chronic
Question
The abnormalities observed in Figure 20-3 are diagnostic for __________.
A) Septic arthritis
B) Transient osteoporosis
C) Osteoarthritis
D) Avascular necrosis
Question
In what imaging plane are Figure 20-4A and Figure 20-4B?
A) Coronal
B) Sagittal
C) Axial
D) Oblique
Question
What is the composition of the areas in Figure 20-2A and Figure 20-2B that are white/high-signal intensity?
A) Fat
B) Water
C) Protein
D) Iodine contrast
Question
Figure 20-3A and Figure 20-3B are in the __________ plane.
A) Coronal
B) Axial
C) Sagittal
D) Oblique
Question
Which of the following is the underlying cause of the abnormalities present in Figure 20-4A and Figure 20-4B?
A) Osteoporosis
B) Metastasis
C) Infection
D) Chronic renal disease
Question
Signal abnormality identified by the white open arrow in Figure 20-1A is significant for__________.
A) Ligament tear
B) Osteochondritis dissecans
C) Hemarthrosis
D) Bone contusion
Question
What pulse sequence was used to accomplish Figure 20-3B?
A) T1
B) T2
C) Proton density
D) Gradient E
Question
Which of the following diagnoses best accounts for the abnormality indicated by the white arrow in Figure 20-1B and Figure 20-1C?
A) ACL tear
B) Ulnar collateral ligament tear
C) PCL tear
D) Osteochondral lesion
Question
What pulse sequence was used to acquire Figure 20-1A?
A) T1
B) T2
C) Proton density
D) STIR
Question
Which of the following best characterizes the signal characteristics of the area of abnormality?
A) Low T1, low STIR (fluid sensitive)
B) Low T1, high STIR (fluid sensitive)
C) High T1, low STIR (fluid sensitive)
D) High T1, high STIR (fluid sensitive)
Question
Which of the following best explains the abnormal signal intensity at T11?
A) Intraosseous hemorrhage
B) Infection
C) Marrow replacement
D) Amyloid deposition
Question
Which of the following best describes the shape of the T11 vertebra?
A) Pancake
B) Biconcave
C) Step-off
D) Bullet
Question
Which vertebral level shows abnormal signal intensity?
A) T12
B) L3
C) L5
D) Sacrum

Unlock Deck
Sign up to unlock the cards in this deck!
Unlock Deck
Unlock Deck
1/20
Play
Full screen (f)
Deck 20: Magnetic Resonance Imaging Patterns
1
What spine region is imaged in Figure 20-2A through Figure 20-2D?
A) Cervical
B) Thoracic
C) Lumbar
D) Sacrum/coccyx
Lumbar
2
What body region is imaged in Figure 20-3A and Figure 20-3B?
A) Shoulders
B) Hips
C) Abdomen
D) Uterus
Hips
3
Which of the following best explains the abnormality indicated by the white arrows in Figure 20-2C and Figure 20-2D?
A) Abscess
B) Paraspinal soft tissue mass
C) Paraspinal musculature
D) Hemorrhage
Paraspinal soft tissue mass
4
In Figure 20-1C the area of increased signal intensity marked by the black arrow is a(an) __________.
A) Intra-articular effusion
B) Synovitis
C) Baker cyst
D) Arterial aneurysm
Unlock Deck
Unlock for access to all 20 flashcards in this deck.
Unlock Deck
k this deck
5
What body region is imaged in Figure 20-1A to Figure 20-1C?
A) Ankle
B) Knee
C) Wrist
D) Elbow
Unlock Deck
Unlock for access to all 20 flashcards in this deck.
Unlock Deck
k this deck
6
Which of the following diagnoses best accounts for the abnormalities observed in Figure 20-2?
A) Infectious spondylodiscitis
B) Osteoporotic compression fracture
C) Hemangioma
D) Lymphoma
Unlock Deck
Unlock for access to all 20 flashcards in this deck.
Unlock Deck
k this deck
7
What can be inferred from comparing the signal intensity of the T8 and T11 vertebral bodies?
A) The T8 lesion is acute
B) The T11 lesion is acute
C) Both lesions are acute
D) Both lesions are chronic
Unlock Deck
Unlock for access to all 20 flashcards in this deck.
Unlock Deck
k this deck
8
The abnormalities observed in Figure 20-3 are diagnostic for __________.
A) Septic arthritis
B) Transient osteoporosis
C) Osteoarthritis
D) Avascular necrosis
Unlock Deck
Unlock for access to all 20 flashcards in this deck.
Unlock Deck
k this deck
9
In what imaging plane are Figure 20-4A and Figure 20-4B?
A) Coronal
B) Sagittal
C) Axial
D) Oblique
Unlock Deck
Unlock for access to all 20 flashcards in this deck.
Unlock Deck
k this deck
10
What is the composition of the areas in Figure 20-2A and Figure 20-2B that are white/high-signal intensity?
A) Fat
B) Water
C) Protein
D) Iodine contrast
Unlock Deck
Unlock for access to all 20 flashcards in this deck.
Unlock Deck
k this deck
11
Figure 20-3A and Figure 20-3B are in the __________ plane.
A) Coronal
B) Axial
C) Sagittal
D) Oblique
Unlock Deck
Unlock for access to all 20 flashcards in this deck.
Unlock Deck
k this deck
12
Which of the following is the underlying cause of the abnormalities present in Figure 20-4A and Figure 20-4B?
A) Osteoporosis
B) Metastasis
C) Infection
D) Chronic renal disease
Unlock Deck
Unlock for access to all 20 flashcards in this deck.
Unlock Deck
k this deck
13
Signal abnormality identified by the white open arrow in Figure 20-1A is significant for__________.
A) Ligament tear
B) Osteochondritis dissecans
C) Hemarthrosis
D) Bone contusion
Unlock Deck
Unlock for access to all 20 flashcards in this deck.
Unlock Deck
k this deck
14
What pulse sequence was used to accomplish Figure 20-3B?
A) T1
B) T2
C) Proton density
D) Gradient E
Unlock Deck
Unlock for access to all 20 flashcards in this deck.
Unlock Deck
k this deck
15
Which of the following diagnoses best accounts for the abnormality indicated by the white arrow in Figure 20-1B and Figure 20-1C?
A) ACL tear
B) Ulnar collateral ligament tear
C) PCL tear
D) Osteochondral lesion
Unlock Deck
Unlock for access to all 20 flashcards in this deck.
Unlock Deck
k this deck
16
What pulse sequence was used to acquire Figure 20-1A?
A) T1
B) T2
C) Proton density
D) STIR
Unlock Deck
Unlock for access to all 20 flashcards in this deck.
Unlock Deck
k this deck
17
Which of the following best characterizes the signal characteristics of the area of abnormality?
A) Low T1, low STIR (fluid sensitive)
B) Low T1, high STIR (fluid sensitive)
C) High T1, low STIR (fluid sensitive)
D) High T1, high STIR (fluid sensitive)
Unlock Deck
Unlock for access to all 20 flashcards in this deck.
Unlock Deck
k this deck
18
Which of the following best explains the abnormal signal intensity at T11?
A) Intraosseous hemorrhage
B) Infection
C) Marrow replacement
D) Amyloid deposition
Unlock Deck
Unlock for access to all 20 flashcards in this deck.
Unlock Deck
k this deck
19
Which of the following best describes the shape of the T11 vertebra?
A) Pancake
B) Biconcave
C) Step-off
D) Bullet
Unlock Deck
Unlock for access to all 20 flashcards in this deck.
Unlock Deck
k this deck
20
Which vertebral level shows abnormal signal intensity?
A) T12
B) L3
C) L5
D) Sacrum
Unlock Deck
Unlock for access to all 20 flashcards in this deck.
Unlock Deck
k this deck
Unlock Deck
Unlock for access to all 20 flashcards in this deck.


