Deck 11: Factorial Design: I Lost My Phone Number, Can I Borrow Yours Do Pickup Lines Really Work
Full screen (f)
Question
Question
Question
Question
Question
Question
Question
Question
Question
Question
Question
Question
Question
Question
Question
Question
Question
Question
Question
Question
Question
Question
Question
Question
Question
Question
Question
Question
Question
Question
Question
Question
Question
Question
Question
Question
Question
Question
Question
Question
Question
Question
Question
Question
Question
Question
Use the following to answer questions
Scenario I
Scenario I is based on fabricated data inspired by the following study:
Hennig-Thurau, T., Groth, M., Paul, M. & Gremler, D. D. (2006). Are all smiles created equal? How emotional contagion and emotional labor affect service relationships. Journal of Marketing, 70, 58-73.
Do Smiling Employees Improve Customer Satisfaction?
In this 2 × 2 between-subjects design, Hennig-Thurau and colleagues examined the effect of employee emotions and authenticity of the emotion on customer relations. A total of 223 undergraduate volunteers participated in this study. The participants were told they would be testing a new movie consulting service. The movie consulting service was created by the experimenters, and actors were hired to act as customer service representatives. Each participant approached the service desk where the actor asked them a number of questions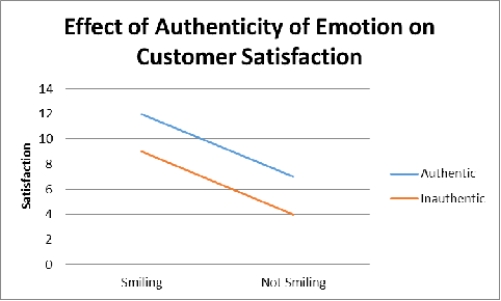 Figure 1. Customers rate their experience more favorably when employees are smiling.
(Scenario I)How many hypotheses were tested in the study described in Scenario I?
A) one
B) two
C) three
D) four
Scenario I
Scenario I is based on fabricated data inspired by the following study:
Hennig-Thurau, T., Groth, M., Paul, M. & Gremler, D. D. (2006). Are all smiles created equal? How emotional contagion and emotional labor affect service relationships. Journal of Marketing, 70, 58-73.
Do Smiling Employees Improve Customer Satisfaction?
In this 2 × 2 between-subjects design, Hennig-Thurau and colleagues examined the effect of employee emotions and authenticity of the emotion on customer relations. A total of 223 undergraduate volunteers participated in this study. The participants were told they would be testing a new movie consulting service. The movie consulting service was created by the experimenters, and actors were hired to act as customer service representatives. Each participant approached the service desk where the actor asked them a number of questions
Figure 1. Customers rate their experience more favorably when employees are smiling.(Scenario I)How many hypotheses were tested in the study described in Scenario I?
A) one
B) two
C) three
D) four
Question
Question
Question
Question
Question
Question
Question
Use the following to answer questions
Scenario I
Scenario I is based on fabricated data inspired by the following study:
Hennig-Thurau, T., Groth, M., Paul, M. & Gremler, D. D. (2006). Are all smiles created equal? How emotional contagion and emotional labor affect service relationships. Journal of Marketing, 70, 58-73.
Do Smiling Employees Improve Customer Satisfaction?
In this 2 × 2 between-subjects design, Hennig-Thurau and colleagues examined the effect of employee emotions and authenticity of the emotion on customer relations. A total of 223 undergraduate volunteers participated in this study. The participants were told they would be testing a new movie consulting service. The movie consulting service was created by the experimenters, and actors were hired to act as customer service representatives. Each participant approached the service desk where the actor asked them a number of questions Figure 1. Customers rate their experience more favorably when employees are smiling.
(Scenario I) Which of the following hypothesis did the results of the study described in Scenario I support?
A) There is a main effect for emotion, but no main effect for authenticity or interaction between emotion and authenticity on customer satisfaction.
B) There is a main effect for emotion and a main effect for authenticity, but not an interaction between emotion and authenticity on customer satisfaction.
C) There is a main effect for emotion, a main effect for interaction and an interaction between emotion and authenticity on customer satisfaction.
D) There is no effect for emotion, authenticity, or emotion × authenticity interaction on customer satisfaction.
Scenario I
Scenario I is based on fabricated data inspired by the following study:
Hennig-Thurau, T., Groth, M., Paul, M. & Gremler, D. D. (2006). Are all smiles created equal? How emotional contagion and emotional labor affect service relationships. Journal of Marketing, 70, 58-73.
Do Smiling Employees Improve Customer Satisfaction?
In this 2 × 2 between-subjects design, Hennig-Thurau and colleagues examined the effect of employee emotions and authenticity of the emotion on customer relations. A total of 223 undergraduate volunteers participated in this study. The participants were told they would be testing a new movie consulting service. The movie consulting service was created by the experimenters, and actors were hired to act as customer service representatives. Each participant approached the service desk where the actor asked them a number of questions
Figure 1. Customers rate their experience more favorably when employees are smiling.(Scenario I) Which of the following hypothesis did the results of the study described in Scenario I support?
A) There is a main effect for emotion, but no main effect for authenticity or interaction between emotion and authenticity on customer satisfaction.
B) There is a main effect for emotion and a main effect for authenticity, but not an interaction between emotion and authenticity on customer satisfaction.
C) There is a main effect for emotion, a main effect for interaction and an interaction between emotion and authenticity on customer satisfaction.
D) There is no effect for emotion, authenticity, or emotion × authenticity interaction on customer satisfaction.
Question
Use the following to answer questions
Scenario I
Scenario I is based on fabricated data inspired by the following study:
Hennig-Thurau, T., Groth, M., Paul, M. & Gremler, D. D. (2006). Are all smiles created equal? How emotional contagion and emotional labor affect service relationships. Journal of Marketing, 70, 58-73.
Do Smiling Employees Improve Customer Satisfaction?
In this 2 × 2 between-subjects design, Hennig-Thurau and colleagues examined the effect of employee emotions and authenticity of the emotion on customer relations. A total of 223 undergraduate volunteers participated in this study. The participants were told they would be testing a new movie consulting service. The movie consulting service was created by the experimenters, and actors were hired to act as customer service representatives. Each participant approached the service desk where the actor asked them a number of questions Figure 1. Customers rate their experience more favorably when employees are smiling.
(Scenario I) Figure 1 supports which of the following hypotheses?
A) main effect for smiling
B) main effect for authenticity
C) interaction between smiling and authenticity
D) all of the above hypotheses are supported
Scenario I
Scenario I is based on fabricated data inspired by the following study:
Hennig-Thurau, T., Groth, M., Paul, M. & Gremler, D. D. (2006). Are all smiles created equal? How emotional contagion and emotional labor affect service relationships. Journal of Marketing, 70, 58-73.
Do Smiling Employees Improve Customer Satisfaction?
In this 2 × 2 between-subjects design, Hennig-Thurau and colleagues examined the effect of employee emotions and authenticity of the emotion on customer relations. A total of 223 undergraduate volunteers participated in this study. The participants were told they would be testing a new movie consulting service. The movie consulting service was created by the experimenters, and actors were hired to act as customer service representatives. Each participant approached the service desk where the actor asked them a number of questions
Figure 1. Customers rate their experience more favorably when employees are smiling.(Scenario I) Figure 1 supports which of the following hypotheses?
A) main effect for smiling
B) main effect for authenticity
C) interaction between smiling and authenticity
D) all of the above hypotheses are supported
Question
Question
Question
Use the following to answer questions
Scenario I
Scenario I is based on fabricated data inspired by the following study:
Hennig-Thurau, T., Groth, M., Paul, M. & Gremler, D. D. (2006). Are all smiles created equal? How emotional contagion and emotional labor affect service relationships. Journal of Marketing, 70, 58-73.
Do Smiling Employees Improve Customer Satisfaction?
In this 2 × 2 between-subjects design, Hennig-Thurau and colleagues examined the effect of employee emotions and authenticity of the emotion on customer relations. A total of 223 undergraduate volunteers participated in this study. The participants were told they would be testing a new movie consulting service. The movie consulting service was created by the experimenters, and actors were hired to act as customer service representatives. Each participant approached the service desk where the actor asked them a number of questions Figure 1. Customers rate their experience more favorably when employees are smiling.
(Scenario I) Suppose each treatment condition described in Scenario I was conducted sequentially with the first treatment tested in the fall semester, and the second in the spring semester. Following testing all treatment conditions the participants received payment for their participation in the form of a gift card. Some received a gift card to a coffee shop and others received one to a megastore. Along with their gift card, participants also received a statement debriefing them of the actual intent of the study. Which of the following presents a potential confound?
A) debriefing letter
B) gift card type
C) month of testing
D) all are confounds
Scenario I
Scenario I is based on fabricated data inspired by the following study:
Hennig-Thurau, T., Groth, M., Paul, M. & Gremler, D. D. (2006). Are all smiles created equal? How emotional contagion and emotional labor affect service relationships. Journal of Marketing, 70, 58-73.
Do Smiling Employees Improve Customer Satisfaction?
In this 2 × 2 between-subjects design, Hennig-Thurau and colleagues examined the effect of employee emotions and authenticity of the emotion on customer relations. A total of 223 undergraduate volunteers participated in this study. The participants were told they would be testing a new movie consulting service. The movie consulting service was created by the experimenters, and actors were hired to act as customer service representatives. Each participant approached the service desk where the actor asked them a number of questions
Figure 1. Customers rate their experience more favorably when employees are smiling.(Scenario I) Suppose each treatment condition described in Scenario I was conducted sequentially with the first treatment tested in the fall semester, and the second in the spring semester. Following testing all treatment conditions the participants received payment for their participation in the form of a gift card. Some received a gift card to a coffee shop and others received one to a megastore. Along with their gift card, participants also received a statement debriefing them of the actual intent of the study. Which of the following presents a potential confound?
A) debriefing letter
B) gift card type
C) month of testing
D) all are confounds
Question
Question
Question
Use the following to answer questions
Scenario I
Scenario I is based on fabricated data inspired by the following study:
Hennig-Thurau, T., Groth, M., Paul, M. & Gremler, D. D. (2006). Are all smiles created equal? How emotional contagion and emotional labor affect service relationships. Journal of Marketing, 70, 58-73.
Do Smiling Employees Improve Customer Satisfaction?
In this 2 × 2 between-subjects design, Hennig-Thurau and colleagues examined the effect of employee emotions and authenticity of the emotion on customer relations. A total of 223 undergraduate volunteers participated in this study. The participants were told they would be testing a new movie consulting service. The movie consulting service was created by the experimenters, and actors were hired to act as customer service representatives. Each participant approached the service desk where the actor asked them a number of questions Figure 1. Customers rate their experience more favorably when employees are smiling.
(Scenario I) The researchers of Scenario I conducted a follow-up study to examine whether customer satisfaction differed based on the smiling of the employee and sex of the participant. This design can be described as:
A) a 2 × 2 design.
B) a factorial design.
C) a hybrid design.
D) all of the above.
Scenario I
Scenario I is based on fabricated data inspired by the following study:
Hennig-Thurau, T., Groth, M., Paul, M. & Gremler, D. D. (2006). Are all smiles created equal? How emotional contagion and emotional labor affect service relationships. Journal of Marketing, 70, 58-73.
Do Smiling Employees Improve Customer Satisfaction?
In this 2 × 2 between-subjects design, Hennig-Thurau and colleagues examined the effect of employee emotions and authenticity of the emotion on customer relations. A total of 223 undergraduate volunteers participated in this study. The participants were told they would be testing a new movie consulting service. The movie consulting service was created by the experimenters, and actors were hired to act as customer service representatives. Each participant approached the service desk where the actor asked them a number of questions
Figure 1. Customers rate their experience more favorably when employees are smiling.(Scenario I) The researchers of Scenario I conducted a follow-up study to examine whether customer satisfaction differed based on the smiling of the employee and sex of the participant. This design can be described as:
A) a 2 × 2 design.
B) a factorial design.
C) a hybrid design.
D) all of the above.
Question
Question
Use the following to answer questions
Scenario I
Scenario I is based on fabricated data inspired by the following study:
Hennig-Thurau, T., Groth, M., Paul, M. & Gremler, D. D. (2006). Are all smiles created equal? How emotional contagion and emotional labor affect service relationships. Journal of Marketing, 70, 58-73.
Do Smiling Employees Improve Customer Satisfaction?
In this 2 × 2 between-subjects design, Hennig-Thurau and colleagues examined the effect of employee emotions and authenticity of the emotion on customer relations. A total of 223 undergraduate volunteers participated in this study. The participants were told they would be testing a new movie consulting service. The movie consulting service was created by the experimenters, and actors were hired to act as customer service representatives. Each participant approached the service desk where the actor asked them a number of questions Figure 1. Customers rate their experience more favorably when employees are smiling.
(Scenario I) Suppose the researchers in Scenario I were unable to create the fictitious movie consulting service environment. Instead, they created four written scenarios that matched each of the four treatment conditions. Participants were randomly assigned to each treatment and were asked to indicate how satisfied they think they would have been based on the scenario they read. This type of design uses:
A) nonexperimental manipulations.
B) vignettes.
C) correlation
D) experimentation
Scenario I
Scenario I is based on fabricated data inspired by the following study:
Hennig-Thurau, T., Groth, M., Paul, M. & Gremler, D. D. (2006). Are all smiles created equal? How emotional contagion and emotional labor affect service relationships. Journal of Marketing, 70, 58-73.
Do Smiling Employees Improve Customer Satisfaction?
In this 2 × 2 between-subjects design, Hennig-Thurau and colleagues examined the effect of employee emotions and authenticity of the emotion on customer relations. A total of 223 undergraduate volunteers participated in this study. The participants were told they would be testing a new movie consulting service. The movie consulting service was created by the experimenters, and actors were hired to act as customer service representatives. Each participant approached the service desk where the actor asked them a number of questions
Figure 1. Customers rate their experience more favorably when employees are smiling.(Scenario I) Suppose the researchers in Scenario I were unable to create the fictitious movie consulting service environment. Instead, they created four written scenarios that matched each of the four treatment conditions. Participants were randomly assigned to each treatment and were asked to indicate how satisfied they think they would have been based on the scenario they read. This type of design uses:
A) nonexperimental manipulations.
B) vignettes.
C) correlation
D) experimentation
Question
Question
Question
Question
Use the following to answer questions
Scenario III
Scenario III is based on fabricated data inspired by the following study:
Spencer, S. J., Steele, C. M. & Quinn, D. M. (1999). Stereotype threat and women's math performance. Journal of Experimental Social Psychology, 35, 4-28.
Effect of Stereotype Threat on Math Study
The myth that men outperform women in math is widely believed by many individuals. The purpose of the study described in Scenario III was to determine if a sample of women whose math abilities equaled a sample of men would fall victim to this threat. To that end, 28 adult men and 28 adult women were administered an easy math test or a difficult math test. The performance of men and women on both the easy and hard test was quantified. A two-factor ANOVA revealed a significant main effect for test, with participants scoring significantly better on the easy test. The analyses also revealed a main effect for sex, with men performing significantly better than women. The interaction between test difficulty and sex was also statistically significant. Further inspection of the data revealed that although men and women did not differ on the easy math test, women performed significantly less well than men on the difficult math test. Given that the screening criteria for participants including earning a grade of B or better in college calculus, and scoring in at least the 85th percentile on the math subsection of the ACT, the current study indicates that women do succumb to math stereotype threat but only when the math challenge is great. The data are presented in Figure 2.
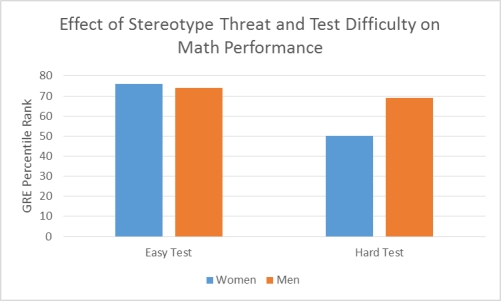 Figure 2. Although women and men performed equally on an easy version of the math test, women performed significantly worse than men on the difficult version.
(Scenario III) The study described in Scenario III examined the effect of two independent variables on math performance. Based on this design, which of the following is true?
A) There could potentially be one main effect and one interaction.
B) If a main effect is identified, then there will automatically be an interaction.
C) If there is an interaction, then there will not be a main effect.
D) The design allows for three hypotheses to be tested.
Scenario III
Scenario III is based on fabricated data inspired by the following study:
Spencer, S. J., Steele, C. M. & Quinn, D. M. (1999). Stereotype threat and women's math performance. Journal of Experimental Social Psychology, 35, 4-28.
Effect of Stereotype Threat on Math Study
The myth that men outperform women in math is widely believed by many individuals. The purpose of the study described in Scenario III was to determine if a sample of women whose math abilities equaled a sample of men would fall victim to this threat. To that end, 28 adult men and 28 adult women were administered an easy math test or a difficult math test. The performance of men and women on both the easy and hard test was quantified. A two-factor ANOVA revealed a significant main effect for test, with participants scoring significantly better on the easy test. The analyses also revealed a main effect for sex, with men performing significantly better than women. The interaction between test difficulty and sex was also statistically significant. Further inspection of the data revealed that although men and women did not differ on the easy math test, women performed significantly less well than men on the difficult math test. Given that the screening criteria for participants including earning a grade of B or better in college calculus, and scoring in at least the 85th percentile on the math subsection of the ACT, the current study indicates that women do succumb to math stereotype threat but only when the math challenge is great. The data are presented in Figure 2.
Figure 2. Although women and men performed equally on an easy version of the math test, women performed significantly worse than men on the difficult version.(Scenario III) The study described in Scenario III examined the effect of two independent variables on math performance. Based on this design, which of the following is true?
A) There could potentially be one main effect and one interaction.
B) If a main effect is identified, then there will automatically be an interaction.
C) If there is an interaction, then there will not be a main effect.
D) The design allows for three hypotheses to be tested.
Question
Question
Use the following to answer questions
Scenario III
Scenario III is based on fabricated data inspired by the following study:
Spencer, S. J., Steele, C. M. & Quinn, D. M. (1999). Stereotype threat and women's math performance. Journal of Experimental Social Psychology, 35, 4-28.
Effect of Stereotype Threat on Math Study
The myth that men outperform women in math is widely believed by many individuals. The purpose of the study described in Scenario III was to determine if a sample of women whose math abilities equaled a sample of men would fall victim to this threat. To that end, 28 adult men and 28 adult women were administered an easy math test or a difficult math test. The performance of men and women on both the easy and hard test was quantified. A two-factor ANOVA revealed a significant main effect for test, with participants scoring significantly better on the easy test. The analyses also revealed a main effect for sex, with men performing significantly better than women. The interaction between test difficulty and sex was also statistically significant. Further inspection of the data revealed that although men and women did not differ on the easy math test, women performed significantly less well than men on the difficult math test. Given that the screening criteria for participants including earning a grade of B or better in college calculus, and scoring in at least the 85th percentile on the math subsection of the ACT, the current study indicates that women do succumb to math stereotype threat but only when the math challenge is great. The data are presented in Figure 2.
Figure 2. Although women and men performed equally on an easy version of the math test, women performed significantly worse than men on the difficult version.
(Scenario III) Suppose the researchers described in Scenario III added a third level of difficulty to the math test and added a third variable (time to complete test). Participants were given 1 hour, 2 hours, or 3 hours to complete the test. This design would now produce how many unique treatment conditions?
A) 3
B) 9
C) 18
D) 27
Scenario III
Scenario III is based on fabricated data inspired by the following study:
Spencer, S. J., Steele, C. M. & Quinn, D. M. (1999). Stereotype threat and women's math performance. Journal of Experimental Social Psychology, 35, 4-28.
Effect of Stereotype Threat on Math Study
The myth that men outperform women in math is widely believed by many individuals. The purpose of the study described in Scenario III was to determine if a sample of women whose math abilities equaled a sample of men would fall victim to this threat. To that end, 28 adult men and 28 adult women were administered an easy math test or a difficult math test. The performance of men and women on both the easy and hard test was quantified. A two-factor ANOVA revealed a significant main effect for test, with participants scoring significantly better on the easy test. The analyses also revealed a main effect for sex, with men performing significantly better than women. The interaction between test difficulty and sex was also statistically significant. Further inspection of the data revealed that although men and women did not differ on the easy math test, women performed significantly less well than men on the difficult math test. Given that the screening criteria for participants including earning a grade of B or better in college calculus, and scoring in at least the 85th percentile on the math subsection of the ACT, the current study indicates that women do succumb to math stereotype threat but only when the math challenge is great. The data are presented in Figure 2.
Figure 2. Although women and men performed equally on an easy version of the math test, women performed significantly worse than men on the difficult version.(Scenario III) Suppose the researchers described in Scenario III added a third level of difficulty to the math test and added a third variable (time to complete test). Participants were given 1 hour, 2 hours, or 3 hours to complete the test. This design would now produce how many unique treatment conditions?
A) 3
B) 9
C) 18
D) 27
Question
Question
Use the following to answer questions
Scenario III
Scenario III is based on fabricated data inspired by the following study:
Spencer, S. J., Steele, C. M. & Quinn, D. M. (1999). Stereotype threat and women's math performance. Journal of Experimental Social Psychology, 35, 4-28.
Effect of Stereotype Threat on Math Study
The myth that men outperform women in math is widely believed by many individuals. The purpose of the study described in Scenario III was to determine if a sample of women whose math abilities equaled a sample of men would fall victim to this threat. To that end, 28 adult men and 28 adult women were administered an easy math test or a difficult math test. The performance of men and women on both the easy and hard test was quantified. A two-factor ANOVA revealed a significant main effect for test, with participants scoring significantly better on the easy test. The analyses also revealed a main effect for sex, with men performing significantly better than women. The interaction between test difficulty and sex was also statistically significant. Further inspection of the data revealed that although men and women did not differ on the easy math test, women performed significantly less well than men on the difficult math test. Given that the screening criteria for participants including earning a grade of B or better in college calculus, and scoring in at least the 85th percentile on the math subsection of the ACT, the current study indicates that women do succumb to math stereotype threat but only when the math challenge is great. The data are presented in Figure 2.
Figure 2. Although women and men performed equally on an easy version of the math test, women performed significantly worse than men on the difficult version.
(Scenario III) The study described in Scenario III used a factorial design to examine the effect of sex and test difficulty on math performance. Which of the following is NOT true of factorial designs?
A) It requires more participants and takes a greater amount of time to conduct.
B) It tests three hypotheses simultaneously.
C) It can identify a synergistic effect of the independent variables.
D) It can identify a suppression effect of the independent variables.
Scenario III
Scenario III is based on fabricated data inspired by the following study:
Spencer, S. J., Steele, C. M. & Quinn, D. M. (1999). Stereotype threat and women's math performance. Journal of Experimental Social Psychology, 35, 4-28.
Effect of Stereotype Threat on Math Study
The myth that men outperform women in math is widely believed by many individuals. The purpose of the study described in Scenario III was to determine if a sample of women whose math abilities equaled a sample of men would fall victim to this threat. To that end, 28 adult men and 28 adult women were administered an easy math test or a difficult math test. The performance of men and women on both the easy and hard test was quantified. A two-factor ANOVA revealed a significant main effect for test, with participants scoring significantly better on the easy test. The analyses also revealed a main effect for sex, with men performing significantly better than women. The interaction between test difficulty and sex was also statistically significant. Further inspection of the data revealed that although men and women did not differ on the easy math test, women performed significantly less well than men on the difficult math test. Given that the screening criteria for participants including earning a grade of B or better in college calculus, and scoring in at least the 85th percentile on the math subsection of the ACT, the current study indicates that women do succumb to math stereotype threat but only when the math challenge is great. The data are presented in Figure 2.
Figure 2. Although women and men performed equally on an easy version of the math test, women performed significantly worse than men on the difficult version.(Scenario III) The study described in Scenario III used a factorial design to examine the effect of sex and test difficulty on math performance. Which of the following is NOT true of factorial designs?
A) It requires more participants and takes a greater amount of time to conduct.
B) It tests three hypotheses simultaneously.
C) It can identify a synergistic effect of the independent variables.
D) It can identify a suppression effect of the independent variables.
Question
Question
Use the following to answer questions
Scenario III
Scenario III is based on fabricated data inspired by the following study:
Spencer, S. J., Steele, C. M. & Quinn, D. M. (1999). Stereotype threat and women's math performance. Journal of Experimental Social Psychology, 35, 4-28.
Effect of Stereotype Threat on Math Study
The myth that men outperform women in math is widely believed by many individuals. The purpose of the study described in Scenario III was to determine if a sample of women whose math abilities equaled a sample of men would fall victim to this threat. To that end, 28 adult men and 28 adult women were administered an easy math test or a difficult math test. The performance of men and women on both the easy and hard test was quantified. A two-factor ANOVA revealed a significant main effect for test, with participants scoring significantly better on the easy test. The analyses also revealed a main effect for sex, with men performing significantly better than women. The interaction between test difficulty and sex was also statistically significant. Further inspection of the data revealed that although men and women did not differ on the easy math test, women performed significantly less well than men on the difficult math test. Given that the screening criteria for participants including earning a grade of B or better in college calculus, and scoring in at least the 85th percentile on the math subsection of the ACT, the current study indicates that women do succumb to math stereotype threat but only when the math challenge is great. The data are presented in Figure 2.
Figure 2. Although women and men performed equally on an easy version of the math test, women performed significantly worse than men on the difficult version.
(Scenario III) According to Scenario III, there was a main effect for sex, with men performing significantly better than women. To arrive at this conclusion, the researchers would have had to examine:
A) interaction means.
B) cell means.
C) marginal means.
D) factorial means.
Scenario III
Scenario III is based on fabricated data inspired by the following study:
Spencer, S. J., Steele, C. M. & Quinn, D. M. (1999). Stereotype threat and women's math performance. Journal of Experimental Social Psychology, 35, 4-28.
Effect of Stereotype Threat on Math Study
The myth that men outperform women in math is widely believed by many individuals. The purpose of the study described in Scenario III was to determine if a sample of women whose math abilities equaled a sample of men would fall victim to this threat. To that end, 28 adult men and 28 adult women were administered an easy math test or a difficult math test. The performance of men and women on both the easy and hard test was quantified. A two-factor ANOVA revealed a significant main effect for test, with participants scoring significantly better on the easy test. The analyses also revealed a main effect for sex, with men performing significantly better than women. The interaction between test difficulty and sex was also statistically significant. Further inspection of the data revealed that although men and women did not differ on the easy math test, women performed significantly less well than men on the difficult math test. Given that the screening criteria for participants including earning a grade of B or better in college calculus, and scoring in at least the 85th percentile on the math subsection of the ACT, the current study indicates that women do succumb to math stereotype threat but only when the math challenge is great. The data are presented in Figure 2.
Figure 2. Although women and men performed equally on an easy version of the math test, women performed significantly worse than men on the difficult version.(Scenario III) According to Scenario III, there was a main effect for sex, with men performing significantly better than women. To arrive at this conclusion, the researchers would have had to examine:
A) interaction means.
B) cell means.
C) marginal means.
D) factorial means.
Question
Question
Question
Question
Question
Question
Use the following to answer questions
Scenario III
Scenario III is based on fabricated data inspired by the following study:
Spencer, S. J., Steele, C. M. & Quinn, D. M. (1999). Stereotype threat and women's math performance. Journal of Experimental Social Psychology, 35, 4-28.
Effect of Stereotype Threat on Math Study
The myth that men outperform women in math is widely believed by many individuals. The purpose of the study described in Scenario III was to determine if a sample of women whose math abilities equaled a sample of men would fall victim to this threat. To that end, 28 adult men and 28 adult women were administered an easy math test or a difficult math test. The performance of men and women on both the easy and hard test was quantified. A two-factor ANOVA revealed a significant main effect for test, with participants scoring significantly better on the easy test. The analyses also revealed a main effect for sex, with men performing significantly better than women. The interaction between test difficulty and sex was also statistically significant. Further inspection of the data revealed that although men and women did not differ on the easy math test, women performed significantly less well than men on the difficult math test. Given that the screening criteria for participants including earning a grade of B or better in college calculus, and scoring in at least the 85th percentile on the math subsection of the ACT, the current study indicates that women do succumb to math stereotype threat but only when the math challenge is great. The data are presented in Figure 2.
Figure 2. Although women and men performed equally on an easy version of the math test, women performed significantly worse than men on the difficult version.
(Scenario III) What makes the design in Scenario III a hybrid design?
A) There is more than one independent variable examined.
B) One independent variable is measured at the nominal and one is measured at the ratio level.
C) Sex is a quasi-independent variable.
D) All of the reasons are true.
Scenario III
Scenario III is based on fabricated data inspired by the following study:
Spencer, S. J., Steele, C. M. & Quinn, D. M. (1999). Stereotype threat and women's math performance. Journal of Experimental Social Psychology, 35, 4-28.
Effect of Stereotype Threat on Math Study
The myth that men outperform women in math is widely believed by many individuals. The purpose of the study described in Scenario III was to determine if a sample of women whose math abilities equaled a sample of men would fall victim to this threat. To that end, 28 adult men and 28 adult women were administered an easy math test or a difficult math test. The performance of men and women on both the easy and hard test was quantified. A two-factor ANOVA revealed a significant main effect for test, with participants scoring significantly better on the easy test. The analyses also revealed a main effect for sex, with men performing significantly better than women. The interaction between test difficulty and sex was also statistically significant. Further inspection of the data revealed that although men and women did not differ on the easy math test, women performed significantly less well than men on the difficult math test. Given that the screening criteria for participants including earning a grade of B or better in college calculus, and scoring in at least the 85th percentile on the math subsection of the ACT, the current study indicates that women do succumb to math stereotype threat but only when the math challenge is great. The data are presented in Figure 2.
Figure 2. Although women and men performed equally on an easy version of the math test, women performed significantly worse than men on the difficult version.(Scenario III) What makes the design in Scenario III a hybrid design?
A) There is more than one independent variable examined.
B) One independent variable is measured at the nominal and one is measured at the ratio level.
C) Sex is a quasi-independent variable.
D) All of the reasons are true.
Question
Question

Unlock Deck
Sign up to unlock the cards in this deck!
Unlock Deck
Unlock Deck
1/176
Play
Full screen (f)
Deck 11: Factorial Design: I Lost My Phone Number, Can I Borrow Yours Do Pickup Lines Really Work
1
Interactions are helpful to study because they tend to:
A) mimic controlled laboratory settings.
B) increase ecological validity.
C) increase experimental control.
D) increase internal validity.
A) mimic controlled laboratory settings.
B) increase ecological validity.
C) increase experimental control.
D) increase internal validity.
increase ecological validity.
2
Dr. Tezin wants to focus on only one independent variable at a time, and ignore the effects of all other independent variables in her upcoming study. Dr. Tezin is most concerned about a:
A) Main effect hypothesis
B) Interaction effect hypothesis
C) Suppression effect
D) Crossover interaction
A) Main effect hypothesis
B) Interaction effect hypothesis
C) Suppression effect
D) Crossover interaction
Main effect hypothesis
3
Synergistic effect is an effect where two variables ____ to produce an outcome that is _____ than what each individual variable contributes.
A) separate; smaller
B) separate; bigger
C) combine; smaller
D) combine; bigger
A) separate; smaller
B) separate; bigger
C) combine; smaller
D) combine; bigger
combine; bigger
4
Hybrid designs include any factorial design that has at least one _____ variable.
A) moderator
B) quasi-independent
C) quasi-experimental
D) nominal
A) moderator
B) quasi-independent
C) quasi-experimental
D) nominal
Unlock Deck
Unlock for access to all 176 flashcards in this deck.
Unlock Deck
k this deck
5
Tonya developed hypothetical scenarios for her sociology course. Her professor asked to use her descriptions of hypothetical dating scenarios for an upcoming experimental study. What would be the best term to describe Tonya's scenarios? _____________ is when the influence of one independent variable on the other reverses across the levels of the other variable.
A) a main effect
B) a hypothesis
C) vignettes
D) a marginal effect
A) a main effect
B) a hypothesis
C) vignettes
D) a marginal effect
Unlock Deck
Unlock for access to all 176 flashcards in this deck.
Unlock Deck
k this deck
6
How many possible outcomes, including both main effects and interaction effects, are possible for a factorial design with three independent variables?
A) 4
B) 6
C) 8
D) 10
A) 4
B) 6
C) 8
D) 10
Unlock Deck
Unlock for access to all 176 flashcards in this deck.
Unlock Deck
k this deck
7
A 2 × 2 × 4 factorial design includes how many independent variables?
A) 1
B) 2
C) 3
D) 4
A) 1
B) 2
C) 3
D) 4
Unlock Deck
Unlock for access to all 176 flashcards in this deck.
Unlock Deck
k this deck
8
A 3 × 3 × 2 factorial design includes how many levels in the second independent variable?
A) 1
B) 2
C) 3
D) 4
A) 1
B) 2
C) 3
D) 4
Unlock Deck
Unlock for access to all 176 flashcards in this deck.
Unlock Deck
k this deck
9
In a 2 × 2 factorial design how many possible combinations of the independent variables exist?
A) 2
B) 3
C) 4
D) 5
A) 2
B) 3
C) 4
D) 5
Unlock Deck
Unlock for access to all 176 flashcards in this deck.
Unlock Deck
k this deck
10
Dr. Muma wishes to utilize research confederates in his upcoming studies. Which of the following would be the best reason to include a research confederate in an experiment?
A) without research confederate's administration of the assessments would be unreliable
B) it would increase internal validity
C) it would increase experimental control and therefore standardization
D) it would decrease external validity and generalizability
A) without research confederate's administration of the assessments would be unreliable
B) it would increase internal validity
C) it would increase experimental control and therefore standardization
D) it would decrease external validity and generalizability
Unlock Deck
Unlock for access to all 176 flashcards in this deck.
Unlock Deck
k this deck
11
A 4 × 3 × 2 × 2 × 2 factorial design includes how many independent variables?
A) 2
B) 4
C) 6
D) 8
A) 2
B) 4
C) 6
D) 8
Unlock Deck
Unlock for access to all 176 flashcards in this deck.
Unlock Deck
k this deck
12
Tyrese wants to conduct a study on how athletics influence a student's practical cognitive flexibility. Which of the following would be the best for optimizing mundane realism?
A) art class
B) a research laboratory
C) a classroom
D) a library
A) art class
B) a research laboratory
C) a classroom
D) a library
Unlock Deck
Unlock for access to all 176 flashcards in this deck.
Unlock Deck
k this deck
13
A two-way analysis of variance is a statistical test that allows researchers to _____ test how two _____nominal or categorical independent variables influence the dependent variable and how those independent variables interact to influence the dependent variable.
A) consecutively; combined
B) consecutively; separate
C) simultaneously; combined
D) simultaneously; separate
A) consecutively; combined
B) consecutively; separate
C) simultaneously; combined
D) simultaneously; separate
Unlock Deck
Unlock for access to all 176 flashcards in this deck.
Unlock Deck
k this deck
14
A 4 × 3 × 2 × 2 × 2 factorial design includes how many levels in the second independent variable?
A) 1
B) 2
C) 3
D) 4
A) 1
B) 2
C) 3
D) 4
Unlock Deck
Unlock for access to all 176 flashcards in this deck.
Unlock Deck
k this deck
15
In a 2 × 2 factorial design using a within-subjects design:
A) different participants will experience both levels for both the independent variables.
B) the same participants will experience two levels of the IV and two levels of the DV.
C) different participants will experience only one level for each independent variable.
D) the same participants will experience both levels for both of the independent variables.
Unlock Deck
Unlock for access to all 176 flashcards in this deck.
Unlock Deck
k this deck
16
A main effect hypothesis focuses on the effect of _____independent variable(s) on the _____ variable, ignoring all other independent variables.
A) a single; dependent
B) multiple; dependent
C) a single; moderating
D) multiple; moderating
A) a single; dependent
B) multiple; dependent
C) a single; moderating
D) multiple; moderating
Unlock Deck
Unlock for access to all 176 flashcards in this deck.
Unlock Deck
k this deck
17
A 2 × 2 factorial design includes _____ levels in the first independent variable.
A) 2
B) 4
C) 6
D) 8
A) 2
B) 4
C) 6
D) 8
Unlock Deck
Unlock for access to all 176 flashcards in this deck.
Unlock Deck
k this deck
18
Suppression effect is an effect where two variables _____ to produce an outcome that is _____than what each individual variable contributes.
A) separate; smaller
B) separate; bigger
C) combine; smaller
D) combine; bigger
A) separate; smaller
B) separate; bigger
C) combine; smaller
D) combine; bigger
Unlock Deck
Unlock for access to all 176 flashcards in this deck.
Unlock Deck
k this deck
19
Rick is conducting a two-way analysis of variance for his research methods term paper. He plans to simultaneously test how two separate _____________ independent variables influence the __________ variable and how those independent variables interact to influence the dependent variable.
A) ordinal; independent
B) nominal; dependent
C) interval; dependent
D) continuous; independent
A) ordinal; independent
B) nominal; dependent
C) interval; dependent
D) continuous; independent
Unlock Deck
Unlock for access to all 176 flashcards in this deck.
Unlock Deck
k this deck
20
An interaction effect hypothesis is a prediction about how the levels of one independent variable combine with another independent to influence the _____in a way that extends beyond the _____of the two separate main effects.
A) dependent variable; sum
B) interaction effect; product
C) dependent variable; quotient
D) dependent variable; product
A) dependent variable; sum
B) interaction effect; product
C) dependent variable; quotient
D) dependent variable; product
Unlock Deck
Unlock for access to all 176 flashcards in this deck.
Unlock Deck
k this deck
21
A two-way analysis of variance is a statistical test that allows researchers to simultaneously test how two separate _____ or categorical independent variables influence the _____ variable and how those independent variables interact to influence the dependent variable.
A) ordinal; independent
B) nominal; dependent
C) interval; dependent
D) nominal; independent
A) ordinal; independent
B) nominal; dependent
C) interval; dependent
D) nominal; independent
Unlock Deck
Unlock for access to all 176 flashcards in this deck.
Unlock Deck
k this deck
22
_____ is a prediction that focuses on one independent variable at a time, ignoring all other independent variables.
A) A main effect hypothesis
B) An interaction effect hypothesis
C) A suppression effect
D) A crossover interaction
A) A main effect hypothesis
B) An interaction effect hypothesis
C) A suppression effect
D) A crossover interaction
Unlock Deck
Unlock for access to all 176 flashcards in this deck.
Unlock Deck
k this deck
23
Ramona wants to conduct a study on how poetry influences student's creativity. Which of the following would be the best for optimizing mundane realism?
A) art class
B) a research laboratory
C) a classroom
D) a library
A) art class
B) a research laboratory
C) a classroom
D) a library
Unlock Deck
Unlock for access to all 176 flashcards in this deck.
Unlock Deck
k this deck
24
Based on the research which of the following would be an example of an innocuous pick-up line?
A) Did it hurt when you fell from heaven?
B) Where are you from?
C) I'm huggable like a teddy bear, are you?
D) I am very interested in you.
A) Did it hurt when you fell from heaven?
B) Where are you from?
C) I'm huggable like a teddy bear, are you?
D) I am very interested in you.
Unlock Deck
Unlock for access to all 176 flashcards in this deck.
Unlock Deck
k this deck
25
A 2003 study investigating complex genes and body scent attractiveness in men and women found that:
A) men preferred the scent of attractive women with higher probability of conception.
B) women preferred the scent of asymmetrical men over symmetrical men.
C) woman using contraceptives during the most fertile part of their menstrual tended to prefer symmetrical men's scents over asymmetrical men's scents.
D) women preferred the scent of attractive men.
Unlock Deck
Unlock for access to all 176 flashcards in this deck.
Unlock Deck
k this deck
26
_____ refers to the average of the dependent variable for participants with a specific combination of the levels of the independent variables.
A) Cell mean
B) Marginal mean
C) Main effect
D) Crossover interaction
A) Cell mean
B) Marginal mean
C) Main effect
D) Crossover interaction
Unlock Deck
Unlock for access to all 176 flashcards in this deck.
Unlock Deck
k this deck
27
_____ is an effect in which two variables combine to produce an outcome that is bigger than what each individual variable contributes.
A) Carryover effect
B) Synergistic effect
C) Main effect
D) Suppression effect
A) Carryover effect
B) Synergistic effect
C) Main effect
D) Suppression effect
Unlock Deck
Unlock for access to all 176 flashcards in this deck.
Unlock Deck
k this deck
28
______ refers to the average of all participants on one level of the independent variable, ignoring the other independent variable.
A) Cell mean
B) Interaction
C) Marginal mean
D) Hybrid design
A) Cell mean
B) Interaction
C) Marginal mean
D) Hybrid design
Unlock Deck
Unlock for access to all 176 flashcards in this deck.
Unlock Deck
k this deck
29
In a 1986 study examining preferences for opening lines among men and women researchers found:
A) three main types of pick-up lines: cute/innocuous/direct.
B) two main types of pick-up lines: cute/obnoxious.
C) two main types of pick-up lines: direct/indirect.
D) four main types of pick-up lines: cute/indirect/innocuous/obnoxious.
A) three main types of pick-up lines: cute/innocuous/direct.
B) two main types of pick-up lines: cute/obnoxious.
C) two main types of pick-up lines: direct/indirect.
D) four main types of pick-up lines: cute/indirect/innocuous/obnoxious.
Unlock Deck
Unlock for access to all 176 flashcards in this deck.
Unlock Deck
k this deck
30
____ is when the influence of one independent variable on the other reverses across the levels of the other variable.
A) A main effect
B) A correlation
C) A crossover interaction
D) A marginal effect
A) A main effect
B) A correlation
C) A crossover interaction
D) A marginal effect
Unlock Deck
Unlock for access to all 176 flashcards in this deck.
Unlock Deck
k this deck
31
Why would using research confederates be helpful in an experiment?
A) Research confederates are often peers of the participants.
B) Research confederates increase internal validity.
C) Research confederates increase experimental control and therefore standardization.
D) Research confederates decrease external validity and generalizability.
A) Research confederates are often peers of the participants.
B) Research confederates increase internal validity.
C) Research confederates increase experimental control and therefore standardization.
D) Research confederates decrease external validity and generalizability.
Unlock Deck
Unlock for access to all 176 flashcards in this deck.
Unlock Deck
k this deck
32
_____ is an effect in which two variables combine to produce an outcome that is smaller than what each individual variable contributes.
A) Carryover effect
B) Synergistic effect
C) Main effect
D) Suppression effect
A) Carryover effect
B) Synergistic effect
C) Main effect
D) Suppression effect
Unlock Deck
Unlock for access to all 176 flashcards in this deck.
Unlock Deck
k this deck
33
Cell mean refers to the mean of the _____variables for participants with a specific combination of the levels of the _____.
A) independent; dependent variables
B) moderator; dependent variables
C) dependent; interaction
D) dependent; independent variables
A) independent; dependent variables
B) moderator; dependent variables
C) dependent; interaction
D) dependent; independent variables
Unlock Deck
Unlock for access to all 176 flashcards in this deck.
Unlock Deck
k this deck
34
______ is when one independent variable's influence on the dependent variable changes depending on the level of the other independent variable(s).
A) A factorial design
B) An interaction
C) A correlation
D) An effect size
A) A factorial design
B) An interaction
C) A correlation
D) An effect size
Unlock Deck
Unlock for access to all 176 flashcards in this deck.
Unlock Deck
k this deck
35
_____ is any experimental design that has more than one independent variable.
A) A one-way ANOVA
B) A chi-square test of independence
C) A factorial design
D) A hybrid design
A) A one-way ANOVA
B) A chi-square test of independence
C) A factorial design
D) A hybrid design
Unlock Deck
Unlock for access to all 176 flashcards in this deck.
Unlock Deck
k this deck
36
_____ is a description of a hypothetical situation, event, or scenario to which participants react.
A) A vignette
B) A main effect hypothesis
C) A synergistic effect
D) Mundane realism
A) A vignette
B) A main effect hypothesis
C) A synergistic effect
D) Mundane realism
Unlock Deck
Unlock for access to all 176 flashcards in this deck.
Unlock Deck
k this deck
37
You can exclude study participants for all of these reasons EXCEPT:
A) on the basis of researcher judgment that other individuals would benefit more from participation.
B) on the basis of previous research indicating that certain participants are more appropriate.
C) on the basis of medical history that it may be medically unhealthy, damaging, or problematic for them to participate in the study.
D) on the basis of researcher judgment that the study will obtain greater significance if those individuals are prohibited from participating.
Unlock Deck
Unlock for access to all 176 flashcards in this deck.
Unlock Deck
k this deck
38
_____ is any factorial design that has at least one quasi-independent variable.
A) A one-way ANOVA
B) A chi-square test of independence
C) A factorial design
D) A hybrid design
A) A one-way ANOVA
B) A chi-square test of independence
C) A factorial design
D) A hybrid design
Unlock Deck
Unlock for access to all 176 flashcards in this deck.
Unlock Deck
k this deck
39
_____ is a statistical test that allows researchers to simultaneously test how two separate nominal or categorical independent variables influence the dependent variable and how those independent variables interact to influence the dependent variable.
A) A two-analysis of variance
B) A one-way analysis of variance
C) A repeated-measures analysis of variance
D) A chi-square test for independence
A) A two-analysis of variance
B) A one-way analysis of variance
C) A repeated-measures analysis of variance
D) A chi-square test for independence
Unlock Deck
Unlock for access to all 176 flashcards in this deck.
Unlock Deck
k this deck
40
Marginal mean refers to the average of all participants on _____ level(s) of the _____ variable.
A) one; independent
B) two; independent
C) one; dependent
D) two; dependent
A) one; independent
B) two; independent
C) one; dependent
D) two; dependent
Unlock Deck
Unlock for access to all 176 flashcards in this deck.
Unlock Deck
k this deck
41
What is a crossover interaction?
Unlock Deck
Unlock for access to all 176 flashcards in this deck.
Unlock Deck
k this deck
42
What is a main effect hypothesis?
Unlock Deck
Unlock for access to all 176 flashcards in this deck.
Unlock Deck
k this deck
43
In the study developed throughout Chapter 11, what was the interaction hypothesis?
Unlock Deck
Unlock for access to all 176 flashcards in this deck.
Unlock Deck
k this deck
44
What is a vignette?
Unlock Deck
Unlock for access to all 176 flashcards in this deck.
Unlock Deck
k this deck
45
Based on the following information identify what type of factorial design is being described and how you reached your conclusion: Dr. Ames is interesting in examining the role of sex (male and female) and social interest (introvert, extravert, and ambivert) in matching romantic partners.
Unlock Deck
Unlock for access to all 176 flashcards in this deck.
Unlock Deck
k this deck
46
Use the following to answer questions
Scenario I
Scenario I is based on fabricated data inspired by the following study:
Hennig-Thurau, T., Groth, M., Paul, M. & Gremler, D. D. (2006). Are all smiles created equal? How emotional contagion and emotional labor affect service relationships. Journal of Marketing, 70, 58-73.
Do Smiling Employees Improve Customer Satisfaction?
In this 2 × 2 between-subjects design, Hennig-Thurau and colleagues examined the effect of employee emotions and authenticity of the emotion on customer relations. A total of 223 undergraduate volunteers participated in this study. The participants were told they would be testing a new movie consulting service. The movie consulting service was created by the experimenters, and actors were hired to act as customer service representatives. Each participant approached the service desk where the actor asked them a number of questions Figure 1. Customers rate their experience more favorably when employees are smiling.
(Scenario I)How many hypotheses were tested in the study described in Scenario I?
A) one
B) two
C) three
D) four
Scenario I
Scenario I is based on fabricated data inspired by the following study:
Hennig-Thurau, T., Groth, M., Paul, M. & Gremler, D. D. (2006). Are all smiles created equal? How emotional contagion and emotional labor affect service relationships. Journal of Marketing, 70, 58-73.
Do Smiling Employees Improve Customer Satisfaction?
In this 2 × 2 between-subjects design, Hennig-Thurau and colleagues examined the effect of employee emotions and authenticity of the emotion on customer relations. A total of 223 undergraduate volunteers participated in this study. The participants were told they would be testing a new movie consulting service. The movie consulting service was created by the experimenters, and actors were hired to act as customer service representatives. Each participant approached the service desk where the actor asked them a number of questions
Figure 1. Customers rate their experience more favorably when employees are smiling.(Scenario I)How many hypotheses were tested in the study described in Scenario I?
A) one
B) two
C) three
D) four
Unlock Deck
Unlock for access to all 176 flashcards in this deck.
Unlock Deck
k this deck
47
What is a suppression effect?
Unlock Deck
Unlock for access to all 176 flashcards in this deck.
Unlock Deck
k this deck
48
What is an interaction effect hypothesis?
Unlock Deck
Unlock for access to all 176 flashcards in this deck.
Unlock Deck
k this deck
49
What is a synergistic effect?
Unlock Deck
Unlock for access to all 176 flashcards in this deck.
Unlock Deck
k this deck
50
Based on the following information identify what type of factorial design is being described and how you reached your conclusion: Dr. Scoggins is examining the influence of consumption of alcohol (10 ounces, 16 ounces, or 24 ounces) on a timed attention task (1 minute, 5 minutes, or 10 minutes) and eye tracking (focused or unfocused) to determine the cognitive effects of alcohol on the brain.
Unlock Deck
Unlock for access to all 176 flashcards in this deck.
Unlock Deck
k this deck
51
Write a main effect hypothesis and an interaction effect hypothesis.
Unlock Deck
Unlock for access to all 176 flashcards in this deck.
Unlock Deck
k this deck
52
What is a marginal mean?
Unlock Deck
Unlock for access to all 176 flashcards in this deck.
Unlock Deck
k this deck
53
Use the following to answer questions
Scenario I
Scenario I is based on fabricated data inspired by the following study:
Hennig-Thurau, T., Groth, M., Paul, M. & Gremler, D. D. (2006). Are all smiles created equal? How emotional contagion and emotional labor affect service relationships. Journal of Marketing, 70, 58-73.
Do Smiling Employees Improve Customer Satisfaction?
In this 2 × 2 between-subjects design, Hennig-Thurau and colleagues examined the effect of employee emotions and authenticity of the emotion on customer relations. A total of 223 undergraduate volunteers participated in this study. The participants were told they would be testing a new movie consulting service. The movie consulting service was created by the experimenters, and actors were hired to act as customer service representatives. Each participant approached the service desk where the actor asked them a number of questions Figure 1. Customers rate their experience more favorably when employees are smiling.
(Scenario I) Which of the following hypothesis did the results of the study described in Scenario I support?
A) There is a main effect for emotion, but no main effect for authenticity or interaction between emotion and authenticity on customer satisfaction.
B) There is a main effect for emotion and a main effect for authenticity, but not an interaction between emotion and authenticity on customer satisfaction.
C) There is a main effect for emotion, a main effect for interaction and an interaction between emotion and authenticity on customer satisfaction.
D) There is no effect for emotion, authenticity, or emotion × authenticity interaction on customer satisfaction.
Scenario I
Scenario I is based on fabricated data inspired by the following study:
Hennig-Thurau, T., Groth, M., Paul, M. & Gremler, D. D. (2006). Are all smiles created equal? How emotional contagion and emotional labor affect service relationships. Journal of Marketing, 70, 58-73.
Do Smiling Employees Improve Customer Satisfaction?
In this 2 × 2 between-subjects design, Hennig-Thurau and colleagues examined the effect of employee emotions and authenticity of the emotion on customer relations. A total of 223 undergraduate volunteers participated in this study. The participants were told they would be testing a new movie consulting service. The movie consulting service was created by the experimenters, and actors were hired to act as customer service representatives. Each participant approached the service desk where the actor asked them a number of questions
Figure 1. Customers rate their experience more favorably when employees are smiling.(Scenario I) Which of the following hypothesis did the results of the study described in Scenario I support?
A) There is a main effect for emotion, but no main effect for authenticity or interaction between emotion and authenticity on customer satisfaction.
B) There is a main effect for emotion and a main effect for authenticity, but not an interaction between emotion and authenticity on customer satisfaction.
C) There is a main effect for emotion, a main effect for interaction and an interaction between emotion and authenticity on customer satisfaction.
D) There is no effect for emotion, authenticity, or emotion × authenticity interaction on customer satisfaction.
Unlock Deck
Unlock for access to all 176 flashcards in this deck.
Unlock Deck
k this deck
54
Use the following to answer questions
Scenario I
Scenario I is based on fabricated data inspired by the following study:
Hennig-Thurau, T., Groth, M., Paul, M. & Gremler, D. D. (2006). Are all smiles created equal? How emotional contagion and emotional labor affect service relationships. Journal of Marketing, 70, 58-73.
Do Smiling Employees Improve Customer Satisfaction?
In this 2 × 2 between-subjects design, Hennig-Thurau and colleagues examined the effect of employee emotions and authenticity of the emotion on customer relations. A total of 223 undergraduate volunteers participated in this study. The participants were told they would be testing a new movie consulting service. The movie consulting service was created by the experimenters, and actors were hired to act as customer service representatives. Each participant approached the service desk where the actor asked them a number of questions Figure 1. Customers rate their experience more favorably when employees are smiling.
(Scenario I) Figure 1 supports which of the following hypotheses?
A) main effect for smiling
B) main effect for authenticity
C) interaction between smiling and authenticity
D) all of the above hypotheses are supported
Scenario I
Scenario I is based on fabricated data inspired by the following study:
Hennig-Thurau, T., Groth, M., Paul, M. & Gremler, D. D. (2006). Are all smiles created equal? How emotional contagion and emotional labor affect service relationships. Journal of Marketing, 70, 58-73.
Do Smiling Employees Improve Customer Satisfaction?
In this 2 × 2 between-subjects design, Hennig-Thurau and colleagues examined the effect of employee emotions and authenticity of the emotion on customer relations. A total of 223 undergraduate volunteers participated in this study. The participants were told they would be testing a new movie consulting service. The movie consulting service was created by the experimenters, and actors were hired to act as customer service representatives. Each participant approached the service desk where the actor asked them a number of questions
Figure 1. Customers rate their experience more favorably when employees are smiling.(Scenario I) Figure 1 supports which of the following hypotheses?
A) main effect for smiling
B) main effect for authenticity
C) interaction between smiling and authenticity
D) all of the above hypotheses are supported
Unlock Deck
Unlock for access to all 176 flashcards in this deck.
Unlock Deck
k this deck
55
Why is the examination of interactions important?
Unlock Deck
Unlock for access to all 176 flashcards in this deck.
Unlock Deck
k this deck
56
If you were presented with the following information how would you write up the analyses for a main effect? Dr. Reel conducted a two-way analysis of variable with the consumption of alcohol (10 ounces, 16 ounces, or 24 ounces) and the presence of aggression (relational or overt) as the independent variables. There were 221 participants in the study. The output provided the following information: F score was 5.7 and the effect size was .06. The output also indicated that these results were significant.
Unlock Deck
Unlock for access to all 176 flashcards in this deck.
Unlock Deck
k this deck
57
Use the following to answer questions
Scenario I
Scenario I is based on fabricated data inspired by the following study:
Hennig-Thurau, T., Groth, M., Paul, M. & Gremler, D. D. (2006). Are all smiles created equal? How emotional contagion and emotional labor affect service relationships. Journal of Marketing, 70, 58-73.
Do Smiling Employees Improve Customer Satisfaction?
In this 2 × 2 between-subjects design, Hennig-Thurau and colleagues examined the effect of employee emotions and authenticity of the emotion on customer relations. A total of 223 undergraduate volunteers participated in this study. The participants were told they would be testing a new movie consulting service. The movie consulting service was created by the experimenters, and actors were hired to act as customer service representatives. Each participant approached the service desk where the actor asked them a number of questions Figure 1. Customers rate their experience more favorably when employees are smiling.
(Scenario I) Suppose each treatment condition described in Scenario I was conducted sequentially with the first treatment tested in the fall semester, and the second in the spring semester. Following testing all treatment conditions the participants received payment for their participation in the form of a gift card. Some received a gift card to a coffee shop and others received one to a megastore. Along with their gift card, participants also received a statement debriefing them of the actual intent of the study. Which of the following presents a potential confound?
A) debriefing letter
B) gift card type
C) month of testing
D) all are confounds
Scenario I
Scenario I is based on fabricated data inspired by the following study:
Hennig-Thurau, T., Groth, M., Paul, M. & Gremler, D. D. (2006). Are all smiles created equal? How emotional contagion and emotional labor affect service relationships. Journal of Marketing, 70, 58-73.
Do Smiling Employees Improve Customer Satisfaction?
In this 2 × 2 between-subjects design, Hennig-Thurau and colleagues examined the effect of employee emotions and authenticity of the emotion on customer relations. A total of 223 undergraduate volunteers participated in this study. The participants were told they would be testing a new movie consulting service. The movie consulting service was created by the experimenters, and actors were hired to act as customer service representatives. Each participant approached the service desk where the actor asked them a number of questions
Figure 1. Customers rate their experience more favorably when employees are smiling.(Scenario I) Suppose each treatment condition described in Scenario I was conducted sequentially with the first treatment tested in the fall semester, and the second in the spring semester. Following testing all treatment conditions the participants received payment for their participation in the form of a gift card. Some received a gift card to a coffee shop and others received one to a megastore. Along with their gift card, participants also received a statement debriefing them of the actual intent of the study. Which of the following presents a potential confound?
A) debriefing letter
B) gift card type
C) month of testing
D) all are confounds
Unlock Deck
Unlock for access to all 176 flashcards in this deck.
Unlock Deck
k this deck
58
Based on the following information identify what type of factorial design is being described and how you reached your conclusion: Dr. Dowty is examining the influence of marijuana (daily, weekly, yearly) and food consumption (2000 calories, 3000 calories, or 4000 calories) in examination of metabolism changes over time.
Unlock Deck
Unlock for access to all 176 flashcards in this deck.
Unlock Deck
k this deck
59
What is a cell mean?
Unlock Deck
Unlock for access to all 176 flashcards in this deck.
Unlock Deck
k this deck
60
Use the following to answer questions
Scenario I
Scenario I is based on fabricated data inspired by the following study:
Hennig-Thurau, T., Groth, M., Paul, M. & Gremler, D. D. (2006). Are all smiles created equal? How emotional contagion and emotional labor affect service relationships. Journal of Marketing, 70, 58-73.
Do Smiling Employees Improve Customer Satisfaction?
In this 2 × 2 between-subjects design, Hennig-Thurau and colleagues examined the effect of employee emotions and authenticity of the emotion on customer relations. A total of 223 undergraduate volunteers participated in this study. The participants were told they would be testing a new movie consulting service. The movie consulting service was created by the experimenters, and actors were hired to act as customer service representatives. Each participant approached the service desk where the actor asked them a number of questions Figure 1. Customers rate their experience more favorably when employees are smiling.
(Scenario I) The researchers of Scenario I conducted a follow-up study to examine whether customer satisfaction differed based on the smiling of the employee and sex of the participant. This design can be described as:
A) a 2 × 2 design.
B) a factorial design.
C) a hybrid design.
D) all of the above.
Scenario I
Scenario I is based on fabricated data inspired by the following study:
Hennig-Thurau, T., Groth, M., Paul, M. & Gremler, D. D. (2006). Are all smiles created equal? How emotional contagion and emotional labor affect service relationships. Journal of Marketing, 70, 58-73.
Do Smiling Employees Improve Customer Satisfaction?
In this 2 × 2 between-subjects design, Hennig-Thurau and colleagues examined the effect of employee emotions and authenticity of the emotion on customer relations. A total of 223 undergraduate volunteers participated in this study. The participants were told they would be testing a new movie consulting service. The movie consulting service was created by the experimenters, and actors were hired to act as customer service representatives. Each participant approached the service desk where the actor asked them a number of questions
Figure 1. Customers rate their experience more favorably when employees are smiling.(Scenario I) The researchers of Scenario I conducted a follow-up study to examine whether customer satisfaction differed based on the smiling of the employee and sex of the participant. This design can be described as:
A) a 2 × 2 design.
B) a factorial design.
C) a hybrid design.
D) all of the above.
Unlock Deck
Unlock for access to all 176 flashcards in this deck.
Unlock Deck
k this deck
61
Use the following to answer questions
Scenario II
Scenario II is presents fabricated data inspired by the following study:
Greimel, E., Wanderer, S., Rothenberger, A., Herpertz-Dahlman, B., Konrad, K. & Roessner, V. (2011). Attentional performance in children and adolescents with tic disorder and co-occurring attention-deficit/hyperactivity disorder: new insights from a 2×2 factorial design study. Journal of Abnormal Child Psychology, 39, 819-828.
Effect of Tic Disorder and ADHD on Children's Attention
This study examined the extent to which tic disorder (TD) and attention-deficit/hyperactivity disorder (ADHD), both individually and combined, affects attention in children and adolescents. To that end, the researchers recruited children with and without TD, and children with and without ADHD. This 2 × 2 (TD × ADHD) design resulted in four conditions: children with no diagnosis (control), children with TD only, children with ADHD only, and children with TD+ADHD. The Child Behavior Checklist (CBCL) was used to quantify three components of attentional behavior: internalizing, externalizing, and attention. The results revealed that children with ADHD+TD had significantly more internalizing than those with TD alone. In addition, children with ADHD+TD as well as children with only ADHD had more externalizing than those with TD alone. Lastly, ADHD+TD children had more attention problems than those with only TD and those with only ADHD. The results of this study suggest that children with ADHD+TD have more behavioral problems than those with single diagnoses and those with no diagnoses.
(Scenario II) Suppose the results of Scenario II were that kids with ADHD had more behavioral problems when they did not have TD, and that kids with high TD had more behavioral problems when they did not have ADHD. This would indicate what type of relationship between the two independent variables?
A) marginal
B) hybrid
C) suppression
D) synergistic
Unlock Deck
Unlock for access to all 176 flashcards in this deck.
Unlock Deck
k this deck
62
Use the following to answer questions
Scenario I
Scenario I is based on fabricated data inspired by the following study:
Hennig-Thurau, T., Groth, M., Paul, M. & Gremler, D. D. (2006). Are all smiles created equal? How emotional contagion and emotional labor affect service relationships. Journal of Marketing, 70, 58-73.
Do Smiling Employees Improve Customer Satisfaction?
In this 2 × 2 between-subjects design, Hennig-Thurau and colleagues examined the effect of employee emotions and authenticity of the emotion on customer relations. A total of 223 undergraduate volunteers participated in this study. The participants were told they would be testing a new movie consulting service. The movie consulting service was created by the experimenters, and actors were hired to act as customer service representatives. Each participant approached the service desk where the actor asked them a number of questions Figure 1. Customers rate their experience more favorably when employees are smiling.
(Scenario I) Suppose the researchers in Scenario I were unable to create the fictitious movie consulting service environment. Instead, they created four written scenarios that matched each of the four treatment conditions. Participants were randomly assigned to each treatment and were asked to indicate how satisfied they think they would have been based on the scenario they read. This type of design uses:
A) nonexperimental manipulations.
B) vignettes.
C) correlation
D) experimentation
Scenario I
Scenario I is based on fabricated data inspired by the following study:
Hennig-Thurau, T., Groth, M., Paul, M. & Gremler, D. D. (2006). Are all smiles created equal? How emotional contagion and emotional labor affect service relationships. Journal of Marketing, 70, 58-73.
Do Smiling Employees Improve Customer Satisfaction?
In this 2 × 2 between-subjects design, Hennig-Thurau and colleagues examined the effect of employee emotions and authenticity of the emotion on customer relations. A total of 223 undergraduate volunteers participated in this study. The participants were told they would be testing a new movie consulting service. The movie consulting service was created by the experimenters, and actors were hired to act as customer service representatives. Each participant approached the service desk where the actor asked them a number of questions
Figure 1. Customers rate their experience more favorably when employees are smiling.(Scenario I) Suppose the researchers in Scenario I were unable to create the fictitious movie consulting service environment. Instead, they created four written scenarios that matched each of the four treatment conditions. Participants were randomly assigned to each treatment and were asked to indicate how satisfied they think they would have been based on the scenario they read. This type of design uses:
A) nonexperimental manipulations.
B) vignettes.
C) correlation
D) experimentation
Unlock Deck
Unlock for access to all 176 flashcards in this deck.
Unlock Deck
k this deck
63
In a 2010 study examining flirting competencies researchers asked 600 participants to view various videos depicting five types of pick-up lines: cute, humorous, direct compliant, direct introduction, and a third-party introduction. The results suggested:
A) participants perceived the direct and third-party introductions as the most effective.
B) participants perceived the cute and humorous pick-up lines as the most effective.
C) participants perceived the direct and third-party introduction as the least effective.
D) There was no difference among the various pick-up lines in terms of effectiveness.
Unlock Deck
Unlock for access to all 176 flashcards in this deck.
Unlock Deck
k this deck
64
A 2007 study examining the scent of male sweat in relation to cortisol levels in women found that:
A) women's cortisol levels were not influenced by exposure to male sweat.
B) humans are unable to communicate with each other via chemosignals.
C) humans are able to influence each other via chemosignals.
D) t men's cortisol levels remain stable over time.
A) women's cortisol levels were not influenced by exposure to male sweat.
B) humans are unable to communicate with each other via chemosignals.
C) humans are able to influence each other via chemosignals.
D) t men's cortisol levels remain stable over time.
Unlock Deck
Unlock for access to all 176 flashcards in this deck.
Unlock Deck
k this deck
65
In a 1986 study examining preferences for opening pick-up lines, female participants:
A) preferred innocuous pick-up lines the least and cute pick-up lines the most.
B) preferred cute pick-up lines the least and direct pick-up lines were more desirable.
C) preferred cute pick-up lines the most and direct pick-up lines the least.
D) did not have a preference in pick-up line types.
A) preferred innocuous pick-up lines the least and cute pick-up lines the most.
B) preferred cute pick-up lines the least and direct pick-up lines were more desirable.
C) preferred cute pick-up lines the most and direct pick-up lines the least.
D) did not have a preference in pick-up line types.
Unlock Deck
Unlock for access to all 176 flashcards in this deck.
Unlock Deck
k this deck
66
Use the following to answer questions
Scenario III
Scenario III is based on fabricated data inspired by the following study:
Spencer, S. J., Steele, C. M. & Quinn, D. M. (1999). Stereotype threat and women's math performance. Journal of Experimental Social Psychology, 35, 4-28.
Effect of Stereotype Threat on Math Study
The myth that men outperform women in math is widely believed by many individuals. The purpose of the study described in Scenario III was to determine if a sample of women whose math abilities equaled a sample of men would fall victim to this threat. To that end, 28 adult men and 28 adult women were administered an easy math test or a difficult math test. The performance of men and women on both the easy and hard test was quantified. A two-factor ANOVA revealed a significant main effect for test, with participants scoring significantly better on the easy test. The analyses also revealed a main effect for sex, with men performing significantly better than women. The interaction between test difficulty and sex was also statistically significant. Further inspection of the data revealed that although men and women did not differ on the easy math test, women performed significantly less well than men on the difficult math test. Given that the screening criteria for participants including earning a grade of B or better in college calculus, and scoring in at least the 85th percentile on the math subsection of the ACT, the current study indicates that women do succumb to math stereotype threat but only when the math challenge is great. The data are presented in Figure 2.
Figure 2. Although women and men performed equally on an easy version of the math test, women performed significantly worse than men on the difficult version.
(Scenario III) The study described in Scenario III examined the effect of two independent variables on math performance. Based on this design, which of the following is true?
A) There could potentially be one main effect and one interaction.
B) If a main effect is identified, then there will automatically be an interaction.
C) If there is an interaction, then there will not be a main effect.
D) The design allows for three hypotheses to be tested.
Scenario III
Scenario III is based on fabricated data inspired by the following study:
Spencer, S. J., Steele, C. M. & Quinn, D. M. (1999). Stereotype threat and women's math performance. Journal of Experimental Social Psychology, 35, 4-28.
Effect of Stereotype Threat on Math Study
The myth that men outperform women in math is widely believed by many individuals. The purpose of the study described in Scenario III was to determine if a sample of women whose math abilities equaled a sample of men would fall victim to this threat. To that end, 28 adult men and 28 adult women were administered an easy math test or a difficult math test. The performance of men and women on both the easy and hard test was quantified. A two-factor ANOVA revealed a significant main effect for test, with participants scoring significantly better on the easy test. The analyses also revealed a main effect for sex, with men performing significantly better than women. The interaction between test difficulty and sex was also statistically significant. Further inspection of the data revealed that although men and women did not differ on the easy math test, women performed significantly less well than men on the difficult math test. Given that the screening criteria for participants including earning a grade of B or better in college calculus, and scoring in at least the 85th percentile on the math subsection of the ACT, the current study indicates that women do succumb to math stereotype threat but only when the math challenge is great. The data are presented in Figure 2.
Figure 2. Although women and men performed equally on an easy version of the math test, women performed significantly worse than men on the difficult version.(Scenario III) The study described in Scenario III examined the effect of two independent variables on math performance. Based on this design, which of the following is true?
A) There could potentially be one main effect and one interaction.
B) If a main effect is identified, then there will automatically be an interaction.
C) If there is an interaction, then there will not be a main effect.
D) The design allows for three hypotheses to be tested.
Unlock Deck
Unlock for access to all 176 flashcards in this deck.
Unlock Deck
k this deck
67
A 2002 study involving sex differences in response to physical and social factors in relation to the importance of smell indicated:
A) that women considered a partner's body odor more important to attraction than actual physical appeal.
B) that women considered body odor as less important than social factors.
C) only men rated natural body odor as more important to sexual interest.
D) only women rated natural body odor as more important to sexual interest.
Unlock Deck
Unlock for access to all 176 flashcards in this deck.
Unlock Deck
k this deck
68
Use the following to answer questions
Scenario III
Scenario III is based on fabricated data inspired by the following study:
Spencer, S. J., Steele, C. M. & Quinn, D. M. (1999). Stereotype threat and women's math performance. Journal of Experimental Social Psychology, 35, 4-28.
Effect of Stereotype Threat on Math Study
The myth that men outperform women in math is widely believed by many individuals. The purpose of the study described in Scenario III was to determine if a sample of women whose math abilities equaled a sample of men would fall victim to this threat. To that end, 28 adult men and 28 adult women were administered an easy math test or a difficult math test. The performance of men and women on both the easy and hard test was quantified. A two-factor ANOVA revealed a significant main effect for test, with participants scoring significantly better on the easy test. The analyses also revealed a main effect for sex, with men performing significantly better than women. The interaction between test difficulty and sex was also statistically significant. Further inspection of the data revealed that although men and women did not differ on the easy math test, women performed significantly less well than men on the difficult math test. Given that the screening criteria for participants including earning a grade of B or better in college calculus, and scoring in at least the 85th percentile on the math subsection of the ACT, the current study indicates that women do succumb to math stereotype threat but only when the math challenge is great. The data are presented in Figure 2.
Figure 2. Although women and men performed equally on an easy version of the math test, women performed significantly worse than men on the difficult version.
(Scenario III) Suppose the researchers described in Scenario III added a third level of difficulty to the math test and added a third variable (time to complete test). Participants were given 1 hour, 2 hours, or 3 hours to complete the test. This design would now produce how many unique treatment conditions?
A) 3
B) 9
C) 18
D) 27
Scenario III
Scenario III is based on fabricated data inspired by the following study:
Spencer, S. J., Steele, C. M. & Quinn, D. M. (1999). Stereotype threat and women's math performance. Journal of Experimental Social Psychology, 35, 4-28.
Effect of Stereotype Threat on Math Study
The myth that men outperform women in math is widely believed by many individuals. The purpose of the study described in Scenario III was to determine if a sample of women whose math abilities equaled a sample of men would fall victim to this threat. To that end, 28 adult men and 28 adult women were administered an easy math test or a difficult math test. The performance of men and women on both the easy and hard test was quantified. A two-factor ANOVA revealed a significant main effect for test, with participants scoring significantly better on the easy test. The analyses also revealed a main effect for sex, with men performing significantly better than women. The interaction between test difficulty and sex was also statistically significant. Further inspection of the data revealed that although men and women did not differ on the easy math test, women performed significantly less well than men on the difficult math test. Given that the screening criteria for participants including earning a grade of B or better in college calculus, and scoring in at least the 85th percentile on the math subsection of the ACT, the current study indicates that women do succumb to math stereotype threat but only when the math challenge is great. The data are presented in Figure 2.
Figure 2. Although women and men performed equally on an easy version of the math test, women performed significantly worse than men on the difficult version.(Scenario III) Suppose the researchers described in Scenario III added a third level of difficulty to the math test and added a third variable (time to complete test). Participants were given 1 hour, 2 hours, or 3 hours to complete the test. This design would now produce how many unique treatment conditions?
A) 3
B) 9
C) 18
D) 27
Unlock Deck
Unlock for access to all 176 flashcards in this deck.
Unlock Deck
k this deck
69
In a 2003 study looking at histocompatibility complex genes, symmetry, and body scent attractiveness in men and women researchers asked 200 males and females to provide a blood sample to assess their major histocompatibility complex (MHC) gene, then to sleep a new clean T-shirt for two nights. Researchers also took photos of the males and females to document left- and right-side body symmetry. When the participants were asked about attractiveness, their answers indicated that the:
A) men preferred T-shirts from women with similar MHC.
B) men preferred T-shirts from women with dissimilar MHC.
C) women preferred T-shirts from men with similar MHC.
D) tmen preferred T-shirts from asymmetrical women.
A) men preferred T-shirts from women with similar MHC.
B) men preferred T-shirts from women with dissimilar MHC.
C) women preferred T-shirts from men with similar MHC.
D) tmen preferred T-shirts from asymmetrical women.
Unlock Deck
Unlock for access to all 176 flashcards in this deck.
Unlock Deck
k this deck
70
Use the following to answer questions
Scenario III
Scenario III is based on fabricated data inspired by the following study:
Spencer, S. J., Steele, C. M. & Quinn, D. M. (1999). Stereotype threat and women's math performance. Journal of Experimental Social Psychology, 35, 4-28.
Effect of Stereotype Threat on Math Study
The myth that men outperform women in math is widely believed by many individuals. The purpose of the study described in Scenario III was to determine if a sample of women whose math abilities equaled a sample of men would fall victim to this threat. To that end, 28 adult men and 28 adult women were administered an easy math test or a difficult math test. The performance of men and women on both the easy and hard test was quantified. A two-factor ANOVA revealed a significant main effect for test, with participants scoring significantly better on the easy test. The analyses also revealed a main effect for sex, with men performing significantly better than women. The interaction between test difficulty and sex was also statistically significant. Further inspection of the data revealed that although men and women did not differ on the easy math test, women performed significantly less well than men on the difficult math test. Given that the screening criteria for participants including earning a grade of B or better in college calculus, and scoring in at least the 85th percentile on the math subsection of the ACT, the current study indicates that women do succumb to math stereotype threat but only when the math challenge is great. The data are presented in Figure 2.
Figure 2. Although women and men performed equally on an easy version of the math test, women performed significantly worse than men on the difficult version.
(Scenario III) The study described in Scenario III used a factorial design to examine the effect of sex and test difficulty on math performance. Which of the following is NOT true of factorial designs?
A) It requires more participants and takes a greater amount of time to conduct.
B) It tests three hypotheses simultaneously.
C) It can identify a synergistic effect of the independent variables.
D) It can identify a suppression effect of the independent variables.
Scenario III
Scenario III is based on fabricated data inspired by the following study:
Spencer, S. J., Steele, C. M. & Quinn, D. M. (1999). Stereotype threat and women's math performance. Journal of Experimental Social Psychology, 35, 4-28.
Effect of Stereotype Threat on Math Study
The myth that men outperform women in math is widely believed by many individuals. The purpose of the study described in Scenario III was to determine if a sample of women whose math abilities equaled a sample of men would fall victim to this threat. To that end, 28 adult men and 28 adult women were administered an easy math test or a difficult math test. The performance of men and women on both the easy and hard test was quantified. A two-factor ANOVA revealed a significant main effect for test, with participants scoring significantly better on the easy test. The analyses also revealed a main effect for sex, with men performing significantly better than women. The interaction between test difficulty and sex was also statistically significant. Further inspection of the data revealed that although men and women did not differ on the easy math test, women performed significantly less well than men on the difficult math test. Given that the screening criteria for participants including earning a grade of B or better in college calculus, and scoring in at least the 85th percentile on the math subsection of the ACT, the current study indicates that women do succumb to math stereotype threat but only when the math challenge is great. The data are presented in Figure 2.
Figure 2. Although women and men performed equally on an easy version of the math test, women performed significantly worse than men on the difficult version.(Scenario III) The study described in Scenario III used a factorial design to examine the effect of sex and test difficulty on math performance. Which of the following is NOT true of factorial designs?
A) It requires more participants and takes a greater amount of time to conduct.
B) It tests three hypotheses simultaneously.
C) It can identify a synergistic effect of the independent variables.
D) It can identify a suppression effect of the independent variables.
Unlock Deck
Unlock for access to all 176 flashcards in this deck.
Unlock Deck
k this deck
71
Which of the following is an example of a humorous pick-up line?
A) Did it hurt when you fell from heaven?
B) Do you think that I look like Prince William?
C) Hi, my name is Marquez
D) Hi, Jamie, this is my cousin Theo.
A) Did it hurt when you fell from heaven?
B) Do you think that I look like Prince William?
C) Hi, my name is Marquez
D) Hi, Jamie, this is my cousin Theo.
Unlock Deck
Unlock for access to all 176 flashcards in this deck.
Unlock Deck
k this deck
72
Use the following to answer questions
Scenario III
Scenario III is based on fabricated data inspired by the following study:
Spencer, S. J., Steele, C. M. & Quinn, D. M. (1999). Stereotype threat and women's math performance. Journal of Experimental Social Psychology, 35, 4-28.
Effect of Stereotype Threat on Math Study
The myth that men outperform women in math is widely believed by many individuals. The purpose of the study described in Scenario III was to determine if a sample of women whose math abilities equaled a sample of men would fall victim to this threat. To that end, 28 adult men and 28 adult women were administered an easy math test or a difficult math test. The performance of men and women on both the easy and hard test was quantified. A two-factor ANOVA revealed a significant main effect for test, with participants scoring significantly better on the easy test. The analyses also revealed a main effect for sex, with men performing significantly better than women. The interaction between test difficulty and sex was also statistically significant. Further inspection of the data revealed that although men and women did not differ on the easy math test, women performed significantly less well than men on the difficult math test. Given that the screening criteria for participants including earning a grade of B or better in college calculus, and scoring in at least the 85th percentile on the math subsection of the ACT, the current study indicates that women do succumb to math stereotype threat but only when the math challenge is great. The data are presented in Figure 2.
Figure 2. Although women and men performed equally on an easy version of the math test, women performed significantly worse than men on the difficult version.
(Scenario III) According to Scenario III, there was a main effect for sex, with men performing significantly better than women. To arrive at this conclusion, the researchers would have had to examine:
A) interaction means.
B) cell means.
C) marginal means.
D) factorial means.
Scenario III
Scenario III is based on fabricated data inspired by the following study:
Spencer, S. J., Steele, C. M. & Quinn, D. M. (1999). Stereotype threat and women's math performance. Journal of Experimental Social Psychology, 35, 4-28.
Effect of Stereotype Threat on Math Study
The myth that men outperform women in math is widely believed by many individuals. The purpose of the study described in Scenario III was to determine if a sample of women whose math abilities equaled a sample of men would fall victim to this threat. To that end, 28 adult men and 28 adult women were administered an easy math test or a difficult math test. The performance of men and women on both the easy and hard test was quantified. A two-factor ANOVA revealed a significant main effect for test, with participants scoring significantly better on the easy test. The analyses also revealed a main effect for sex, with men performing significantly better than women. The interaction between test difficulty and sex was also statistically significant. Further inspection of the data revealed that although men and women did not differ on the easy math test, women performed significantly less well than men on the difficult math test. Given that the screening criteria for participants including earning a grade of B or better in college calculus, and scoring in at least the 85th percentile on the math subsection of the ACT, the current study indicates that women do succumb to math stereotype threat but only when the math challenge is great. The data are presented in Figure 2.
Figure 2. Although women and men performed equally on an easy version of the math test, women performed significantly worse than men on the difficult version.(Scenario III) According to Scenario III, there was a main effect for sex, with men performing significantly better than women. To arrive at this conclusion, the researchers would have had to examine:
A) interaction means.
B) cell means.
C) marginal means.
D) factorial means.
Unlock Deck
Unlock for access to all 176 flashcards in this deck.
Unlock Deck
k this deck
73
Use the following to answer questions
Scenario II
Scenario II is presents fabricated data inspired by the following study:
Greimel, E., Wanderer, S., Rothenberger, A., Herpertz-Dahlman, B., Konrad, K. & Roessner, V. (2011). Attentional performance in children and adolescents with tic disorder and co-occurring attention-deficit/hyperactivity disorder: new insights from a 2×2 factorial design study. Journal of Abnormal Child Psychology, 39, 819-828.
Effect of Tic Disorder and ADHD on Children's Attention
This study examined the extent to which tic disorder (TD) and attention-deficit/hyperactivity disorder (ADHD), both individually and combined, affects attention in children and adolescents. To that end, the researchers recruited children with and without TD, and children with and without ADHD. This 2 × 2 (TD × ADHD) design resulted in four conditions: children with no diagnosis (control), children with TD only, children with ADHD only, and children with TD+ADHD. The Child Behavior Checklist (CBCL) was used to quantify three components of attentional behavior: internalizing, externalizing, and attention. The results revealed that children with ADHD+TD had significantly more internalizing than those with TD alone. In addition, children with ADHD+TD as well as children with only ADHD had more externalizing than those with TD alone. Lastly, ADHD+TD children had more attention problems than those with only TD and those with only ADHD. The results of this study suggest that children with ADHD+TD have more behavioral problems than those with single diagnoses and those with no diagnoses.
(Scenario II) The fact that kids with ADHD+TD had significantly more behavioral problems than those with ADHD alone or TD alone suggests a _____ effect.
A) marginal
B) hybrid
C) suppression
D) synergistic
Unlock Deck
Unlock for access to all 176 flashcards in this deck.
Unlock Deck
k this deck
74
In a 2006 study conducted in Scotland researchers asked 200 college students to read a series of vignettes describing a man approaching a woman and using different conversation starters. The researchers found:
A) woman preferred conversation starters that were sexually suggestive.
B) women preferred conversation starters that showcased the man's humor.
C) women preferred conversation starters that provided information about the man's wealth, character, and culture.
D) women preferred conversation starters that provided information the man's wealth the least.
Unlock Deck
Unlock for access to all 176 flashcards in this deck.
Unlock Deck
k this deck
75
Use the following to answer questions
Scenario II
Scenario II is presents fabricated data inspired by the following study:
Greimel, E., Wanderer, S., Rothenberger, A., Herpertz-Dahlman, B., Konrad, K. & Roessner, V. (2011). Attentional performance in children and adolescents with tic disorder and co-occurring attention-deficit/hyperactivity disorder: new insights from a 2×2 factorial design study. Journal of Abnormal Child Psychology, 39, 819-828.
Effect of Tic Disorder and ADHD on Children's Attention
This study examined the extent to which tic disorder (TD) and attention-deficit/hyperactivity disorder (ADHD), both individually and combined, affects attention in children and adolescents. To that end, the researchers recruited children with and without TD, and children with and without ADHD. This 2 × 2 (TD × ADHD) design resulted in four conditions: children with no diagnosis (control), children with TD only, children with ADHD only, and children with TD+ADHD. The Child Behavior Checklist (CBCL) was used to quantify three components of attentional behavior: internalizing, externalizing, and attention. The results revealed that children with ADHD+TD had significantly more internalizing than those with TD alone. In addition, children with ADHD+TD as well as children with only ADHD had more externalizing than those with TD alone. Lastly, ADHD+TD children had more attention problems than those with only TD and those with only ADHD. The results of this study suggest that children with ADHD+TD have more behavioral problems than those with single diagnoses and those with no diagnoses.
(Scenario II) Which of the following may have been the results of the ANOVA performed by the authors of Scenario II?
A) F (1, 36) = 4.92, p < .05
B) F (2, 36) = 4.92, p < .05
C) F (1, 36) = 4.92, p > .05
D) F (2, 36) = 4.92, p >.05
Unlock Deck
Unlock for access to all 176 flashcards in this deck.
Unlock Deck
k this deck
76
Use the following to answer questions
Scenario II
Scenario II is presents fabricated data inspired by the following study:
Greimel, E., Wanderer, S., Rothenberger, A., Herpertz-Dahlman, B., Konrad, K. & Roessner, V. (2011). Attentional performance in children and adolescents with tic disorder and co-occurring attention-deficit/hyperactivity disorder: new insights from a 2×2 factorial design study. Journal of Abnormal Child Psychology, 39, 819-828.
Effect of Tic Disorder and ADHD on Children's Attention
This study examined the extent to which tic disorder (TD) and attention-deficit/hyperactivity disorder (ADHD), both individually and combined, affects attention in children and adolescents. To that end, the researchers recruited children with and without TD, and children with and without ADHD. This 2 × 2 (TD × ADHD) design resulted in four conditions: children with no diagnosis (control), children with TD only, children with ADHD only, and children with TD+ADHD. The Child Behavior Checklist (CBCL) was used to quantify three components of attentional behavior: internalizing, externalizing, and attention. The results revealed that children with ADHD+TD had significantly more internalizing than those with TD alone. In addition, children with ADHD+TD as well as children with only ADHD had more externalizing than those with TD alone. Lastly, ADHD+TD children had more attention problems than those with only TD and those with only ADHD. The results of this study suggest that children with ADHD+TD have more behavioral problems than those with single diagnoses and those with no diagnoses.
(Scenario II) Suppose the authors of the study described in Scenario II had categorized children into high-ADHD, low-ADHD and no-ADHD groups. Children were also categorized has having TD or not having TD. This design can be expressed as:
A) 2 × 2.
B) 3 × 3.
C) 3 × 2.
D) 3 × 4.
Unlock Deck
Unlock for access to all 176 flashcards in this deck.
Unlock Deck
k this deck
77
In a 2010 study examining the effectiveness of pick-up lines from an evolutionary perspective researchers asked 70 female college students to imagine a male approaching them and using one of three different types of pick-up lines: cute, innocuous, or direct. The female participants were told whether the male was attractive, unattractive, or were given no information regarding level of attractiveness. The female participants than rated the male on several traits. The results suggested:
A) the female participants indicated the males who used the direct or innocuous pick-up lines were less trustworthy and intelligent.
B) the female participants indicated that the males who used the cute pick-up lines were more trustworthy and intelligent.
C) the female participants indicated that they were less likely to talk to him and have a short-term relationship with him if the male was attractive regardless of the type of pick-up line he used.
D) the female participants indicated that they were less likely to talk with or have a long-term relationship with a male who attempted a cute pick-up line, regardless of the level of attractiveness for the male.
Unlock Deck
Unlock for access to all 176 flashcards in this deck.
Unlock Deck
k this deck
78
Use the following to answer questions
Scenario III
Scenario III is based on fabricated data inspired by the following study:
Spencer, S. J., Steele, C. M. & Quinn, D. M. (1999). Stereotype threat and women's math performance. Journal of Experimental Social Psychology, 35, 4-28.
Effect of Stereotype Threat on Math Study
The myth that men outperform women in math is widely believed by many individuals. The purpose of the study described in Scenario III was to determine if a sample of women whose math abilities equaled a sample of men would fall victim to this threat. To that end, 28 adult men and 28 adult women were administered an easy math test or a difficult math test. The performance of men and women on both the easy and hard test was quantified. A two-factor ANOVA revealed a significant main effect for test, with participants scoring significantly better on the easy test. The analyses also revealed a main effect for sex, with men performing significantly better than women. The interaction between test difficulty and sex was also statistically significant. Further inspection of the data revealed that although men and women did not differ on the easy math test, women performed significantly less well than men on the difficult math test. Given that the screening criteria for participants including earning a grade of B or better in college calculus, and scoring in at least the 85th percentile on the math subsection of the ACT, the current study indicates that women do succumb to math stereotype threat but only when the math challenge is great. The data are presented in Figure 2.
Figure 2. Although women and men performed equally on an easy version of the math test, women performed significantly worse than men on the difficult version.
(Scenario III) What makes the design in Scenario III a hybrid design?
A) There is more than one independent variable examined.
B) One independent variable is measured at the nominal and one is measured at the ratio level.
C) Sex is a quasi-independent variable.
D) All of the reasons are true.
Scenario III
Scenario III is based on fabricated data inspired by the following study:
Spencer, S. J., Steele, C. M. & Quinn, D. M. (1999). Stereotype threat and women's math performance. Journal of Experimental Social Psychology, 35, 4-28.
Effect of Stereotype Threat on Math Study
The myth that men outperform women in math is widely believed by many individuals. The purpose of the study described in Scenario III was to determine if a sample of women whose math abilities equaled a sample of men would fall victim to this threat. To that end, 28 adult men and 28 adult women were administered an easy math test or a difficult math test. The performance of men and women on both the easy and hard test was quantified. A two-factor ANOVA revealed a significant main effect for test, with participants scoring significantly better on the easy test. The analyses also revealed a main effect for sex, with men performing significantly better than women. The interaction between test difficulty and sex was also statistically significant. Further inspection of the data revealed that although men and women did not differ on the easy math test, women performed significantly less well than men on the difficult math test. Given that the screening criteria for participants including earning a grade of B or better in college calculus, and scoring in at least the 85th percentile on the math subsection of the ACT, the current study indicates that women do succumb to math stereotype threat but only when the math challenge is great. The data are presented in Figure 2.
Figure 2. Although women and men performed equally on an easy version of the math test, women performed significantly worse than men on the difficult version.(Scenario III) What makes the design in Scenario III a hybrid design?
A) There is more than one independent variable examined.
B) One independent variable is measured at the nominal and one is measured at the ratio level.
C) Sex is a quasi-independent variable.
D) All of the reasons are true.
Unlock Deck
Unlock for access to all 176 flashcards in this deck.
Unlock Deck
k this deck
79
Use the following to answer questions
Scenario II
Scenario II is presents fabricated data inspired by the following study:
Greimel, E., Wanderer, S., Rothenberger, A., Herpertz-Dahlman, B., Konrad, K. & Roessner, V. (2011). Attentional performance in children and adolescents with tic disorder and co-occurring attention-deficit/hyperactivity disorder: new insights from a 2×2 factorial design study. Journal of Abnormal Child Psychology, 39, 819-828.
Effect of Tic Disorder and ADHD on Children's Attention
This study examined the extent to which tic disorder (TD) and attention-deficit/hyperactivity disorder (ADHD), both individually and combined, affects attention in children and adolescents. To that end, the researchers recruited children with and without TD, and children with and without ADHD. This 2 × 2 (TD × ADHD) design resulted in four conditions: children with no diagnosis (control), children with TD only, children with ADHD only, and children with TD+ADHD. The Child Behavior Checklist (CBCL) was used to quantify three components of attentional behavior: internalizing, externalizing, and attention. The results revealed that children with ADHD+TD had significantly more internalizing than those with TD alone. In addition, children with ADHD+TD as well as children with only ADHD had more externalizing than those with TD alone. Lastly, ADHD+TD children had more attention problems than those with only TD and those with only ADHD. The results of this study suggest that children with ADHD+TD have more behavioral problems than those with single diagnoses and those with no diagnoses.
(Scenario II) If the researchers also wanted to examine whether having ADHD+TD affected boys and girls differently, they would have had to use which test to analyze the data?
A) t-test for independent means
B) one-way ANOVA
C) two-way ANOVA
D) three-way ANOVA
Unlock Deck
Unlock for access to all 176 flashcards in this deck.
Unlock Deck
k this deck
80
Which of the following is an example of a third-party introduction?
A) Did it hurt when you fell from heaven?
B) Do you think that I look like Prince William?
C) Hi, my name is Marquez.
D) Hi, Jamie, this is my cousin Theo.
A) Did it hurt when you fell from heaven?
B) Do you think that I look like Prince William?
C) Hi, my name is Marquez.
D) Hi, Jamie, this is my cousin Theo.
Unlock Deck
Unlock for access to all 176 flashcards in this deck.
Unlock Deck
k this deck
Unlock Deck
Unlock for access to all 176 flashcards in this deck.


