Deck 13: Nonparametric Statistics
Full screen (f)
Question
Question
Question
Question
Question
Question
Question
Question
Question
Question
Question
Question
Question
Question
A researcher believes that the median annual rainfall in the valley is about 36.0 inches. A randomly selected sample of 20 years had the following numbers of inches of rainfall in the valley:
19)2, 20.8, 22.5, 25.1, 27.1, 27.3, 31.0, 37.2, 37.7, 39.0, 41.1, 42.4, 45.7, 49.0, 49.8, 50.9, 53.1, 55.3, 61.2, 65.8
Test the researcher's hypothesis at α = 0.05.
You may use the following abbreviated table of critical values for the sign test (two tailed, = .05), taken from Table J in the text:
A) Reject, because the test value 6 is greater than the critical value 4.
B) Accept, because the test value 7 is greater than the critical value 4.
C) Reject, because the test value 6 is greater than the critical value 5.
D) Accept, because the test value 7 is greater than the critical value 5.
19)2, 20.8, 22.5, 25.1, 27.1, 27.3, 31.0, 37.2, 37.7, 39.0, 41.1, 42.4, 45.7, 49.0, 49.8, 50.9, 53.1, 55.3, 61.2, 65.8
Test the researcher's hypothesis at α = 0.05.
You may use the following abbreviated table of critical values for the sign test (two tailed,
= .05), taken from Table J in the text: A) Reject, because the test value 6 is greater than the critical value 4.
B) Accept, because the test value 7 is greater than the critical value 4.
C) Reject, because the test value 6 is greater than the critical value 5.
D) Accept, because the test value 7 is greater than the critical value 5.
Question
Question
Question
Question
Question
A researcher collects data on the distance between college students' high schools and their colleges. He believes that the median distance is 190 miles. A random sample of 15 students yields the following number of miles between their high schools and colleges:
15 15 20 20 35 35 45 65 75 100 125 165 185 800 2160
Test the researcher's hypothesis at α = 0.05.
You may use the following abbreviated table of critical values for the sign test (two-tailed, = .05), taken from Table J in the text:
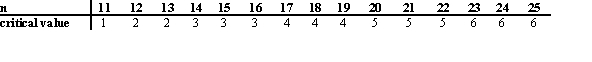
A) Reject because the test value 2 is less than the critical value 3.
B) Accept because the test value 4 is less than the critical value 13.
C) Reject because the test value 13 is more than the critical value 3.
D) Accept because the test value 190 is more than the critical value 3.
15 15 20 20 35 35 45 65 75 100 125 165 185 800 2160
Test the researcher's hypothesis at α = 0.05.
You may use the following abbreviated table of critical values for the sign test (two-tailed,
= .05), taken from Table J in the text: A) Reject because the test value 2 is less than the critical value 3.
B) Accept because the test value 4 is less than the critical value 13.
C) Reject because the test value 13 is more than the critical value 3.
D) Accept because the test value 190 is more than the critical value 3.
Question
Question
The following data was collected as part of a study examining whether there is a difference between the number of hours men and women watch television. The values represent the number of hours a subject watched television on a designated Monday night. In the process of computing the test value the data from both samples should be combined, arranged in order, and ranked according to each group. Calculate the sum of the ranks for both groups. Lower values rank ahead of higher ones. 
A) The sum of the ranks for the men is 162.5, and the sum of the ranks for the woman is 137.5.
B) The sum of the ranks for the men is 170, and the sum of the ranks for the woman is 130.
C) The sum of the ranks for the men is 130, and the sum of the ranks for the woman is 170.
D) The sum of the ranks for the men is 137.5, and the sum of the ranks for the woman is 162.5.
Question
For a specific year, the median price of natural gas was $10.65 per 1000 cubic feet. A researcher wishes to see if there is enough evidence to reject the claim. Out of 36 households, 26 paid less than $10.65 per 1000 cubic feet for natural gas. Test the claim at  .
.
. Question
Use the following to answer questions 21-24:
A landscaping company hypothesizes that the median number of lawns they mow in a weekend is 20. They tabulated the number of lawns mowed in a random sample of 14 weekends. = .05), taken from Table J in the text:
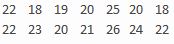
What critical value should be used for this two-tailed test at α = 0.10?
A) 1
B) 2
C) 3
D) 4
A landscaping company hypothesizes that the median number of lawns they mow in a weekend is 20. They tabulated the number of lawns mowed in a random sample of 14 weekends.
= .05), taken from Table J in the text: What critical value should be used for this two-tailed test at α = 0.10?
A) 1
B) 2
C) 3
D) 4
Question
Six second-graders tried tossing a ball into a basket ten times each. Their teacher then suggested a different way of tossing the ball, and the six students tried again. The number of successful tosses, before and after the teacher's suggestion, are shown below. 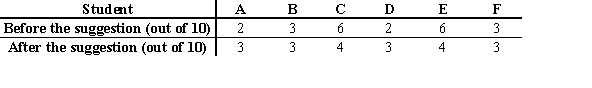 Find the sum of the positive and negative rank sums as in a Wilcoxon signed-rank test.
A) positive rank sum = 2; negative rank sum = -1
B) positive rank sum = 4; negative rank sum = -2
C) positive rank sum = 6; negative rank sum = -2
D) positive rank sum = 7; negative rank sum = -3
Find the sum of the positive and negative rank sums as in a Wilcoxon signed-rank test.A) positive rank sum = 2; negative rank sum = -1
B) positive rank sum = 4; negative rank sum = -2
C) positive rank sum = 6; negative rank sum = -2
D) positive rank sum = 7; negative rank sum = -3
Question
Use the following to answer questions 21-24:
A landscaping company hypothesizes that the median number of lawns they mow in a weekend is 20. They tabulated the number of lawns mowed in a random sample of 14 weekends. = .05), taken from Table J in the text:
State the null hypothesis.
A landscaping company hypothesizes that the median number of lawns they mow in a weekend is 20. They tabulated the number of lawns mowed in a random sample of 14 weekends.
= .05), taken from Table J in the text: State the null hypothesis.
Question
Question
Six second grade students tried tossing a ball into a basket ten times each. Their teacher then suggested a different way of tossing the ball, and the six students tried again. The number of successful tosses, before and after the teacher's suggestion, are shown below. ![<strong>Six second grade students tried tossing a ball into a basket ten times each. Their teacher then suggested a different way of tossing the ball, and the six students tried again. The number of successful tosses, before and after the teacher's suggestion, are shown below. Find the positive rank sum. [Recall, differences of zero are not ranked.]</strong> A) +9 B) +15 C) +4 D) +1 <div style=padding-top: 35px>](https://storage.examlex.com/TB1705/11eaa984_72d2_1872_97c0_0b897706e9b9_TB1705_00.jpg) Find the positive rank sum. [Recall, differences of zero are not ranked.]
Find the positive rank sum. [Recall, differences of zero are not ranked.]
A) +9
B) +15
C) +4
D) +1
Find the positive rank sum. [Recall, differences of zero are not ranked.]A) +9
B) +15
C) +4
D) +1
Question
Question
Question
Two independent samples of tall and short students are selected, and their scores on a 25 point statistics quiz are recorded as shown in the table below. What is the rank of Wilt's score? As in most exams, higher values rank ahead of lower values. 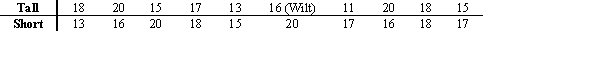
A) 6
B) 7
C) 13
D) 14
A) 6
B) 7
C) 13
D) 14
Question
It is believed that children can throw a ball further after lunch than before lunch. A researcher decided to investigate this hypothesis using the paired-sample sign test. Each of 14 children threw a ball as far as they could before and after lunch. The distances in meters are tabulated below. 
 Test the researcher's hypothesis at α = 0.05.
You may use the following abbreviated table of critical values for the sign test (one tailed, = .05), taken from Table J in the text:
A) The data supports the claim (rejects null hypothesis) because the test value 6 is more than the critical value 5.
B) The data does not support the claim (does not reject the null hypothesis) because the test value 4 is more than the critical value 3.
C) The data does not support the claim (does not reject the null hypothesis) because the test value 4 is less than the critical value 10.
D) The data does not support the claim (does not reject the null hypothesis) because the test value 6 is equal to the critical value 6.
Test the researcher's hypothesis at α = 0.05.You may use the following abbreviated table of critical values for the sign test (one tailed,
= .05), taken from Table J in the text: A) The data supports the claim (rejects null hypothesis) because the test value 6 is more than the critical value 5.
B) The data does not support the claim (does not reject the null hypothesis) because the test value 4 is more than the critical value 3.
C) The data does not support the claim (does not reject the null hypothesis) because the test value 4 is less than the critical value 10.
D) The data does not support the claim (does not reject the null hypothesis) because the test value 6 is equal to the critical value 6.
Question
Question
It was thought that hypnosis would lower a person's desire to smoke. A researcher decided to investigate this hypothesis using a paired-sample sign test in which the number of cigarettes/day smoked by subjects was recorded before and after hypnosis. Given that the critical value at α = 0.05 in a one-tailed test is 1, is there enough evidence to support the hypothesis? 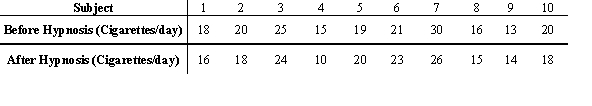
A) Since the critical value is less than the test value, there is not enough evidence to reject the null hypothesis. Consequently, the data do not support the hypothesis that hypnosis reduces smoking.
B) Since the critical value is greater than the test value, there is not enough evidence to reject the null hypothesis. Consequently, the data do not support the hypothesis that hypnosis reduces smoking.
C) Since the critical value is less than the test value, there is enough evidence to reject the null hypothesis. Consequently, the data support the hypothesis that hypnosis reduces smoking. .
D) Since the critical value is greater than the test value, there is enough evidence to reject the null hypothesis. Consequently, the data support the hypothesis that hypnosis reduces smoking.
Question
The following data was collected as part of a study examining whether there is a difference between the number of hours men and women watch television. The values represent the number of hours a subject watched television on a designated Monday night. Lower values rank ahead of higher ones.  Calculate
  ,
,  , and the z test value for the Wilcoxon rank sum test.
A)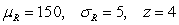
B)
C)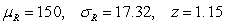
D)
Calculate , , and the z test value for the Wilcoxon rank sum test.A)
B)
C)
D)
Question
Use the following to answer questions 21-24:
A landscaping company hypothesizes that the median number of lawns they mow in a weekend is 20. They tabulated the number of lawns mowed in a random sample of 14 weekends. = .05), taken from Table J in the text:
What is the test value?
A) 3
B) 4
C) 7
D) 8
A landscaping company hypothesizes that the median number of lawns they mow in a weekend is 20. They tabulated the number of lawns mowed in a random sample of 14 weekends.
= .05), taken from Table J in the text: What is the test value?
A) 3
B) 4
C) 7
D) 8
Question
Question
Use the following to answer questions 21-24:
A landscaping company hypothesizes that the median number of lawns they mow in a weekend is 20. They tabulated the number of lawns mowed in a random sample of 14 weekends. = .05), taken from Table J in the text:
Use the test value, the critical value, and the appropriate table to decide if the landscaping company's hypothesis that they mow a median of 20 lawns per weekend valid at α = 0.10?
A) Yes. The test value is greater than the critical value, so the null hypothesis is not rejected.
B) No. The test value is greater than the critical value, so the null hypothesis is rejected.
C) Yes. The test value is less than the critical value, so the null hypothesis is not rejected
D) No. The test value is less than the critical value, so the null hypothesis is rejected
A landscaping company hypothesizes that the median number of lawns they mow in a weekend is 20. They tabulated the number of lawns mowed in a random sample of 14 weekends.
= .05), taken from Table J in the text: Use the test value, the critical value, and the appropriate table to decide if the landscaping company's hypothesis that they mow a median of 20 lawns per weekend valid at α = 0.10?
A) Yes. The test value is greater than the critical value, so the null hypothesis is not rejected.
B) No. The test value is greater than the critical value, so the null hypothesis is rejected.
C) Yes. The test value is less than the critical value, so the null hypothesis is not rejected
D) No. The test value is less than the critical value, so the null hypothesis is rejected
Question
Question
A researcher believes that the median lowest temperature for February is 30 degrees Fahrenheit. A random sample of 14 years yields the following lowest temperatures for February, in degrees Fahrenheit:
15 15 17 19 19 21 22 24 25 27 30 32 36 38
Test the researcher's hypothesis at α = 0.05.
You may use the following abbreviated table of critical values (two tailed, = .05) taken from Table J:
A) Reject the claim because the test value 4 is more than the critical value 3.
B) Do not reject the claim because the test value 3 is equal to the critical value 3.
C) Reject the claim because the test value 4 is more than the critical value 2.
D) Do not reject the claim because the test value 3 is more than the critical value 2.
15 15 17 19 19 21 22 24 25 27 30 32 36 38
Test the researcher's hypothesis at α = 0.05.
You may use the following abbreviated table of critical values (two tailed,
= .05) taken from Table J: A) Reject the claim because the test value 4 is more than the critical value 3.
B) Do not reject the claim because the test value 3 is equal to the critical value 3.
C) Reject the claim because the test value 4 is more than the critical value 2.
D) Do not reject the claim because the test value 3 is more than the critical value 2.
Question
Question
Six second grade students tried tossing a ball into a basket ten times each. Their teacher then suggested a different way of tossing the ball, and the six students tried again. The number of successful tosses, before and after the teacher's added instruction, are shown below. ![<strong>Six second grade students tried tossing a ball into a basket ten times each. Their teacher then suggested a different way of tossing the ball, and the six students tried again. The number of successful tosses, before and after the teacher's added instruction, are shown below. Find the signed rank of child A's difference. [Recall, differences of zero are not ranked.]</strong> A) +3 B) +3.5 C) +4 D) +5 <div style=padding-top: 35px>](https://storage.examlex.com/TB1705/11eaa984_72d2_b4b5_97c0_af30ea799ce5_TB1705_00.jpg) Find the signed rank of child A's difference. [Recall, differences of zero are not ranked.]
Find the signed rank of child A's difference. [Recall, differences of zero are not ranked.]
A) +3
B) +3.5
C) +4
D) +5
Find the signed rank of child A's difference. [Recall, differences of zero are not ranked.]A) +3
B) +3.5
C) +4
D) +5
Question
Question
Question
A researcher tests three different brands of 2% milk to see how many grams of fat are in each 8 ounce glass. The results are shown below. 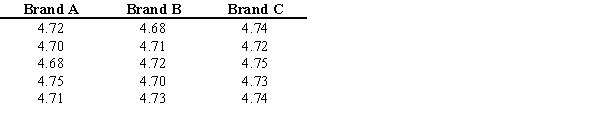 Find the sum of the ranks for Brand C.
A) 4.74
B) 23.68
C) 22.5
D) 58
Find the sum of the ranks for Brand C.A) 4.74
B) 23.68
C) 22.5
D) 58
Question
Six second grade students tried tossing a ball into a basket ten times each. Their teacher then suggested a different way of tossing the ball, and the six students tried again. The number of successful tosses, before and after the teacher's suggestion, are shown below. ![<strong>Six second grade students tried tossing a ball into a basket ten times each. Their teacher then suggested a different way of tossing the ball, and the six students tried again. The number of successful tosses, before and after the teacher's suggestion, are shown below. In the ranking of the absolute values of the differences, child C's rank is ______. [Recall, differences of zero are not ranked.]</strong> A) 4.5 B) 3.5 C) 2.5 D) 1.5 <div style=padding-top: 35px>](https://storage.examlex.com/TB1705/11eaa984_72d2_b4b6_97c0_d74ebfa942ba_TB1705_00.jpg) In the ranking of the absolute values of the differences, child C's rank is ______. [Recall, differences of zero are not ranked.]
In the ranking of the absolute values of the differences, child C's rank is ______. [Recall, differences of zero are not ranked.]
A) 4.5
B) 3.5
C) 2.5
D) 1.5
In the ranking of the absolute values of the differences, child C's rank is ______. [Recall, differences of zero are not ranked.]A) 4.5
B) 3.5
C) 2.5
D) 1.5
Question
A researcher tests three different brands of 2% milk to see how many grams of fat are in each 8 ounce glass. The results are shown below along with the sums of the ranks of the different brands. 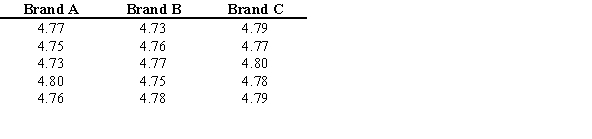 RA = 33; RB = 29; RC = 58
What is the test value for the Kruskal-Wallis test?
A) 4.94
B) -8.85
C) 9.24
D) 11.19
RA = 33; RB = 29; RC = 58What is the test value for the Kruskal-Wallis test?
A) 4.94
B) -8.85
C) 9.24
D) 11.19
Question
Question
Men and women were randomly selected to rate eight television programs on a scale of 1 to 50 with 50 being the best score. The average ratings are shown in the table below. Use the Spearman rank correlation coefficient at α = 0.05 to determine if there is a correlation between the rankings of men and women. 
Question
Eight subjects were weighed before and after a new three-week "healthy" diet. At the 0.05 level of significance, can it be concluded that a difference in weight resulted? (Weights are in pounds.) 
Question
Two students were asked to rate six different television shows on a scale from 1 to 10 points, with higher values ranking ahead of lower values. Compute the sum of squares of the difference in ranks  ,as needed in a Spearman rank correlation coefficient.
A) 0.0
B) 41.5
C) 33.5
D) 3.0
,as needed in a Spearman rank correlation coefficient. A) 0.0
B) 41.5
C) 33.5
D) 3.0
Question
Use the following to answer questions :
A professional golfer wanted to determine if there was a difference in the number of yards that golfers could hit a ball depending on the brand of driver (a particular type of club) used. Twenty-five golfers (of approximately the same ability) were divided into five groups ,and each golfer in a group hit a ball with one particular brand of driver. The number of yards they hit the ball was recorded, and a rank was assigned to each value. The data are tabulated below with the number of yards hit listed first and the ranks listed in parentheses.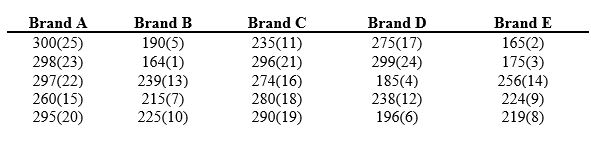
Determine the critical value for a Kruskal-Wallis test, then compare it to the test value and decide if the null hypothesis should be rejected or not.
A) The test value is higher than the critical value, so the decision is to reject the null hypothesis. There is enough evidence to support the claim that the brand of driver does affect the distance a player can hit the ball.
B) The test value is lower than the critical value, so the decision is to reject the null hypothesis. There is enough evidence to support the claim that the brand of driver does affect the distance a player can hit the ball.
C) The test value is higher than the critical value, so the decision is to not reject the null hypothesis. There is not enough evidence to support the claim that these brands of driver affect the distance a player can hit the ball.
D) The test value is lower than the critical value, so the decision is to not reject the null hypothesis. There is not enough evidence to support the claim that these brands of driver affect the distance a player can hit the ball.
Question
Use the following to answer questions :
A professional golfer wanted to determine if there was a difference in the number of yards that golfers could hit a ball depending on the brand of driver (a particular type of club) used. Twenty-five golfers (of approximately the same ability) were divided into five groups ,and each golfer in a group hit a ball with one particular brand of driver. The number of yards they hit the ball was recorded, and a rank was assigned to each value. The data are tabulated below with the number of yards hit listed first and the ranks listed in parentheses.
Compute the appropriate test value for a Kruskal-Wallis test, at α = 0.05, of the professional golfer's hypothesis.
A) 16.610
B) 13.610
C) 6.805
D) 3.805
Question
A researcher tests three different brands of 2% milk to see how many grams of fat are in each 8 ounce glass. The results are shown below. 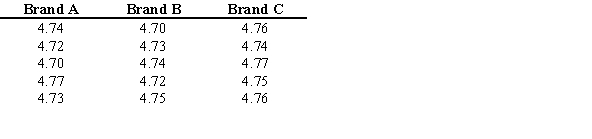 What is the critical value for a Kruskal-Wallis test of this data at α = 0.10.
A) 6.251
B) 4.605
C) 0.211
D) 0.584
What is the critical value for a Kruskal-Wallis test of this data at α = 0.10.A) 6.251
B) 4.605
C) 0.211
D) 0.584
Question
Question
Question
Two students rated, then ranked seven different television shows. The final rankings are listed in the table below. Determine the critical value needed for the Spearman rank correlation coefficient to reject the null hypothesis that the two students' rankings are not correlated at α = 0.01. 
A) 1.000
B) 0.780
C) 0.716
D) 0.929
A) 1.000
B) 0.780
C) 0.716
D) 0.929
Question
An instructor divided her class into four groups and asked them to keep track of the number of soft drinks that they consume per week. In preparation for using the Kruskal-Wallis test to support or reject an hypothesis about the behavior of the different groups, combine and rank the following data. Find the sum of the ranks for each group. 
Question
An instructor divided her class into four groups and asked them to keep track of the number of soft drinks that they consume per week. The data has been ranked and the sums determined for each group.
The sums of the ranks for the four groups is as follows: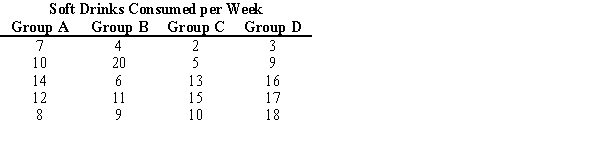 RA = 51.5 ;RB = 48.5 ;RC = 45.5 ;RD = 64.5
Complete the Kruskal-Wallis test to determine if the hypothesis that the different groups consume the same amount of soft drinks per week is valid at α = 0.05.
The sums of the ranks for the four groups is as follows:
RA = 51.5 ;RB = 48.5 ;RC = 45.5 ;RD = 64.5Complete the Kruskal-Wallis test to determine if the hypothesis that the different groups consume the same amount of soft drinks per week is valid at α = 0.05.
Question
Question
Find the critical value from Table L for the rank correlation coefficient, given sample size n = 7 and  .
.
A) 0.868
B) 0.714
C) 0.958
D) 0.584
.A) 0.868
B) 0.714
C) 0.958
D) 0.584
Question
Question
Two students were asked to rate six different television shows on a scale from 1 to 10 points, with higher values ranking ahead of lower values. The data are shown in the following table:  Which table shows the appropriate differences in the rankings needed in the computation of the Spearman rank correlation coefficient?
A)
B)
C)
D)
Which table shows the appropriate differences in the rankings needed in the computation of the Spearman rank correlation coefficient?A)
B)
C)
D)
Question

Unlock Deck
Sign up to unlock the cards in this deck!
Unlock Deck
Unlock Deck
1/63
Play
Full screen (f)
Deck 13: Nonparametric Statistics
1
If a researcher using the sign test counts 16 positive signs and 9 negative signs, the test value is ______.
A) 9
B) 7
C) -7
D) 16
A) 9
B) 7
C) -7
D) 16
A
2
Given the following data set, what is the ranking of the data value 15? Presume that lower data values rank ahead of higher data values.
16, 18, 12, 19, 15, 20, 13, 18
A) 3
B) 4
C) 5
D) 6
16, 18, 12, 19, 15, 20, 13, 18
A) 3
B) 4
C) 5
D) 6
A
3
Which of the following is not an advantage of nonparametric methods over parametric methods?
A) They can be used to test population parameters when the variable is not normally distributed.
B) They can be used when the data are nominal or ordinal.
C) They can be used to test hypotheses that do not involve population parameters.
D) They can use smaller sample sizes to give the same amount of information as their parametric counterparts.
D
4
Nonparametric methods are more sensitive than their parametric counterparts even when the assumptions of the parametric methods are met.
Unlock Deck
Unlock for access to all 63 flashcards in this deck.
Unlock Deck
k this deck
5
Many nonparametric tests involve ____________, which is the same as positioning the data values in a data array according to some scale.
Unlock Deck
Unlock for access to all 63 flashcards in this deck.
Unlock Deck
k this deck
6
What is the critical value for a one-tailed sign test, at α = 0.01 when there are 14 samples?
A) 1
B) 2
C) 3
D) 4
A) 1
B) 2
C) 3
D) 4
Unlock Deck
Unlock for access to all 63 flashcards in this deck.
Unlock Deck
k this deck
7
If a variable is normally distributed, researchers will need more data to determine the same information using parametric methods than they would using nonparametric methods. In other words, parametric methods are not as efficient as nonparametric methods.
Unlock Deck
Unlock for access to all 63 flashcards in this deck.
Unlock Deck
k this deck
8
Nonparametric statistics can be applied to populations that are not normally distributed.
Unlock Deck
Unlock for access to all 63 flashcards in this deck.
Unlock Deck
k this deck
9
The _______________ is used to test a hypothesis about a median value for a sample. It includes counting the number of values greater or less than the hypothesized median value.
Unlock Deck
Unlock for access to all 63 flashcards in this deck.
Unlock Deck
k this deck
10
A paired-sample sign test is used to test hypotheses comparing two dependent samples, such as a before and after test.
Unlock Deck
Unlock for access to all 63 flashcards in this deck.
Unlock Deck
k this deck
11
Given the following data set, what is the ranking of the data value 28? Presume that lower data values rank ahead of higher data values.
31, 28, 21, 34, 38, 33, 16, 28
A) 2
B) 2.5
C) 3
D) 3.5
31, 28, 21, 34, 38, 33, 16, 28
A) 2
B) 2.5
C) 3
D) 3.5
Unlock Deck
Unlock for access to all 63 flashcards in this deck.
Unlock Deck
k this deck
12
_______________ statistics can be used to test hypotheses that do not involve specific population parameters such as , , or p.
Unlock Deck
Unlock for access to all 63 flashcards in this deck.
Unlock Deck
k this deck
13
If a researcher is using the sign test and has 3 positive signs, 8 negative signs, and 4 zeros, what is the test value?
A) 0
B) 3
C) 8
D) 4
A) 0
B) 3
C) 8
D) 4
Unlock Deck
Unlock for access to all 63 flashcards in this deck.
Unlock Deck
k this deck
14
A researcher believes that the median annual rainfall in the valley is about 36.0 inches. A randomly selected sample of 20 years had the following numbers of inches of rainfall in the valley:
19)2, 20.8, 22.5, 25.1, 27.1, 27.3, 31.0, 37.2, 37.7, 39.0, 41.1, 42.4, 45.7, 49.0, 49.8, 50.9, 53.1, 55.3, 61.2, 65.8
Test the researcher's hypothesis at α = 0.05.
You may use the following abbreviated table of critical values for the sign test (two tailed, = .05), taken from Table J in the text:
A) Reject, because the test value 6 is greater than the critical value 4.
B) Accept, because the test value 7 is greater than the critical value 4.
C) Reject, because the test value 6 is greater than the critical value 5.
D) Accept, because the test value 7 is greater than the critical value 5.
19)2, 20.8, 22.5, 25.1, 27.1, 27.3, 31.0, 37.2, 37.7, 39.0, 41.1, 42.4, 45.7, 49.0, 49.8, 50.9, 53.1, 55.3, 61.2, 65.8
Test the researcher's hypothesis at α = 0.05.
You may use the following abbreviated table of critical values for the sign test (two tailed,
= .05), taken from Table J in the text: A) Reject, because the test value 6 is greater than the critical value 4.
B) Accept, because the test value 7 is greater than the critical value 4.
C) Reject, because the test value 6 is greater than the critical value 5.
D) Accept, because the test value 7 is greater than the critical value 5.
Unlock Deck
Unlock for access to all 63 flashcards in this deck.
Unlock Deck
k this deck
15
Given the following data set, what is the ranking of the data value 23? Presume that lower data values rank ahead of higher data values.
26, 26, 16, 29, 33, 28, 11, 23
A) 2
B) 3
C) 4
D) 5
26, 26, 16, 29, 33, 28, 11, 23
A) 2
B) 3
C) 4
D) 5
Unlock Deck
Unlock for access to all 63 flashcards in this deck.
Unlock Deck
k this deck
16
If a researcher using the sign test has 15 positive signs and 19 negative signs in a test involving 34 samples, the z test value is ________.
A) -0.69
B) 0.69
C) -0.51
D) 0.86
A) -0.69
B) 0.69
C) -0.51
D) 0.86
Unlock Deck
Unlock for access to all 63 flashcards in this deck.
Unlock Deck
k this deck
17
Nonparametric methods tend to use less information than their parametric counterparts.
Unlock Deck
Unlock for access to all 63 flashcards in this deck.
Unlock Deck
k this deck
18
What is another term for nonparametric statistics?
A) distribution-free statistics
B) inferential statistics
C) observational statistics
D) sign statistics
A) distribution-free statistics
B) inferential statistics
C) observational statistics
D) sign statistics
Unlock Deck
Unlock for access to all 63 flashcards in this deck.
Unlock Deck
k this deck
19
A researcher collects data on the distance between college students' high schools and their colleges. He believes that the median distance is 190 miles. A random sample of 15 students yields the following number of miles between their high schools and colleges:
15 15 20 20 35 35 45 65 75 100 125 165 185 800 2160
Test the researcher's hypothesis at α = 0.05.
You may use the following abbreviated table of critical values for the sign test (two-tailed, = .05), taken from Table J in the text:
A) Reject because the test value 2 is less than the critical value 3.
B) Accept because the test value 4 is less than the critical value 13.
C) Reject because the test value 13 is more than the critical value 3.
D) Accept because the test value 190 is more than the critical value 3.
15 15 20 20 35 35 45 65 75 100 125 165 185 800 2160
Test the researcher's hypothesis at α = 0.05.
You may use the following abbreviated table of critical values for the sign test (two-tailed,
= .05), taken from Table J in the text: A) Reject because the test value 2 is less than the critical value 3.
B) Accept because the test value 4 is less than the critical value 13.
C) Reject because the test value 13 is more than the critical value 3.
D) Accept because the test value 190 is more than the critical value 3.
Unlock Deck
Unlock for access to all 63 flashcards in this deck.
Unlock Deck
k this deck
20
When performing a sign test, one needs to consider whether or not data values are greater or less than a hypothesized median, as well as the magnitude of the differences between the values and the hypothesized median..
Unlock Deck
Unlock for access to all 63 flashcards in this deck.
Unlock Deck
k this deck
21
The following data was collected as part of a study examining whether there is a difference between the number of hours men and women watch television. The values represent the number of hours a subject watched television on a designated Monday night. In the process of computing the test value the data from both samples should be combined, arranged in order, and ranked according to each group. Calculate the sum of the ranks for both groups. Lower values rank ahead of higher ones.
A) The sum of the ranks for the men is 162.5, and the sum of the ranks for the woman is 137.5.
B) The sum of the ranks for the men is 170, and the sum of the ranks for the woman is 130.
C) The sum of the ranks for the men is 130, and the sum of the ranks for the woman is 170.
D) The sum of the ranks for the men is 137.5, and the sum of the ranks for the woman is 162.5.
Unlock Deck
Unlock for access to all 63 flashcards in this deck.
Unlock Deck
k this deck
22
For a specific year, the median price of natural gas was $10.65 per 1000 cubic feet. A researcher wishes to see if there is enough evidence to reject the claim. Out of 36 households, 26 paid less than $10.65 per 1000 cubic feet for natural gas. Test the claim at .
. Unlock Deck
Unlock for access to all 63 flashcards in this deck.
Unlock Deck
k this deck
23
Use the following to answer questions 21-24:
A landscaping company hypothesizes that the median number of lawns they mow in a weekend is 20. They tabulated the number of lawns mowed in a random sample of 14 weekends. = .05), taken from Table J in the text:
What critical value should be used for this two-tailed test at α = 0.10?
A) 1
B) 2
C) 3
D) 4
A landscaping company hypothesizes that the median number of lawns they mow in a weekend is 20. They tabulated the number of lawns mowed in a random sample of 14 weekends.
= .05), taken from Table J in the text: What critical value should be used for this two-tailed test at α = 0.10?
A) 1
B) 2
C) 3
D) 4
Unlock Deck
Unlock for access to all 63 flashcards in this deck.
Unlock Deck
k this deck
24
Six second-graders tried tossing a ball into a basket ten times each. Their teacher then suggested a different way of tossing the ball, and the six students tried again. The number of successful tosses, before and after the teacher's suggestion, are shown below. Find the sum of the positive and negative rank sums as in a Wilcoxon signed-rank test.
A) positive rank sum = 2; negative rank sum = -1
B) positive rank sum = 4; negative rank sum = -2
C) positive rank sum = 6; negative rank sum = -2
D) positive rank sum = 7; negative rank sum = -3
Find the sum of the positive and negative rank sums as in a Wilcoxon signed-rank test.A) positive rank sum = 2; negative rank sum = -1
B) positive rank sum = 4; negative rank sum = -2
C) positive rank sum = 6; negative rank sum = -2
D) positive rank sum = 7; negative rank sum = -3
Unlock Deck
Unlock for access to all 63 flashcards in this deck.
Unlock Deck
k this deck
25
Use the following to answer questions 21-24:
A landscaping company hypothesizes that the median number of lawns they mow in a weekend is 20. They tabulated the number of lawns mowed in a random sample of 14 weekends. = .05), taken from Table J in the text:
State the null hypothesis.
A landscaping company hypothesizes that the median number of lawns they mow in a weekend is 20. They tabulated the number of lawns mowed in a random sample of 14 weekends.
= .05), taken from Table J in the text: State the null hypothesis.
Unlock Deck
Unlock for access to all 63 flashcards in this deck.
Unlock Deck
k this deck
26
In the Wilcoxon rank sum test, if the ___________ hypothesis is true, the values in the different groups will not be ranked similarly.
Unlock Deck
Unlock for access to all 63 flashcards in this deck.
Unlock Deck
k this deck
27
Six second grade students tried tossing a ball into a basket ten times each. Their teacher then suggested a different way of tossing the ball, and the six students tried again. The number of successful tosses, before and after the teacher's suggestion, are shown below. Find the positive rank sum. [Recall, differences of zero are not ranked.]
A) +9
B) +15
C) +4
D) +1
Find the positive rank sum. [Recall, differences of zero are not ranked.]A) +9
B) +15
C) +4
D) +1
Unlock Deck
Unlock for access to all 63 flashcards in this deck.
Unlock Deck
k this deck
28
The Wilcoxon rank sum test is used to test dependent samples and the Wilcoxon signed-rank test is used for independent samples.
Unlock Deck
Unlock for access to all 63 flashcards in this deck.
Unlock Deck
k this deck
29
A random sample of 12 men and 12 women were asked to report the number of hours they watched television on a Wednesday evening. If a researcher wants to test the hypothesis that there is no difference in the amount of time spent watching television based on gender, what z-values should be used for a two-tailed Wilcoxon rank sum test, at α = 0.05?
A) z = 1.96
B) z = 2.00
C) z = 1.67
D) z = 3.00
A) z = 1.96
B) z = 2.00
C) z = 1.67
D) z = 3.00
Unlock Deck
Unlock for access to all 63 flashcards in this deck.
Unlock Deck
k this deck
30
Two independent samples of tall and short students are selected, and their scores on a 25 point statistics quiz are recorded as shown in the table below. What is the rank of Wilt's score? As in most exams, higher values rank ahead of lower values.
A) 6
B) 7
C) 13
D) 14
A) 6
B) 7
C) 13
D) 14
Unlock Deck
Unlock for access to all 63 flashcards in this deck.
Unlock Deck
k this deck
31
It is believed that children can throw a ball further after lunch than before lunch. A researcher decided to investigate this hypothesis using the paired-sample sign test. Each of 14 children threw a ball as far as they could before and after lunch. The distances in meters are tabulated below. Test the researcher's hypothesis at α = 0.05.
You may use the following abbreviated table of critical values for the sign test (one tailed, = .05), taken from Table J in the text:
A) The data supports the claim (rejects null hypothesis) because the test value 6 is more than the critical value 5.
B) The data does not support the claim (does not reject the null hypothesis) because the test value 4 is more than the critical value 3.
C) The data does not support the claim (does not reject the null hypothesis) because the test value 4 is less than the critical value 10.
D) The data does not support the claim (does not reject the null hypothesis) because the test value 6 is equal to the critical value 6.
Test the researcher's hypothesis at α = 0.05.You may use the following abbreviated table of critical values for the sign test (one tailed,
= .05), taken from Table J in the text: A) The data supports the claim (rejects null hypothesis) because the test value 6 is more than the critical value 5.
B) The data does not support the claim (does not reject the null hypothesis) because the test value 4 is more than the critical value 3.
C) The data does not support the claim (does not reject the null hypothesis) because the test value 4 is less than the critical value 10.
D) The data does not support the claim (does not reject the null hypothesis) because the test value 6 is equal to the critical value 6.
Unlock Deck
Unlock for access to all 63 flashcards in this deck.
Unlock Deck
k this deck
32
Six second grade students tried tossing a ball into a basket ten times each. Their teacher then suggested a different way of tossing the ball, and the six students tried again. The number of successful tosses, before and after the teacher's suggestion, are shown below.
Find the negative rank sum. [Recall, differences of zero are not ranked.]
A) -1
B) -1.5
C) -3.5
D) -9
Find the negative rank sum. [Recall, differences of zero are not ranked.]
A) -1
B) -1.5
C) -3.5
D) -9
Unlock Deck
Unlock for access to all 63 flashcards in this deck.
Unlock Deck
k this deck
33
It was thought that hypnosis would lower a person's desire to smoke. A researcher decided to investigate this hypothesis using a paired-sample sign test in which the number of cigarettes/day smoked by subjects was recorded before and after hypnosis. Given that the critical value at α = 0.05 in a one-tailed test is 1, is there enough evidence to support the hypothesis?
A) Since the critical value is less than the test value, there is not enough evidence to reject the null hypothesis. Consequently, the data do not support the hypothesis that hypnosis reduces smoking.
B) Since the critical value is greater than the test value, there is not enough evidence to reject the null hypothesis. Consequently, the data do not support the hypothesis that hypnosis reduces smoking.
C) Since the critical value is less than the test value, there is enough evidence to reject the null hypothesis. Consequently, the data support the hypothesis that hypnosis reduces smoking. .
D) Since the critical value is greater than the test value, there is enough evidence to reject the null hypothesis. Consequently, the data support the hypothesis that hypnosis reduces smoking.
Unlock Deck
Unlock for access to all 63 flashcards in this deck.
Unlock Deck
k this deck
34
The following data was collected as part of a study examining whether there is a difference between the number of hours men and women watch television. The values represent the number of hours a subject watched television on a designated Monday night. Lower values rank ahead of higher ones. Calculate , , and the z test value for the Wilcoxon rank sum test.
A)
B)
C)
D)
Calculate , , and the z test value for the Wilcoxon rank sum test.A)
B)
C)
D)
Unlock Deck
Unlock for access to all 63 flashcards in this deck.
Unlock Deck
k this deck
35
Use the following to answer questions 21-24:
A landscaping company hypothesizes that the median number of lawns they mow in a weekend is 20. They tabulated the number of lawns mowed in a random sample of 14 weekends. = .05), taken from Table J in the text:
What is the test value?
A) 3
B) 4
C) 7
D) 8
A landscaping company hypothesizes that the median number of lawns they mow in a weekend is 20. They tabulated the number of lawns mowed in a random sample of 14 weekends.
= .05), taken from Table J in the text: What is the test value?
A) 3
B) 4
C) 7
D) 8
Unlock Deck
Unlock for access to all 63 flashcards in this deck.
Unlock Deck
k this deck
36
Two independent sets of data are collected, the first with 16 subjects and the second with 26 subjects. Mr. X is a subject in the first data set and is associated with a value of 80. In the first set, 3 values are ranked behind 80 and 12 values are ranked ahead of it (with Mr. X being the other data value). In the second set, 10 values are ranked behind 80 and 16 values are ranked ahead of it. What is Mr. X's rank in a Wilcoxon rank sum test?
A) 12
B) 13
C) 28
D) 29
A) 12
B) 13
C) 28
D) 29
Unlock Deck
Unlock for access to all 63 flashcards in this deck.
Unlock Deck
k this deck
37
Use the following to answer questions 21-24:
A landscaping company hypothesizes that the median number of lawns they mow in a weekend is 20. They tabulated the number of lawns mowed in a random sample of 14 weekends. = .05), taken from Table J in the text:
Use the test value, the critical value, and the appropriate table to decide if the landscaping company's hypothesis that they mow a median of 20 lawns per weekend valid at α = 0.10?
A) Yes. The test value is greater than the critical value, so the null hypothesis is not rejected.
B) No. The test value is greater than the critical value, so the null hypothesis is rejected.
C) Yes. The test value is less than the critical value, so the null hypothesis is not rejected
D) No. The test value is less than the critical value, so the null hypothesis is rejected
A landscaping company hypothesizes that the median number of lawns they mow in a weekend is 20. They tabulated the number of lawns mowed in a random sample of 14 weekends.
= .05), taken from Table J in the text: Use the test value, the critical value, and the appropriate table to decide if the landscaping company's hypothesis that they mow a median of 20 lawns per weekend valid at α = 0.10?
A) Yes. The test value is greater than the critical value, so the null hypothesis is not rejected.
B) No. The test value is greater than the critical value, so the null hypothesis is rejected.
C) Yes. The test value is less than the critical value, so the null hypothesis is not rejected
D) No. The test value is less than the critical value, so the null hypothesis is rejected
Unlock Deck
Unlock for access to all 63 flashcards in this deck.
Unlock Deck
k this deck
38
A researcher needs to conduct a suitable nonparametric test to compare two dependent variables. Which of the following should he use?
A) t-test
B) Wilcoxon rank sum test
C) Wilcoxon signed-rank test
D) Kruskal-Wallis test
A) t-test
B) Wilcoxon rank sum test
C) Wilcoxon signed-rank test
D) Kruskal-Wallis test
Unlock Deck
Unlock for access to all 63 flashcards in this deck.
Unlock Deck
k this deck
39
A researcher believes that the median lowest temperature for February is 30 degrees Fahrenheit. A random sample of 14 years yields the following lowest temperatures for February, in degrees Fahrenheit:
15 15 17 19 19 21 22 24 25 27 30 32 36 38
Test the researcher's hypothesis at α = 0.05.
You may use the following abbreviated table of critical values (two tailed, = .05) taken from Table J:
A) Reject the claim because the test value 4 is more than the critical value 3.
B) Do not reject the claim because the test value 3 is equal to the critical value 3.
C) Reject the claim because the test value 4 is more than the critical value 2.
D) Do not reject the claim because the test value 3 is more than the critical value 2.
15 15 17 19 19 21 22 24 25 27 30 32 36 38
Test the researcher's hypothesis at α = 0.05.
You may use the following abbreviated table of critical values (two tailed,
= .05) taken from Table J: A) Reject the claim because the test value 4 is more than the critical value 3.
B) Do not reject the claim because the test value 3 is equal to the critical value 3.
C) Reject the claim because the test value 4 is more than the critical value 2.
D) Do not reject the claim because the test value 3 is more than the critical value 2.
Unlock Deck
Unlock for access to all 63 flashcards in this deck.
Unlock Deck
k this deck
40
If a student is interested in determining whether or not a particular score was the median grade on the statistics exam, he might ask several other students what their scores were then apply the Wilcoxon rank sum test..
Unlock Deck
Unlock for access to all 63 flashcards in this deck.
Unlock Deck
k this deck
41
Six second grade students tried tossing a ball into a basket ten times each. Their teacher then suggested a different way of tossing the ball, and the six students tried again. The number of successful tosses, before and after the teacher's added instruction, are shown below. Find the signed rank of child A's difference. [Recall, differences of zero are not ranked.]
A) +3
B) +3.5
C) +4
D) +5
Find the signed rank of child A's difference. [Recall, differences of zero are not ranked.]A) +3
B) +3.5
C) +4
D) +5
Unlock Deck
Unlock for access to all 63 flashcards in this deck.
Unlock Deck
k this deck
42
Test the following sequence for randomness at α = 0.05.
A A A A B B B A A A B B
Table of Critical Values for the Number of Runs, α = 0.05
Value of
N1
Value of n2
4
5
6
7
6
2
9
3
10
3
11
3
12
7
2
10
3
11
3
12
3
13
8
3
10
3
11
3
12
4
13
A) Do not reject the hypothesis that the sequence is random, because the test value 4 is between the critical values 3 and 11.
B) Do not reject the hypothesis that the sequence is random, because the test value 3 is between the critical values 3 and 10.
C) Do not reject the hypothesis that the sequence is random, because the test value 5 is outside the critical values 3 and 12.
D) Reject the hypothesis that the sequence is random, because the test value 3 is between the critical values 3 and 11.
Unlock Deck
Unlock for access to all 63 flashcards in this deck.
Unlock Deck
k this deck
43
Two students rated, then ranked six different television shows. The final rankings are listed in the table below. Compute the Spearman rank correlation coefficient rs for their rankings.
Show
A
B
C
D
E
F
Student 1
1
6
3
4
2
5
Student 2
3
6
1
5
4
2
A) 0.371
B) 0.628
C) 0.714
D) 0.886
Show
A
B
C
D
E
F
Student 1
1
6
3
4
2
5
Student 2
3
6
1
5
4
2
A) 0.371
B) 0.628
C) 0.714
D) 0.886
Unlock Deck
Unlock for access to all 63 flashcards in this deck.
Unlock Deck
k this deck
44
A researcher tests three different brands of 2% milk to see how many grams of fat are in each 8 ounce glass. The results are shown below. Find the sum of the ranks for Brand C.
A) 4.74
B) 23.68
C) 22.5
D) 58
Find the sum of the ranks for Brand C.A) 4.74
B) 23.68
C) 22.5
D) 58
Unlock Deck
Unlock for access to all 63 flashcards in this deck.
Unlock Deck
k this deck
45
Six second grade students tried tossing a ball into a basket ten times each. Their teacher then suggested a different way of tossing the ball, and the six students tried again. The number of successful tosses, before and after the teacher's suggestion, are shown below. In the ranking of the absolute values of the differences, child C's rank is ______. [Recall, differences of zero are not ranked.]
A) 4.5
B) 3.5
C) 2.5
D) 1.5
In the ranking of the absolute values of the differences, child C's rank is ______. [Recall, differences of zero are not ranked.]A) 4.5
B) 3.5
C) 2.5
D) 1.5
Unlock Deck
Unlock for access to all 63 flashcards in this deck.
Unlock Deck
k this deck
46
A researcher tests three different brands of 2% milk to see how many grams of fat are in each 8 ounce glass. The results are shown below along with the sums of the ranks of the different brands. RA = 33; RB = 29; RC = 58
What is the test value for the Kruskal-Wallis test?
A) 4.94
B) -8.85
C) 9.24
D) 11.19
RA = 33; RB = 29; RC = 58What is the test value for the Kruskal-Wallis test?
A) 4.94
B) -8.85
C) 9.24
D) 11.19
Unlock Deck
Unlock for access to all 63 flashcards in this deck.
Unlock Deck
k this deck
47
A researcher wished to compare the automobile color preferences of men and women. An experiment was performed recording the preferences of 10 men and 10 women. If the sum of squares of the ranking differences is equal to 11.1, compute the Spearman rank correlation coefficient rs.
A) 0.966
B) 0.933
C) 0.992
D) 0.870
A) 0.966
B) 0.933
C) 0.992
D) 0.870
Unlock Deck
Unlock for access to all 63 flashcards in this deck.
Unlock Deck
k this deck
48
Men and women were randomly selected to rate eight television programs on a scale of 1 to 50 with 50 being the best score. The average ratings are shown in the table below. Use the Spearman rank correlation coefficient at α = 0.05 to determine if there is a correlation between the rankings of men and women.
Unlock Deck
Unlock for access to all 63 flashcards in this deck.
Unlock Deck
k this deck
49
Eight subjects were weighed before and after a new three-week "healthy" diet. At the 0.05 level of significance, can it be concluded that a difference in weight resulted? (Weights are in pounds.)
Unlock Deck
Unlock for access to all 63 flashcards in this deck.
Unlock Deck
k this deck
50
Two students were asked to rate six different television shows on a scale from 1 to 10 points, with higher values ranking ahead of lower values. Compute the sum of squares of the difference in ranks ,as needed in a Spearman rank correlation coefficient.
A) 0.0
B) 41.5
C) 33.5
D) 3.0
,as needed in a Spearman rank correlation coefficient. A) 0.0
B) 41.5
C) 33.5
D) 3.0
Unlock Deck
Unlock for access to all 63 flashcards in this deck.
Unlock Deck
k this deck
51
Use the following to answer questions :
A professional golfer wanted to determine if there was a difference in the number of yards that golfers could hit a ball depending on the brand of driver (a particular type of club) used. Twenty-five golfers (of approximately the same ability) were divided into five groups ,and each golfer in a group hit a ball with one particular brand of driver. The number of yards they hit the ball was recorded, and a rank was assigned to each value. The data are tabulated below with the number of yards hit listed first and the ranks listed in parentheses.
Determine the critical value for a Kruskal-Wallis test, then compare it to the test value and decide if the null hypothesis should be rejected or not.
A) The test value is higher than the critical value, so the decision is to reject the null hypothesis. There is enough evidence to support the claim that the brand of driver does affect the distance a player can hit the ball.
B) The test value is lower than the critical value, so the decision is to reject the null hypothesis. There is enough evidence to support the claim that the brand of driver does affect the distance a player can hit the ball.
C) The test value is higher than the critical value, so the decision is to not reject the null hypothesis. There is not enough evidence to support the claim that these brands of driver affect the distance a player can hit the ball.
D) The test value is lower than the critical value, so the decision is to not reject the null hypothesis. There is not enough evidence to support the claim that these brands of driver affect the distance a player can hit the ball.
Unlock Deck
Unlock for access to all 63 flashcards in this deck.
Unlock Deck
k this deck
52
Use the following to answer questions :
A professional golfer wanted to determine if there was a difference in the number of yards that golfers could hit a ball depending on the brand of driver (a particular type of club) used. Twenty-five golfers (of approximately the same ability) were divided into five groups ,and each golfer in a group hit a ball with one particular brand of driver. The number of yards they hit the ball was recorded, and a rank was assigned to each value. The data are tabulated below with the number of yards hit listed first and the ranks listed in parentheses.
Compute the appropriate test value for a Kruskal-Wallis test, at α = 0.05, of the professional golfer's hypothesis.
A) 16.610
B) 13.610
C) 6.805
D) 3.805
Unlock Deck
Unlock for access to all 63 flashcards in this deck.
Unlock Deck
k this deck
53
A researcher tests three different brands of 2% milk to see how many grams of fat are in each 8 ounce glass. The results are shown below. What is the critical value for a Kruskal-Wallis test of this data at α = 0.10.
A) 6.251
B) 4.605
C) 0.211
D) 0.584
What is the critical value for a Kruskal-Wallis test of this data at α = 0.10.A) 6.251
B) 4.605
C) 0.211
D) 0.584
Unlock Deck
Unlock for access to all 63 flashcards in this deck.
Unlock Deck
k this deck
54
If the test value for a Wilcoxon signed-rank test ws is 15, the sample size is 12, and the one-tailed test is to be carried out at the α = 0.05 level of significance, should the null hypothesis be rejected? Use the table of critical values for the signed-rank test below.
N
One-tailed,
Α = 0.05
Α = 0.025
Α = 0.01
Two-tailed,
Α = 0.10
Α = 0.050
Α = 0
02
10
11
8
5
11
14
11
7
12
17
14
10
13
21
17
13
14
26
21
16
15
30
25
20
A) Reject null hypothesis because the test value 15 is less than the critical value 17.
B) Reject null hypothesis because the test value 15 is greater than the critical value 14
C) Do not reject null hypothesis because the test value 15 is less than the critical value 17
D) Do not reject null hypothesis because the test value 15 is greater than the critical value 14
Unlock Deck
Unlock for access to all 63 flashcards in this deck.
Unlock Deck
k this deck
55
Test the following sequence of values for randomness with respect to being above or below the median.
4 6 3 8 5 7 5 7 3 7 9 1 3 8 5
Table of Critical Values for the Number of Runs, α = 0.05
Value of
N1
Value of n2
4
5
6
7
6
2
9
3
10
3
11
3
12
7
2
10
3
11
3
12
3
13
8
3
10
3
11
3
12
4
13
A) Reject the hypothesis that the sequence is random, because the test value 8 is between the critical values 3 and 12
B) Reject the hypothesis that the sequence is random, because the test value 7 is between the critical values 3 and 11
C) Do not reject the hypothesis that the sequence is random, because the test value 8 is between the critical values 3 and 11
D) Do not reject the hypothesis that the sequence is random, because the test value 7 is between the critical values 3 and 12
Unlock Deck
Unlock for access to all 63 flashcards in this deck.
Unlock Deck
k this deck
56
Two students rated, then ranked seven different television shows. The final rankings are listed in the table below. Determine the critical value needed for the Spearman rank correlation coefficient to reject the null hypothesis that the two students' rankings are not correlated at α = 0.01.
A) 1.000
B) 0.780
C) 0.716
D) 0.929
A) 1.000
B) 0.780
C) 0.716
D) 0.929
Unlock Deck
Unlock for access to all 63 flashcards in this deck.
Unlock Deck
k this deck
57
An instructor divided her class into four groups and asked them to keep track of the number of soft drinks that they consume per week. In preparation for using the Kruskal-Wallis test to support or reject an hypothesis about the behavior of the different groups, combine and rank the following data. Find the sum of the ranks for each group.
Unlock Deck
Unlock for access to all 63 flashcards in this deck.
Unlock Deck
k this deck
58
An instructor divided her class into four groups and asked them to keep track of the number of soft drinks that they consume per week. The data has been ranked and the sums determined for each group.
The sums of the ranks for the four groups is as follows: RA = 51.5 ;RB = 48.5 ;RC = 45.5 ;RD = 64.5
Complete the Kruskal-Wallis test to determine if the hypothesis that the different groups consume the same amount of soft drinks per week is valid at α = 0.05.
The sums of the ranks for the four groups is as follows:
RA = 51.5 ;RB = 48.5 ;RC = 45.5 ;RD = 64.5Complete the Kruskal-Wallis test to determine if the hypothesis that the different groups consume the same amount of soft drinks per week is valid at α = 0.05.
Unlock Deck
Unlock for access to all 63 flashcards in this deck.
Unlock Deck
k this deck
59
A social studies teacher wanted to see whether the students exit the classroom randomly by gender. He observed the gender of students leaving the classroom in the order given below. Test for randomness at α = 0.05.
M M M M M M F F F F F F F F F M M F F F
M M M M M M F F F F F F F F F M M F F F
Unlock Deck
Unlock for access to all 63 flashcards in this deck.
Unlock Deck
k this deck
60
Find the critical value from Table L for the rank correlation coefficient, given sample size n = 7 and .
A) 0.868
B) 0.714
C) 0.958
D) 0.584
.A) 0.868
B) 0.714
C) 0.958
D) 0.584
Unlock Deck
Unlock for access to all 63 flashcards in this deck.
Unlock Deck
k this deck
61
If a panel of two judges were asked to rank 10 science fair projects, and the sum of the squares of the differences in the ranks was 49.5, then the Spearman rank correlation coefficient would be 0.70.
Unlock Deck
Unlock for access to all 63 flashcards in this deck.
Unlock Deck
k this deck
62
Two students were asked to rate six different television shows on a scale from 1 to 10 points, with higher values ranking ahead of lower values. The data are shown in the following table: Which table shows the appropriate differences in the rankings needed in the computation of the Spearman rank correlation coefficient?
A)
B)
C)
D)
Which table shows the appropriate differences in the rankings needed in the computation of the Spearman rank correlation coefficient?A)
B)
C)
D)
Unlock Deck
Unlock for access to all 63 flashcards in this deck.
Unlock Deck
k this deck
63
How many runs are in the following sequence?
A A A A B B B B B A B A
A) 5
B) 6
C) 7
D) 8
A A A A B B B B B A B A
A) 5
B) 6
C) 7
D) 8
Unlock Deck
Unlock for access to all 63 flashcards in this deck.
Unlock Deck
k this deck
Unlock Deck
Unlock for access to all 63 flashcards in this deck.


