Deck 9: Testing the Difference Between Two Means, Two Variances, and Two Proportions
Full screen (f)
Question
If the test value for the difference between the means of two large samples is 2.57 when the critical value is 1.96, what decision should be made? 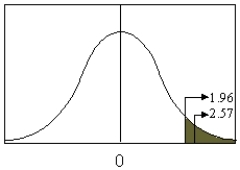
A) Reject the null hypothesis.
B) Accept the null hypothesis.
C) Reject the alternative hypothesis.
D) Accept the equality hypothesis.
A) Reject the null hypothesis.
B) Accept the null hypothesis.
C) Reject the alternative hypothesis.
D) Accept the equality hypothesis.
Question
An educational researcher is analyzing the test scores for physics students taught using two different methods - a traditional method, and a web-based self-paced method. Can he conclude, at  = .05, that the test scores in the web-based self-paced method are lower?
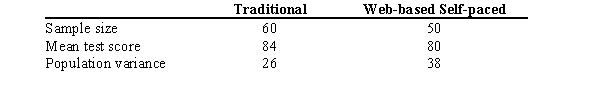
A) The data supports the claim because the test value 1.68 is greater than than the critical value 1.65.
B) The data supports the claim because the test value 1.68 is less than than the critical value 1.96.
C) The data supports the claim because the test value 3.66 is greater than than the critical value 1.96.
D) The data supports the claim because the test value 3.66 is greater than than the critical value 1.65.
= .05, that the test scores in the web-based self-paced method are lower? A) The data supports the claim because the test value 1.68 is greater than than the critical value 1.65.
B) The data supports the claim because the test value 1.68 is less than than the critical value 1.96.
C) The data supports the claim because the test value 3.66 is greater than than the critical value 1.96.
D) The data supports the claim because the test value 3.66 is greater than than the critical value 1.65.
Question
A sociologist expects the life expectancy of people in Africa is different than the life expectancy of people in Asia. The data obtained is shown in the table below. Determine the 95% confidence interval for the difference in the population means. 
A)
B)
C)
D)
A)
B)
C)
D)
Question
A pharmaceutical company is testing the effectiveness of a new drug for lowering cholesterol. As part of this trial, they wish to determine whether there is a difference between the effectiveness for women and men.
At = 0.05, what is an appropriate test value?
A) -2.60
B) 0.34
C) -1.13
D) -0.88
At
= 0.05, what is an appropriate test value? A) -2.60
B) 0.34
C) -1.13
D) -0.88
Question
The average credit card debt for a recent year was $9540. Five years earlier the average credit card debt was $8880. Assume sample sizes of 34 were used and the population standard deviations of both samples were $1069. Is there evidence to conclude that the average credit card debt has increased? Use  .
.
a. State the hypotheses.
b. Find the critical value.
c. Compute the test statistic.
d. Make the decision.
e. Summarize the results.
.a. State the hypotheses.
b. Find the critical value.
c. Compute the test statistic.
d. Make the decision.
e. Summarize the results.
Question
Question
A bond analyst is analyzing the interest rates for equivalent municipal bonds issued by two different states. At α = 0.05, is there enough evidence to conclude that there is a difference in the interest rates paid by the two states? 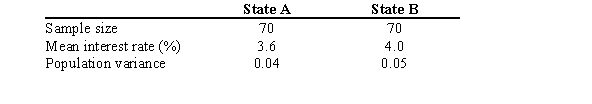
A) Yes, because the test value -11.16 is outside the critical region
B) Yes, because the test value -3.11 is outside the critical region
C) Yes, because the test value 124.44 is outside the critical region
D) No, because the test value -0.01 is inside the critical region
A) Yes, because the test value -11.16 is outside the critical region
B) Yes, because the test value -3.11 is outside the critical region
C) Yes, because the test value 124.44 is outside the critical region
D) No, because the test value -0.01 is inside the critical region
Question
The standard deviation of the difference in means of two large samples is  .
.
. Question
Question
A group of college students believes the average grades in psychology courses are different than the average grades in biology courses. The group found the average psychology grades of a sample of 8 students was 86.4 and the average biology grades of a sample of 10 students was 82.2. What is the null hypothesis for this study?
A)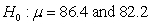
B)
C)
D)
A)
B)
C)
D)
Question
Consider the null hypothesis 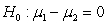 . If the confidence interval for
  does not contain 0, the null hypothesis should be rejected.
. If the confidence interval for does not contain 0, the null hypothesis should be rejected. Question
Joan has just moved into a new apartment and wants to purchase a new couch. To determine if there is a difference between the average prices of couches at two different stores, she collects the following data. Test the hypothesis that there is no difference in the average price. Use α = 0.05. 
Question
An field researcher is gathering data on the trunk diameters of mature pine and spruce trees in a certain area. The following are the results of his random sampling. Can he conclude, at  = 0.10, that the average trunk diameter of a pine tree is greater than the average diameter of a spruce tree?
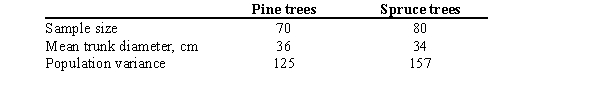
A) The data does not support the conclusion that the average pine tree trunks are larger because the test value 0.53 is less than than the critical value1.28.
B) The data does not support the conclusion that the average pine tree trunks are larger because the test value 1.03 is less than than the critical value 1.28.
C) The data does not support the conclusion that the average pine tree trunks are larger because the test value 1.03 is less than than the critical value 1.65.
D) The data does not support the conclusion that the average pine tree trunks are larger because the test value 23.05 is greater than than the critical value 1.65.
= 0.10, that the average trunk diameter of a pine tree is greater than the average diameter of a spruce tree? A) The data does not support the conclusion that the average pine tree trunks are larger because the test value 0.53 is less than than the critical value1.28.
B) The data does not support the conclusion that the average pine tree trunks are larger because the test value 1.03 is less than than the critical value 1.28.
C) The data does not support the conclusion that the average pine tree trunks are larger because the test value 1.03 is less than than the critical value 1.65.
D) The data does not support the conclusion that the average pine tree trunks are larger because the test value 23.05 is greater than than the critical value 1.65.
Question
In October, the campus bookstore asked a random set of freshmen and seniors how much they had spent on textbooks that semester. The bookstore believes that the two groups spent the same amount. What is an appropriate test value for a z test? 
A) 0.29
B) 8.35
C) 2.40
D) 1.23
A) 0.29
B) 8.35
C) 2.40
D) 1.23
Question
Use the following to answer questions
A sociologist wants to determine if the life expectancy of people in Africa is less than the life expectancy of people in Asia. The data obtained is shown in the table below.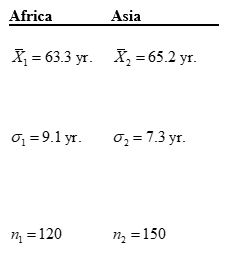
What is an appropriate null hypothesis?
A)
B)
C)
D)
A sociologist wants to determine if the life expectancy of people in Africa is less than the life expectancy of people in Asia. The data obtained is shown in the table below.
What is an appropriate null hypothesis?
A)
B)
C)
D)
Question
A conservationist suspects that the water level in Horseshoe Lake has been affected more by the current drought than the water level in Swan Lake, so he measures how far the water level is below normal each day in June. The data are normally distributed. Test his hypothesis at α = 0.01. 
Question
Use the following to answer questions
A sociologist wants to determine if the life expectancy of people in Africa is less than the life expectancy of people in Asia. The data obtained is shown in the table below.
Calculate the critical value. Use α = 0.05.
A) -1.65
B) -2.33
C) -2.58
D) -1.96
A sociologist wants to determine if the life expectancy of people in Africa is less than the life expectancy of people in Asia. The data obtained is shown in the table below.
Calculate the critical value. Use α = 0.05.
A) -1.65
B) -2.33
C) -2.58
D) -1.96
Question
If the test value for the difference between the means of two large samples is 1.43 when the critical value is 1.96, the null hypothesis should not be rejected. 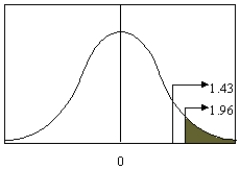
Question
Use the following to answer questions
A sociologist wants to determine if the life expectancy of people in Africa is less than the life expectancy of people in Asia. The data obtained is shown in the table below.
What is the test value?
A) -5.38
B) -3.70
C) -1.86
D) -0.47
A sociologist wants to determine if the life expectancy of people in Africa is less than the life expectancy of people in Asia. The data obtained is shown in the table below.
What is the test value?
A) -5.38
B) -3.70
C) -1.86
D) -0.47
Question
A marketing firm asked a random set of married and single men how much they were willing to spend on a vacation. Is there sufficient evidence at α = 0.05 to conclude that is there a difference in the two amounts? 
A) No, because the test value 0.23 is inside the critical region .
.
B) Yes, because the test value 4.16 is outside the critical region .
.
C) Yes, because the test value 1.60 is inside the critical region .
.
D) No, because the test value 1.60 is outside the critical region .
.
A) No, because the test value 0.23 is inside the critical region
.B) Yes, because the test value 4.16 is outside the critical region
.C) Yes, because the test value 1.60 is inside the critical region
.D) No, because the test value 1.60 is outside the critical region
. Question
Use the following to answer questions
A researcher wanted to determine if using an octane booster would increase gasoline mileage. A random sample of seven cars was selected; the cars were driven for two weeks without the booster and two weeks with the booster. Use the definitions of X1 and X2 as given in the table. Consequently, D = X1-X2.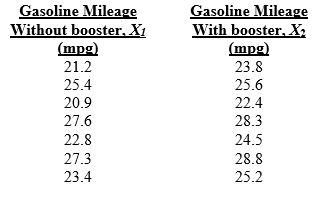
What critical value should be used at α = 0.05?
A) -2.447
B) -2.365
C) -1.943
D) -1.895
Question
Use the following to answer questions
Mauricio Cruz, a wine merchant for Cruz's Spirits Emporium, wants to determine if the average price of imported wine is less than the average price of domestic wine. He obtained the data shown in the table below.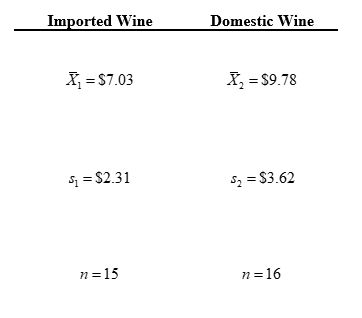
What is the critical value at α = 0.05?
A) -1.761
B) -1.753
C) -2.145
D) -2.131
Mauricio Cruz, a wine merchant for Cruz's Spirits Emporium, wants to determine if the average price of imported wine is less than the average price of domestic wine. He obtained the data shown in the table below.
What is the critical value at α = 0.05?
A) -1.761
B) -1.753
C) -2.145
D) -2.131
Question
Use the following to answer questions
Mauricio Cruz, a wine merchant for Cruz's Spirits Emporium, wants to determine if the average price of imported wine is less than the average price of domestic wine. He obtained the data shown in the table below.
What is the appropriate test value for a t test?
A) -6.49
B) -4.46
C) -2.54
D) -0.92
Mauricio Cruz, a wine merchant for Cruz's Spirits Emporium, wants to determine if the average price of imported wine is less than the average price of domestic wine. He obtained the data shown in the table below.
What is the appropriate test value for a t test?
A) -6.49
B) -4.46
C) -2.54
D) -0.92
Question
Question
The number of calories in a 12-ounce serving of randomly-selected regular and lite beers is listed. Is there sufficient evidence to conclude that the mean number of calories for lite beers is significantly less than that for the regular beers? Use  . Assume the variables are approximately normally distributed.
  a.State the hypotheses.
b. Find the critical value(s).
c. Compute the test value.
d. Make the decision.
e. Summarize the results.
. Assume the variables are approximately normally distributed. a.State the hypotheses.b. Find the critical value(s).
c. Compute the test value.
d. Make the decision.
e. Summarize the results.
Question
Question
Use the following to answer questions
A researcher wanted to determine if using an octane booster would increase gasoline mileage. A random sample of seven cars was selected; the cars were driven for two weeks without the booster and two weeks with the booster. Use the definitions of X1 and X2 as given in the table. Consequently, D = X1-X2.
State the alternative hypothesis?
A)
B)
C)
D)
Question
Use the following to answer questions
A researcher wanted to determine if using an octane booster would increase gasoline mileage. A random sample of seven cars was selected; the cars were driven for two weeks without the booster and two weeks with the booster. Use the definitions of X1 and X2 as given in the table. Consequently, D = X1-X2.
Determine the mean of the differences.
A) -1.67
B) 6.3
C) 1.67
D) -1.43
Question
Twelve dieters lost an average of 9.8 pounds in 6 weeks when given a special diet plus a "fat-blocking" herbal formula. A control group of twelve other dieters were given the same diet, but without the herbal formula, and lost an average of 8.8 pounds during the same time. The standard deviation of the "fat-blocker" sample was 2.6 and the standard deviation of the control group was 2.8. Find the 95% confidence interval for the differences of the means.
A)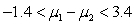
B)
C)
D)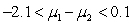
A)
B)
C)
D)
Question
In a test of the difference between the two means below, what should the test value be for a t test? 
A) -0.31
B) -0.18
C) -0.89
D) -6.98
A) -0.31
B) -0.18
C) -0.89
D) -6.98
Question
A running coach wanted to see whether runners ran faster after eating spaghetti the night before. A group of six runners was randomly chosen for this study. Each ran a 5 kilometer race after having a normal dinner the night before, and then a week later, reran the same race after having a spaghetti dinner the night before. The times for their races are shown in the table below. What test value should be used in a t test for these dependent samples? 
A) 5.07
B) 1.07
C) 2.07
D) 2.62
A) 5.07
B) 1.07
C) 2.07
D) 2.62
Question
Question
Use the following to answer questions
A researcher wanted to determine if using an octane booster would increase gasoline mileage. A random sample of seven cars was selected; the cars were driven for two weeks without the booster and two weeks with the booster. Use the definitions of X1 and X2 as given in the table. Consequently, D = X1-X2.
Compute the standard deviation of the differences.
A) 0.84
B) 0.78
C) 0.13
D) 0.11
Question
A local charity believes they receive more money from people in the River Heights neighborhood than from people in the Lakeview neighborhood. They conducted a survey of 24 people randomly selected form each neighborhood and recorded the results. At α = 0.01, is their hypothesis correct? 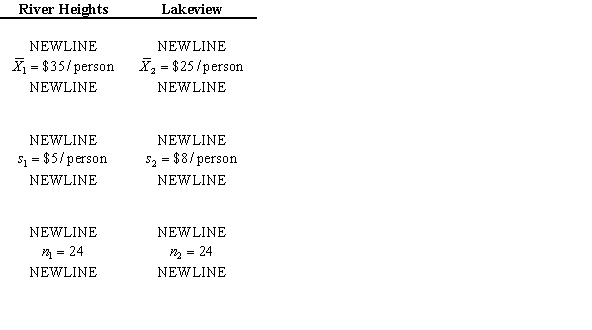
Question
A marketing firm asked a random set of married women and married men how much they were willing to spend for jewelry as a present for their spouse. Can the firm conclude, at  = 0.05, that the two groups have a different willingness to spend?
A) No, because the test value -0.65 is inside the noncritical region
B) Yes, because the test value -5.99 is outside the noncritical region
C) Yes, because the test value -0.75 is inside the noncritical region
D) No, because the test value -0.75 is outside the noncritical region
= 0.05, that the two groups have a different willingness to spend? A) No, because the test value -0.65 is inside the noncritical region
B) Yes, because the test value -5.99 is outside the noncritical region
C) Yes, because the test value -0.75 is inside the noncritical region
D) No, because the test value -0.75 is outside the noncritical region
Question
Question
Question
The Donaldson Corporation wants to hire a temporary secretary. There are two employment agencies in town, and it is believed that the average hourly wage charged by both agencies is the same. A Donaldson manager surveyed other employers in town to find what they paid the agencies for temporary secretaries. The results are summarized below. At  , test the claim that each agency charges the same hourly wage.
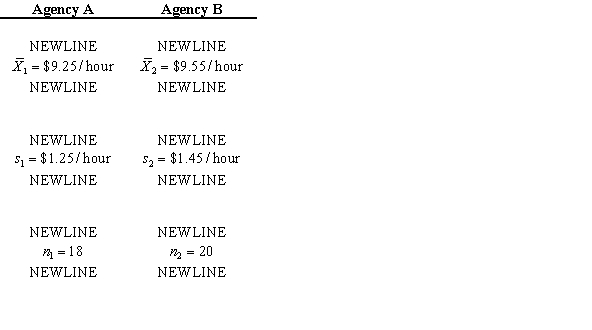
, test the claim that each agency charges the same hourly wage. Question
A reporter bought hamburgers at randomly selected stores of two different restaurant chains, and had the number of Calories in each hamburger measured. Can the reporter conclude, at  = 0.05, that the hamburgers from the two chains have a different number of Calories?
A) No, because the test value -0.23 is inside the noncritical region
B) Yes, because the test value -0.23 is inside the noncritical region
C) Yes, because the test value -2.82 is outside the noncritical region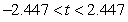
D) No, because the test value -1.29 is inside the noncritical region
= 0.05, that the hamburgers from the two chains have a different number of Calories? A) No, because the test value -0.23 is inside the noncritical region
B) Yes, because the test value -0.23 is inside the noncritical region
C) Yes, because the test value -2.82 is outside the noncritical region
D) No, because the test value -1.29 is inside the noncritical region
Question
Use the following to answer questions
Mauricio Cruz, a wine merchant for Cruz's Spirits Emporium, wants to determine if the average price of imported wine is less than the average price of domestic wine. He obtained the data shown in the table below.
What is the null hypothesis?
A)
B)
C)
D)
Mauricio Cruz, a wine merchant for Cruz's Spirits Emporium, wants to determine if the average price of imported wine is less than the average price of domestic wine. He obtained the data shown in the table below.
What is the null hypothesis?
A)
B)
C)
D)
Question
Question
Question
Find the proportion  given n = 32 and X = 8.
A) 0.75
B) 0.2
C) 0.8
D) 0.25
given n = 32 and X = 8.A) 0.75
B) 0.2
C) 0.8
D) 0.25
Question
For the samples summarized below, test the hypothesis, at α = 0.05, that the two variances are different. 
A) Reject the hypothesis because the test value 3.06 is less than the critical value 3.34.
B) Reject the hypothesis because the test value 3.06 is less than the critical value 2.61.
C) Accept the hypothesis because the test value 9.38 is greater than the critical value 3.16.
D) Reject the hypothesis because the test value 9.38 is greater than the critical value 2.74.
Question
Find  and
and  , if
, if  ,
,  ,
,  , and
, and  .
.
and , if , , , and . Question
Question
Question
Question
Question
Question
Question
Question
Question
Find  and
and  , if
, if  ,
,  ,
,  , and
, and  .
.
A)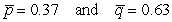
B)
C)
D)
and , if , , , and .A)
B)
C)
D)
Question
Find X, given  and n = 28.
A) 17
B) 8
C) 4
D) 11
and n = 28.A) 17
B) 8
C) 4
D) 11
Question
Question
Question
A poll found that 37% of male voters and 42% of female voters support a particular candidate. To test whether this candidate has equal levels of support between male and female voters, the alternative hypothesis should be
A) .
.
B) .
.
C) .
.
D) .
.
A)
.B)
.C)
.D)
. Question
A poll found that 47% of male voters and 50% of female voters support a particular candidate. To test whether this candidate has equal levels of support between male and female voters, the null hypothesis should be
A) .
.
B) .
.
C) .
.
D) .
.
A)
.B)
.C)
.D)
. Question
Determine the value of α as shown below in the graph of an F distribution. The degrees of freedom for the numerator are seven, and the degrees of freedom for the denominator are nine. 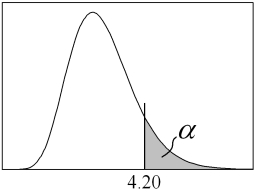
A) 0.01
B) 0.025
C) 0.05
D) 0.1
A) 0.01
B) 0.025
C) 0.05
D) 0.1
Question
Question
Question
In comparing the two standard deviations below, what test value and degrees of freedom should be used in an F test? 
A) test value = 2.33; d.f.N. = 19 and d.f.D. = 24
B) test value = 2.33; d.f.N. = 23 and d.f.D. = 18
C) test value = 5.44; d.f.N. = 24 and d.f.D. = 19
D) test value = 5.44; d.f.N. = 18 and d.f.D. = 23
A) test value = 2.33; d.f.N. = 19 and d.f.D. = 24
B) test value = 2.33; d.f.N. = 23 and d.f.D. = 18
C) test value = 5.44; d.f.N. = 24 and d.f.D. = 19
D) test value = 5.44; d.f.N. = 18 and d.f.D. = 23
Question
Question
Question
Question
Question
Question
For the samples summarized below, test the hypothesis that the two variances are equal, at α = 0.05 
A) Accept the hypothesis because the test value 8.27 is greater than the critical value 2.88.
B) Reject the hypothesis because the test value 2.87 is less than the critical value 2.77.
C) Reject the hypothesis because the test value 8.27 is greater than the critical value 2.77.
D) Accept the hypothesis because the test value 2.87 is less than the critical value 2.88.
Question
Given the variances of the two samples below, find the test value and the degrees of freedom that should be used in an F test. 
A) test value = 2.94; d.f.N. = 26 and d.f.D. = 14
B) test value = 0.58; d.f.N. = 25 and d.f.D. = 13
C) test value = 1.71; d.f.N. = 25 and d.f.D. = 13
D) test value = 1.31; d.f.N. = 26 and d.f.D. = 14
A) test value = 2.94; d.f.N. = 26 and d.f.D. = 14
B) test value = 0.58; d.f.N. = 25 and d.f.D. = 13
C) test value = 1.71; d.f.N. = 25 and d.f.D. = 13
D) test value = 1.31; d.f.N. = 26 and d.f.D. = 14

Unlock Deck
Sign up to unlock the cards in this deck!
Unlock Deck
Unlock Deck
1/70
Play
Full screen (f)
Deck 9: Testing the Difference Between Two Means, Two Variances, and Two Proportions
1
If the test value for the difference between the means of two large samples is 2.57 when the critical value is 1.96, what decision should be made?
A) Reject the null hypothesis.
B) Accept the null hypothesis.
C) Reject the alternative hypothesis.
D) Accept the equality hypothesis.
A) Reject the null hypothesis.
B) Accept the null hypothesis.
C) Reject the alternative hypothesis.
D) Accept the equality hypothesis.
A
2
An educational researcher is analyzing the test scores for physics students taught using two different methods - a traditional method, and a web-based self-paced method. Can he conclude, at = .05, that the test scores in the web-based self-paced method are lower?
A) The data supports the claim because the test value 1.68 is greater than than the critical value 1.65.
B) The data supports the claim because the test value 1.68 is less than than the critical value 1.96.
C) The data supports the claim because the test value 3.66 is greater than than the critical value 1.96.
D) The data supports the claim because the test value 3.66 is greater than than the critical value 1.65.
= .05, that the test scores in the web-based self-paced method are lower? A) The data supports the claim because the test value 1.68 is greater than than the critical value 1.65.
B) The data supports the claim because the test value 1.68 is less than than the critical value 1.96.
C) The data supports the claim because the test value 3.66 is greater than than the critical value 1.96.
D) The data supports the claim because the test value 3.66 is greater than than the critical value 1.65.
D
3
A sociologist expects the life expectancy of people in Africa is different than the life expectancy of people in Asia. The data obtained is shown in the table below. Determine the 95% confidence interval for the difference in the population means.
A)
B)
C)
D)
A)
B)
C)
D)
B
4
A pharmaceutical company is testing the effectiveness of a new drug for lowering cholesterol. As part of this trial, they wish to determine whether there is a difference between the effectiveness for women and men.
At = 0.05, what is an appropriate test value?
A) -2.60
B) 0.34
C) -1.13
D) -0.88
At
= 0.05, what is an appropriate test value? A) -2.60
B) 0.34
C) -1.13
D) -0.88
Unlock Deck
Unlock for access to all 70 flashcards in this deck.
Unlock Deck
k this deck
5
The average credit card debt for a recent year was $9540. Five years earlier the average credit card debt was $8880. Assume sample sizes of 34 were used and the population standard deviations of both samples were $1069. Is there evidence to conclude that the average credit card debt has increased? Use .
a. State the hypotheses.
b. Find the critical value.
c. Compute the test statistic.
d. Make the decision.
e. Summarize the results.
.a. State the hypotheses.
b. Find the critical value.
c. Compute the test statistic.
d. Make the decision.
e. Summarize the results.
Unlock Deck
Unlock for access to all 70 flashcards in this deck.
Unlock Deck
k this deck
6
The formula used in the z test for comparing the means from two independent populations is _______________.
Unlock Deck
Unlock for access to all 70 flashcards in this deck.
Unlock Deck
k this deck
7
A bond analyst is analyzing the interest rates for equivalent municipal bonds issued by two different states. At α = 0.05, is there enough evidence to conclude that there is a difference in the interest rates paid by the two states?
A) Yes, because the test value -11.16 is outside the critical region
B) Yes, because the test value -3.11 is outside the critical region
C) Yes, because the test value 124.44 is outside the critical region
D) No, because the test value -0.01 is inside the critical region
A) Yes, because the test value -11.16 is outside the critical region
B) Yes, because the test value -3.11 is outside the critical region
C) Yes, because the test value 124.44 is outside the critical region
D) No, because the test value -0.01 is inside the critical region
Unlock Deck
Unlock for access to all 70 flashcards in this deck.
Unlock Deck
k this deck
8
The standard deviation of the difference in means of two large samples is .
. Unlock Deck
Unlock for access to all 70 flashcards in this deck.
Unlock Deck
k this deck
9
When comparing the means of samples from two normally distributed populations, if the samples are independent and the population variances are known, the z test can be used.
Unlock Deck
Unlock for access to all 70 flashcards in this deck.
Unlock Deck
k this deck
10
A group of college students believes the average grades in psychology courses are different than the average grades in biology courses. The group found the average psychology grades of a sample of 8 students was 86.4 and the average biology grades of a sample of 10 students was 82.2. What is the null hypothesis for this study?
A)
B)
C)
D)
A)
B)
C)
D)
Unlock Deck
Unlock for access to all 70 flashcards in this deck.
Unlock Deck
k this deck
11
Consider the null hypothesis . If the confidence interval for does not contain 0, the null hypothesis should be rejected.
. If the confidence interval for does not contain 0, the null hypothesis should be rejected. Unlock Deck
Unlock for access to all 70 flashcards in this deck.
Unlock Deck
k this deck
12
Joan has just moved into a new apartment and wants to purchase a new couch. To determine if there is a difference between the average prices of couches at two different stores, she collects the following data. Test the hypothesis that there is no difference in the average price. Use α = 0.05.
Unlock Deck
Unlock for access to all 70 flashcards in this deck.
Unlock Deck
k this deck
13
An field researcher is gathering data on the trunk diameters of mature pine and spruce trees in a certain area. The following are the results of his random sampling. Can he conclude, at = 0.10, that the average trunk diameter of a pine tree is greater than the average diameter of a spruce tree?
A) The data does not support the conclusion that the average pine tree trunks are larger because the test value 0.53 is less than than the critical value1.28.
B) The data does not support the conclusion that the average pine tree trunks are larger because the test value 1.03 is less than than the critical value 1.28.
C) The data does not support the conclusion that the average pine tree trunks are larger because the test value 1.03 is less than than the critical value 1.65.
D) The data does not support the conclusion that the average pine tree trunks are larger because the test value 23.05 is greater than than the critical value 1.65.
= 0.10, that the average trunk diameter of a pine tree is greater than the average diameter of a spruce tree? A) The data does not support the conclusion that the average pine tree trunks are larger because the test value 0.53 is less than than the critical value1.28.
B) The data does not support the conclusion that the average pine tree trunks are larger because the test value 1.03 is less than than the critical value 1.28.
C) The data does not support the conclusion that the average pine tree trunks are larger because the test value 1.03 is less than than the critical value 1.65.
D) The data does not support the conclusion that the average pine tree trunks are larger because the test value 23.05 is greater than than the critical value 1.65.
Unlock Deck
Unlock for access to all 70 flashcards in this deck.
Unlock Deck
k this deck
14
In October, the campus bookstore asked a random set of freshmen and seniors how much they had spent on textbooks that semester. The bookstore believes that the two groups spent the same amount. What is an appropriate test value for a z test?
A) 0.29
B) 8.35
C) 2.40
D) 1.23
A) 0.29
B) 8.35
C) 2.40
D) 1.23
Unlock Deck
Unlock for access to all 70 flashcards in this deck.
Unlock Deck
k this deck
15
Use the following to answer questions
A sociologist wants to determine if the life expectancy of people in Africa is less than the life expectancy of people in Asia. The data obtained is shown in the table below.
What is an appropriate null hypothesis?
A)
B)
C)
D)
A sociologist wants to determine if the life expectancy of people in Africa is less than the life expectancy of people in Asia. The data obtained is shown in the table below.
What is an appropriate null hypothesis?
A)
B)
C)
D)
Unlock Deck
Unlock for access to all 70 flashcards in this deck.
Unlock Deck
k this deck
16
A conservationist suspects that the water level in Horseshoe Lake has been affected more by the current drought than the water level in Swan Lake, so he measures how far the water level is below normal each day in June. The data are normally distributed. Test his hypothesis at α = 0.01.
Unlock Deck
Unlock for access to all 70 flashcards in this deck.
Unlock Deck
k this deck
17
Use the following to answer questions
A sociologist wants to determine if the life expectancy of people in Africa is less than the life expectancy of people in Asia. The data obtained is shown in the table below.
Calculate the critical value. Use α = 0.05.
A) -1.65
B) -2.33
C) -2.58
D) -1.96
A sociologist wants to determine if the life expectancy of people in Africa is less than the life expectancy of people in Asia. The data obtained is shown in the table below.
Calculate the critical value. Use α = 0.05.
A) -1.65
B) -2.33
C) -2.58
D) -1.96
Unlock Deck
Unlock for access to all 70 flashcards in this deck.
Unlock Deck
k this deck
18
If the test value for the difference between the means of two large samples is 1.43 when the critical value is 1.96, the null hypothesis should not be rejected.
Unlock Deck
Unlock for access to all 70 flashcards in this deck.
Unlock Deck
k this deck
19
Use the following to answer questions
A sociologist wants to determine if the life expectancy of people in Africa is less than the life expectancy of people in Asia. The data obtained is shown in the table below.
What is the test value?
A) -5.38
B) -3.70
C) -1.86
D) -0.47
A sociologist wants to determine if the life expectancy of people in Africa is less than the life expectancy of people in Asia. The data obtained is shown in the table below.
What is the test value?
A) -5.38
B) -3.70
C) -1.86
D) -0.47
Unlock Deck
Unlock for access to all 70 flashcards in this deck.
Unlock Deck
k this deck
20
A marketing firm asked a random set of married and single men how much they were willing to spend on a vacation. Is there sufficient evidence at α = 0.05 to conclude that is there a difference in the two amounts?
A) No, because the test value 0.23 is inside the critical region .
B) Yes, because the test value 4.16 is outside the critical region .
C) Yes, because the test value 1.60 is inside the critical region .
D) No, because the test value 1.60 is outside the critical region .
A) No, because the test value 0.23 is inside the critical region
.B) Yes, because the test value 4.16 is outside the critical region
.C) Yes, because the test value 1.60 is inside the critical region
.D) No, because the test value 1.60 is outside the critical region
. Unlock Deck
Unlock for access to all 70 flashcards in this deck.
Unlock Deck
k this deck
21
Use the following to answer questions
A researcher wanted to determine if using an octane booster would increase gasoline mileage. A random sample of seven cars was selected; the cars were driven for two weeks without the booster and two weeks with the booster. Use the definitions of X1 and X2 as given in the table. Consequently, D = X1-X2.
What critical value should be used at α = 0.05?
A) -2.447
B) -2.365
C) -1.943
D) -1.895
Unlock Deck
Unlock for access to all 70 flashcards in this deck.
Unlock Deck
k this deck
22
Use the following to answer questions
Mauricio Cruz, a wine merchant for Cruz's Spirits Emporium, wants to determine if the average price of imported wine is less than the average price of domestic wine. He obtained the data shown in the table below.
What is the critical value at α = 0.05?
A) -1.761
B) -1.753
C) -2.145
D) -2.131
Mauricio Cruz, a wine merchant for Cruz's Spirits Emporium, wants to determine if the average price of imported wine is less than the average price of domestic wine. He obtained the data shown in the table below.
What is the critical value at α = 0.05?
A) -1.761
B) -1.753
C) -2.145
D) -2.131
Unlock Deck
Unlock for access to all 70 flashcards in this deck.
Unlock Deck
k this deck
23
Use the following to answer questions
Mauricio Cruz, a wine merchant for Cruz's Spirits Emporium, wants to determine if the average price of imported wine is less than the average price of domestic wine. He obtained the data shown in the table below.
What is the appropriate test value for a t test?
A) -6.49
B) -4.46
C) -2.54
D) -0.92
Mauricio Cruz, a wine merchant for Cruz's Spirits Emporium, wants to determine if the average price of imported wine is less than the average price of domestic wine. He obtained the data shown in the table below.
What is the appropriate test value for a t test?
A) -6.49
B) -4.46
C) -2.54
D) -0.92
Unlock Deck
Unlock for access to all 70 flashcards in this deck.
Unlock Deck
k this deck
24
A medical researcher is interested in whether patients' left arms or right arms are longer. If 10 patients participate in this study, how many degrees of freedom should the researcher use when finding the critical value for a t test?
A) 9
B) 10
C) 18
D) 19
A) 9
B) 10
C) 18
D) 19
Unlock Deck
Unlock for access to all 70 flashcards in this deck.
Unlock Deck
k this deck
25
The number of calories in a 12-ounce serving of randomly-selected regular and lite beers is listed. Is there sufficient evidence to conclude that the mean number of calories for lite beers is significantly less than that for the regular beers? Use . Assume the variables are approximately normally distributed. a.State the hypotheses.
b. Find the critical value(s).
c. Compute the test value.
d. Make the decision.
e. Summarize the results.
. Assume the variables are approximately normally distributed. a.State the hypotheses.b. Find the critical value(s).
c. Compute the test value.
d. Make the decision.
e. Summarize the results.
Unlock Deck
Unlock for access to all 70 flashcards in this deck.
Unlock Deck
k this deck
26
Samples are independent when they are not related.
Unlock Deck
Unlock for access to all 70 flashcards in this deck.
Unlock Deck
k this deck
27
Use the following to answer questions
A researcher wanted to determine if using an octane booster would increase gasoline mileage. A random sample of seven cars was selected; the cars were driven for two weeks without the booster and two weeks with the booster. Use the definitions of X1 and X2 as given in the table. Consequently, D = X1-X2.
State the alternative hypothesis?
A)
B)
C)
D)
Unlock Deck
Unlock for access to all 70 flashcards in this deck.
Unlock Deck
k this deck
28
Use the following to answer questions
A researcher wanted to determine if using an octane booster would increase gasoline mileage. A random sample of seven cars was selected; the cars were driven for two weeks without the booster and two weeks with the booster. Use the definitions of X1 and X2 as given in the table. Consequently, D = X1-X2.
Determine the mean of the differences.
A) -1.67
B) 6.3
C) 1.67
D) -1.43
Unlock Deck
Unlock for access to all 70 flashcards in this deck.
Unlock Deck
k this deck
29
Twelve dieters lost an average of 9.8 pounds in 6 weeks when given a special diet plus a "fat-blocking" herbal formula. A control group of twelve other dieters were given the same diet, but without the herbal formula, and lost an average of 8.8 pounds during the same time. The standard deviation of the "fat-blocker" sample was 2.6 and the standard deviation of the control group was 2.8. Find the 95% confidence interval for the differences of the means.
A)
B)
C)
D)
A)
B)
C)
D)
Unlock Deck
Unlock for access to all 70 flashcards in this deck.
Unlock Deck
k this deck
30
In a test of the difference between the two means below, what should the test value be for a t test?
A) -0.31
B) -0.18
C) -0.89
D) -6.98
A) -0.31
B) -0.18
C) -0.89
D) -6.98
Unlock Deck
Unlock for access to all 70 flashcards in this deck.
Unlock Deck
k this deck
31
A running coach wanted to see whether runners ran faster after eating spaghetti the night before. A group of six runners was randomly chosen for this study. Each ran a 5 kilometer race after having a normal dinner the night before, and then a week later, reran the same race after having a spaghetti dinner the night before. The times for their races are shown in the table below. What test value should be used in a t test for these dependent samples?
A) 5.07
B) 1.07
C) 2.07
D) 2.62
A) 5.07
B) 1.07
C) 2.07
D) 2.62
Unlock Deck
Unlock for access to all 70 flashcards in this deck.
Unlock Deck
k this deck
32
When the subjects are paired or matched in some way, samples are considered to be _______________.
Unlock Deck
Unlock for access to all 70 flashcards in this deck.
Unlock Deck
k this deck
33
Use the following to answer questions
A researcher wanted to determine if using an octane booster would increase gasoline mileage. A random sample of seven cars was selected; the cars were driven for two weeks without the booster and two weeks with the booster. Use the definitions of X1 and X2 as given in the table. Consequently, D = X1-X2.
Compute the standard deviation of the differences.
A) 0.84
B) 0.78
C) 0.13
D) 0.11
Unlock Deck
Unlock for access to all 70 flashcards in this deck.
Unlock Deck
k this deck
34
A local charity believes they receive more money from people in the River Heights neighborhood than from people in the Lakeview neighborhood. They conducted a survey of 24 people randomly selected form each neighborhood and recorded the results. At α = 0.01, is their hypothesis correct?
Unlock Deck
Unlock for access to all 70 flashcards in this deck.
Unlock Deck
k this deck
35
A marketing firm asked a random set of married women and married men how much they were willing to spend for jewelry as a present for their spouse. Can the firm conclude, at = 0.05, that the two groups have a different willingness to spend?
A) No, because the test value -0.65 is inside the noncritical region
B) Yes, because the test value -5.99 is outside the noncritical region
C) Yes, because the test value -0.75 is inside the noncritical region
D) No, because the test value -0.75 is outside the noncritical region
= 0.05, that the two groups have a different willingness to spend? A) No, because the test value -0.65 is inside the noncritical region
B) Yes, because the test value -5.99 is outside the noncritical region
C) Yes, because the test value -0.75 is inside the noncritical region
D) No, because the test value -0.75 is outside the noncritical region
Unlock Deck
Unlock for access to all 70 flashcards in this deck.
Unlock Deck
k this deck
36
Which of the following represent dependent samples.
I) Life spans of pairs of siblings.
Ii) Life spans of randomly-selected pairs of people
Iii) Life spans of pairs of mothers and daughters
A) i
B) i and iii
C) iii
D) i, ii, and iii
I) Life spans of pairs of siblings.
Ii) Life spans of randomly-selected pairs of people
Iii) Life spans of pairs of mothers and daughters
A) i
B) i and iii
C) iii
D) i, ii, and iii
Unlock Deck
Unlock for access to all 70 flashcards in this deck.
Unlock Deck
k this deck
37
When subjects are matched according to one variable, the matching process does not eliminate the influence of other variables.
Unlock Deck
Unlock for access to all 70 flashcards in this deck.
Unlock Deck
k this deck
38
The Donaldson Corporation wants to hire a temporary secretary. There are two employment agencies in town, and it is believed that the average hourly wage charged by both agencies is the same. A Donaldson manager surveyed other employers in town to find what they paid the agencies for temporary secretaries. The results are summarized below. At , test the claim that each agency charges the same hourly wage.
, test the claim that each agency charges the same hourly wage. Unlock Deck
Unlock for access to all 70 flashcards in this deck.
Unlock Deck
k this deck
39
A reporter bought hamburgers at randomly selected stores of two different restaurant chains, and had the number of Calories in each hamburger measured. Can the reporter conclude, at = 0.05, that the hamburgers from the two chains have a different number of Calories?
A) No, because the test value -0.23 is inside the noncritical region
B) Yes, because the test value -0.23 is inside the noncritical region
C) Yes, because the test value -2.82 is outside the noncritical region
D) No, because the test value -1.29 is inside the noncritical region
= 0.05, that the hamburgers from the two chains have a different number of Calories? A) No, because the test value -0.23 is inside the noncritical region
B) Yes, because the test value -0.23 is inside the noncritical region
C) Yes, because the test value -2.82 is outside the noncritical region
D) No, because the test value -1.29 is inside the noncritical region
Unlock Deck
Unlock for access to all 70 flashcards in this deck.
Unlock Deck
k this deck
40
Use the following to answer questions
Mauricio Cruz, a wine merchant for Cruz's Spirits Emporium, wants to determine if the average price of imported wine is less than the average price of domestic wine. He obtained the data shown in the table below.
What is the null hypothesis?
A)
B)
C)
D)
Mauricio Cruz, a wine merchant for Cruz's Spirits Emporium, wants to determine if the average price of imported wine is less than the average price of domestic wine. He obtained the data shown in the table below.
What is the null hypothesis?
A)
B)
C)
D)
Unlock Deck
Unlock for access to all 70 flashcards in this deck.
Unlock Deck
k this deck
41
Two groups were polled about their attitudes towards capital punishment. In one group 30 out of 100 favored capital punishment, and in the other group 40 out of 80 favored capital punishment. Calculate an appropriate test value test the hypothesis that the population proportions are the same.
A) -2.73
B) -37.40
C) -0.20
D) -13.68
A) -2.73
B) -37.40
C) -0.20
D) -13.68
Unlock Deck
Unlock for access to all 70 flashcards in this deck.
Unlock Deck
k this deck
42
Many elementary school students in a school district currently have ear infections. A random sample of children in two different schools found that 17 of 50 at one school and 15 of 30 at the other have ear infections. At the 0.05 level of significance, is there sufficient evidence to support the claim that a difference exists between the proportions of students who have ear infections at the two schools?
A) Yes, because the test value -12.50 is outside the noncritical region -1.96 < z < 1.96.
B) No, because the test value -1.41 is inside the noncritical region -1.96 < z < 1.96.
C) No, because the test value -1.85 is inside the noncritical region -1.96 < z < 1.96.
D) Yes, because the test value -6.96 is outside the noncritical region -1.96 < z < 1.96.
Unlock Deck
Unlock for access to all 70 flashcards in this deck.
Unlock Deck
k this deck
43
Find the proportion given n = 32 and X = 8.
A) 0.75
B) 0.2
C) 0.8
D) 0.25
given n = 32 and X = 8.A) 0.75
B) 0.2
C) 0.8
D) 0.25
Unlock Deck
Unlock for access to all 70 flashcards in this deck.
Unlock Deck
k this deck
44
For the samples summarized below, test the hypothesis, at α = 0.05, that the two variances are different.
A) Reject the hypothesis because the test value 3.06 is less than the critical value 3.34.
B) Reject the hypothesis because the test value 3.06 is less than the critical value 2.61.
C) Accept the hypothesis because the test value 9.38 is greater than the critical value 3.16.
D) Reject the hypothesis because the test value 9.38 is greater than the critical value 2.74.
Unlock Deck
Unlock for access to all 70 flashcards in this deck.
Unlock Deck
k this deck
45
Find and , if , , , and .
and , if , , , and . Unlock Deck
Unlock for access to all 70 flashcards in this deck.
Unlock Deck
k this deck
46
One uses a t test when comparing two variances or standard deviations.
Unlock Deck
Unlock for access to all 70 flashcards in this deck.
Unlock Deck
k this deck
47
The critical value for a left-tailed t test for dependent samples is ___________ when there are seven degrees of freedom and α = 0.025.
Unlock Deck
Unlock for access to all 70 flashcards in this deck.
Unlock Deck
k this deck
48
When finding the test value for an F test, the smaller of the two variances should be placed in the numerator.
Unlock Deck
Unlock for access to all 70 flashcards in this deck.
Unlock Deck
k this deck
49
In the F distribution the mean value of F is approximately equal to __________.
Unlock Deck
Unlock for access to all 70 flashcards in this deck.
Unlock Deck
k this deck
50
The formula of the test value to be used in a t test for dependent samples is ______________.
Unlock Deck
Unlock for access to all 70 flashcards in this deck.
Unlock Deck
k this deck
51
In the F distribution, values of F cannot be negative, because variances are always positive or zero.
Unlock Deck
Unlock for access to all 70 flashcards in this deck.
Unlock Deck
k this deck
52
To determine whether two sample variances are equal, a researcher can use a(n) __________.
Unlock Deck
Unlock for access to all 70 flashcards in this deck.
Unlock Deck
k this deck
53
A recent survey reported that in a sample of 300 students who attend two-year colleges, 105 work at least 20 hours per week. Additionally, in a sample of 225 students attending private four-year universities, only 20 students work at least 20 hours per week. What is the test value for a test of the difference between these two population proportions?
A) 6.95
B) 7.61
C) 2.38
D) 4.18
A) 6.95
B) 7.61
C) 2.38
D) 4.18
Unlock Deck
Unlock for access to all 70 flashcards in this deck.
Unlock Deck
k this deck
54
Find and , if , , , and .
A)
B)
C)
D)
and , if , , , and .A)
B)
C)
D)
Unlock Deck
Unlock for access to all 70 flashcards in this deck.
Unlock Deck
k this deck
55
Find X, given and n = 28.
A) 17
B) 8
C) 4
D) 11
and n = 28.A) 17
B) 8
C) 4
D) 11
Unlock Deck
Unlock for access to all 70 flashcards in this deck.
Unlock Deck
k this deck
56
68% of students at a university live on campus. A random sample found that 24 of 40 male students and 43 of 55 of female students live on campus. At the 0.05 level of significance, is there sufficient evidence to support the claim that a difference exists between the proportions of male and female students who live on campus?
A) Yes, because the test value -20.26 is outside the noncritical region -1.96 < z < 1.96.
B) No, because the test value -0.96 is inside the noncritical region -1.96 < z < 1.96.
C) Yes, because the test value -4.21 is outside the noncritical region -1.96 < z < 1.96.
D) No, because the test value -1.92 is inside the noncritical region -1.96 < z < 1.96.
Unlock Deck
Unlock for access to all 70 flashcards in this deck.
Unlock Deck
k this deck
57
A study of cats and dogs found that 39 of 60 cats and 21 of 50 dogs slept more than 10 hours per day. At the 0.05 level of significance, is there sufficient evidence to conclude that a difference exists between the proportions of cats and dogs that sleep more than 10 hours per day?
A) Yes, because the test value 2.41 is outside the noncritical region -1.96 < z < 1.96.
B) Yes, because the test value 2.80 is outside the noncritical region -1.65 < z < 1.65.
C) Yes, because the test value 6.32 is outside the noncritical region -1.65 < z < 1.65.
D) Yes, because the test value 7.81 is outside the noncritical region -1.96 < z < 1.96.
Unlock Deck
Unlock for access to all 70 flashcards in this deck.
Unlock Deck
k this deck
58
A poll found that 37% of male voters and 42% of female voters support a particular candidate. To test whether this candidate has equal levels of support between male and female voters, the alternative hypothesis should be
A) .
B) .
C) .
D) .
A)
.B)
.C)
.D)
. Unlock Deck
Unlock for access to all 70 flashcards in this deck.
Unlock Deck
k this deck
59
A poll found that 47% of male voters and 50% of female voters support a particular candidate. To test whether this candidate has equal levels of support between male and female voters, the null hypothesis should be
A) .
B) .
C) .
D) .
A)
.B)
.C)
.D)
. Unlock Deck
Unlock for access to all 70 flashcards in this deck.
Unlock Deck
k this deck
60
Determine the value of α as shown below in the graph of an F distribution. The degrees of freedom for the numerator are seven, and the degrees of freedom for the denominator are nine.
A) 0.01
B) 0.025
C) 0.05
D) 0.1
A) 0.01
B) 0.025
C) 0.05
D) 0.1
Unlock Deck
Unlock for access to all 70 flashcards in this deck.
Unlock Deck
k this deck
61
A researcher hypothesized that the variation in the car rental rates (in US$/day) at a major city airport is less than in the car rental rates down town. A survey found that the variance of the rental rates on 7 cars at the airport was 25.7 while the variance of the rental rates on 6 cars down town was 60.4. What test value should be used in a F test?
A) 2.74
B) 1.53
C) 2.35
D) 5.52
A) 2.74
B) 1.53
C) 2.35
D) 5.52
Unlock Deck
Unlock for access to all 70 flashcards in this deck.
Unlock Deck
k this deck
62
The critical value for a two-tailed F test is 2.65 when α = 0.05, the sample size from which the variance for the numerator was obtained is 10, and the sample size from which the variance for the denominator was obtained is 15.
Unlock Deck
Unlock for access to all 70 flashcards in this deck.
Unlock Deck
k this deck
63
In comparing the two standard deviations below, what test value and degrees of freedom should be used in an F test?
A) test value = 2.33; d.f.N. = 19 and d.f.D. = 24
B) test value = 2.33; d.f.N. = 23 and d.f.D. = 18
C) test value = 5.44; d.f.N. = 24 and d.f.D. = 19
D) test value = 5.44; d.f.N. = 18 and d.f.D. = 23
A) test value = 2.33; d.f.N. = 19 and d.f.D. = 24
B) test value = 2.33; d.f.N. = 23 and d.f.D. = 18
C) test value = 5.44; d.f.N. = 24 and d.f.D. = 19
D) test value = 5.44; d.f.N. = 18 and d.f.D. = 23
Unlock Deck
Unlock for access to all 70 flashcards in this deck.
Unlock Deck
k this deck
64
A researcher hypothesizes that the variation in the amount of money spent on business dinners is greater than the amount spent on lunches. The variance of the cost of nine business dinners (in US$) was 6.12 and the variance on 12 lunches was 0.87. What test value should be used in an F test?
A) 2.65
B) 9.61
C) 49.5
D) 7.03
A) 2.65
B) 9.61
C) 49.5
D) 7.03
Unlock Deck
Unlock for access to all 70 flashcards in this deck.
Unlock Deck
k this deck
65
The critical value for a right-tailed F test is 2.57 when α = 0.025, the degrees of freedom for the numerator are 15, and the degrees of freedom for the denominator are 20.
Unlock Deck
Unlock for access to all 70 flashcards in this deck.
Unlock Deck
k this deck
66
A car salesman claims that the variance of prices on convertibles is higher than the variance of prices on station wagons. The standard deviation of the list price on 16 convertibles is $6800 and the standard deviation on 24 station wagons is $3900. What should the test value be?
A) 1.74
B) 3.04
C) 2.25
D) 1.53
A) 1.74
B) 3.04
C) 2.25
D) 1.53
Unlock Deck
Unlock for access to all 70 flashcards in this deck.
Unlock Deck
k this deck
67
Use Table H from the textbook to find the critical value for a right-tailed F test with α = 0.05, d.f.N. = 21, and d.f.D. = 20.
A) 2.12
B) 2.23
C) 2.20
D) 2.16
A) 2.12
B) 2.23
C) 2.20
D) 2.16
Unlock Deck
Unlock for access to all 70 flashcards in this deck.
Unlock Deck
k this deck
68
What is the critical value for a two-tailed F test with α = 0.10, when the sample size from which the variance for the numerator was obtained is 10, and the sample size from which the denominator was obtained is 24?
A) 2.27
B) 2.25
C) 2.32
D) 2.30
A) 2.27
B) 2.25
C) 2.32
D) 2.30
Unlock Deck
Unlock for access to all 70 flashcards in this deck.
Unlock Deck
k this deck
69
For the samples summarized below, test the hypothesis that the two variances are equal, at α = 0.05
A) Accept the hypothesis because the test value 8.27 is greater than the critical value 2.88.
B) Reject the hypothesis because the test value 2.87 is less than the critical value 2.77.
C) Reject the hypothesis because the test value 8.27 is greater than the critical value 2.77.
D) Accept the hypothesis because the test value 2.87 is less than the critical value 2.88.
Unlock Deck
Unlock for access to all 70 flashcards in this deck.
Unlock Deck
k this deck
70
Given the variances of the two samples below, find the test value and the degrees of freedom that should be used in an F test.
A) test value = 2.94; d.f.N. = 26 and d.f.D. = 14
B) test value = 0.58; d.f.N. = 25 and d.f.D. = 13
C) test value = 1.71; d.f.N. = 25 and d.f.D. = 13
D) test value = 1.31; d.f.N. = 26 and d.f.D. = 14
A) test value = 2.94; d.f.N. = 26 and d.f.D. = 14
B) test value = 0.58; d.f.N. = 25 and d.f.D. = 13
C) test value = 1.71; d.f.N. = 25 and d.f.D. = 13
D) test value = 1.31; d.f.N. = 26 and d.f.D. = 14
Unlock Deck
Unlock for access to all 70 flashcards in this deck.
Unlock Deck
k this deck
Unlock Deck
Unlock for access to all 70 flashcards in this deck.


