Deck 6: The Normal Distribution
Full screen (f)
Question
Question
Question
Question
Question
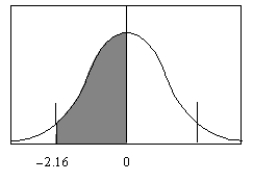
Find the area under the standard normal distribution curve between z = 0 and z = 2.16. 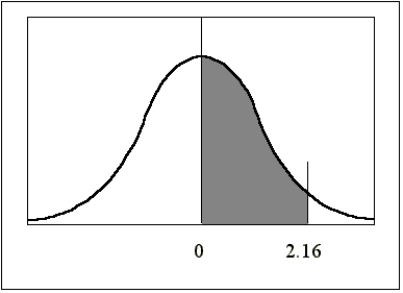
A) 2.1600
B) 0.9846
C) 0.4846
D) 0.3708
A) 2.1600
B) 0.9846
C) 0.4846
D) 0.3708
Question
Question
The number of standard deviations a particular X value is from the mean is commonly referred to as ________.
A) z
B) P(X)
C)
D)
A) z
B) P(X)
C)
D)
Question
Question
Question
Question
Question
Question
Question
Question
Question
Question
Question
Question
Question
The figure below is an example of a negatively skewed distribution. 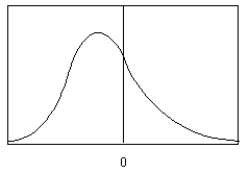
Question
The probability  is 0.3340.
is 0.3340. Question
Find the area under the standard normal distribution curve between z = -2.05 and z = 2.05. 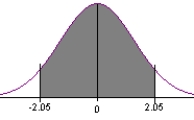
A) 0.4938
B) 0.4798
C) 0.9596
D) 0.9876
A) 0.4938
B) 0.4798
C) 0.9596
D) 0.9876
Question
Question
Question
Find the probability  , using the standard normal distribution.
A) 45.25%
B) 45.54%
C) 42.07%
D) 35.54%
, using the standard normal distribution.A) 45.25%
B) 45.54%
C) 42.07%
D) 35.54%
Question
Question
Question
Find the probability  using the standard normal distribution.
A) 0.6591
B) 0.3409
C) 0.8409
D) 0.5900
using the standard normal distribution.A) 0.6591
B) 0.3409
C) 0.8409
D) 0.5900
Question
Find the z value that corresponds to the given area. 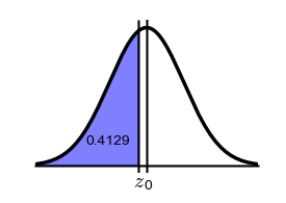
A) 1.33
B) -0.51
C) 0.41
D) -0.22
A) 1.33
B) -0.51
C) 0.41
D) -0.22
Question
Find the probability  using the standard normal distribution.
A) 0.2517
B) 0.7517
C) 0.7483
D) 0.2483
using the standard normal distribution.A) 0.2517
B) 0.7517
C) 0.7483
D) 0.2483
Question
Find the area under the standard normal distribution curve between  and
and  .
. 
A) -2.1600
B) 0.9846
C) 0.4846
D) 0.3708
and . A) -2.1600
B) 0.9846
C) 0.4846
D) 0.3708
Question
Find the probability  using the standard normal distribution.
A) 0.7800
B) 0.4129
C) 0.5871
D) 0.0871
using the standard normal distribution.A) 0.7800
B) 0.4129
C) 0.5871
D) 0.0871
Question
Question
Find the z value to the right of the mean such that 85% of the total area under the standard normal distribution curve lies to the left of it? 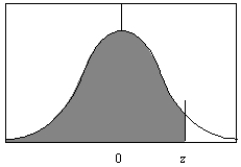
Question
Find the probability  using the standard normal distribution.
A) 0.2946
B) 0.7054
C) 0.7946
D) 0.2054
using the standard normal distribution.A) 0.2946
B) 0.7054
C) 0.7946
D) 0.2054
Question
Find the z value that corresponds to the given area. 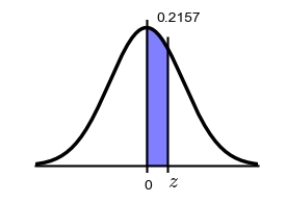
A) -0.79
B) 0.57
C) 0.44
D) 0.27
A) -0.79
B) 0.57
C) 0.44
D) 0.27
Question
Question
Find the z value that corresponds to the given area. 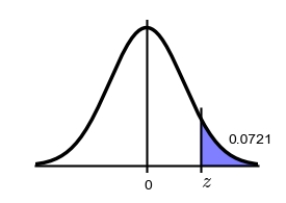
A) -1.46
B) 1.23
C) 1.46
D) 0.07
A) -1.46
B) 1.23
C) 1.46
D) 0.07
Question
What is the area under the standard normal distribution curve between z = 1.50 and z = 2.50? 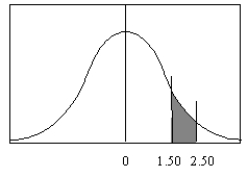
A) 0.0802
B) 0.0606
C) 0.0764
D) 1.00
A) 0.0802
B) 0.0606
C) 0.0764
D) 1.00
Question
Find the area under the standard normal distribution curve to the left of z = 1.69. 
A) 0.4545
B) 0.4452
C) 0.9545
D) 0.9452
A) 0.4545
B) 0.4452
C) 0.9545
D) 0.9452
Question
Question
The data shown represent quiz scores from Ms. Mayer's 5th grade class. Use the Pearson coefficient to check for skewness.
21 25 9 21 23 22 22 15 23 22 16 11 20 20 17 22 21
A) so data is skewed
B) so data is skewed
C) so data is skewed
D) so data is not skewed
21 25 9 21 23 22 22 15 23 22 16 11 20 20 17 22 21
A)
so data is skewedB)
so data is skewedC)
so data is skewedD)
so data is not skewed Question
Question
Question
Question
X is a normally distributed random variable with a mean of 10.00. If the probability that X is less than 11.54 is 0.67 (as shown below), then what is the standard deviation of X? (Note: the diagram is not necessarily to scale.) 
A) 1.75
B) 3.50
C) 4.20
D) 12.25
A) 1.75
B) 3.50
C) 4.20
D) 12.25
Question
X is a normally distributed random variable with a standard deviation of 2.00. Find the mean of X if 12.71% of the area under the distribution curve lies to the right of 8.28. (Note: the diagram is not necessarily to scale.) 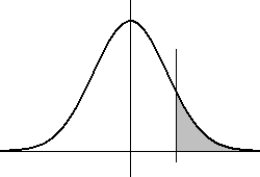
A) 7.6
B) 6.6
C) 6.0
D) 5.5
A) 7.6
B) 6.6
C) 6.0
D) 5.5
Question
Question
Question
Question
The following formula can be used to find the specific value of the variable in a data set that corresponds to a particular value of the standard normal variable: 
Question
Question
X is a normally distributed random variable with a mean of 5.0. Find the standard deviation of the distribution if 59.10% of the data lies to the right of 4.54. (Note: the diagram is not necessarily to scale.) 
A) 2.0
B) 1.3
C) 1.0
D) 0.5
A) 2.0
B) 1.3
C) 1.0
D) 0.5
Question
Question
Question
X is a normally distributed random variable with a mean of 7 and a standard deviation of 2.5. Find the value of X for which 70.54% of the area under the distribution curve lies to the right of it. (Note: the diagram is not necessarily to scale.) 
A) 6.10
B) 6.32
C) 5.65
D) 8.43
A) 6.10
B) 6.32
C) 5.65
D) 8.43
Question
Question
X is a normally distributed random variable with a standard deviation of 3.50. Find the mean of X when 64.8% of the area lies to the left of 10.33. (Note: the diagram is not necessarily to scale.) 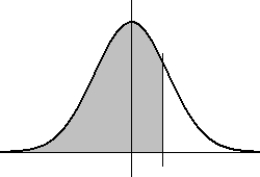
A) 7.1
B) 8.7
C) 9.0
D) 10.2
A) 7.1
B) 8.7
C) 9.0
D) 10.2
Question
Question
X is a normally distributed random variable with a mean of 9.0 and a standard deviation of 3.00. Find the value x such that P(X < x) is equal to 0.86. (Note: the diagram is not necessarily to scale.) 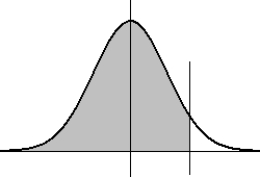
A) 12.24
B) 10.47
C) 13.95
D) 9.00
A) 12.24
B) 10.47
C) 13.95
D) 9.00
Question
Question
Question
Question
Question
As the sample size n increases, the shape of the distribution of the sample means taken with replacement from a population with mean and standard deviation , will approach a normal distribution. This distribution will have a mean of and a standard deviation of  . This is a statement of the _______________________.
. This is a statement of the _______________________. Question
Question
Question
Question
Question
Question
Question
Question
Question
Question
Question
Question
Question
Question
Question

Unlock Deck
Sign up to unlock the cards in this deck!
Unlock Deck
Unlock Deck
1/81
Play
Full screen (f)
Deck 6: The Normal Distribution
1
Which of the following characteristics does not apply to a theoretical normal distribution?
A) It is bell-shaped.
B) The mean, median, and mode are equal.
C) It is bimodal.
D) It is never negative.
A) It is bell-shaped.
B) The mean, median, and mode are equal.
C) It is bimodal.
D) It is never negative.
C
2
In applied statistics, it is the area under the normal distribution curve which is most important, not the value of single points on the curve.
True
3
For a normal distribution curve with a mean of 7 and a standard deviation of 5, which of the following ranges of the variable will define an area under the curve corresponding to a probability of approximately 34%?
A) from 4.5 to 9.5
B) from 2 to 12
C) from 7 to 12
D) from -3 to 17
A) from 4.5 to 9.5
B) from 2 to 12
C) from 7 to 12
D) from -3 to 17
C
4
Which of the following properties distinguishes the standard normal distribution from other normal distributions?
A) The mean is 0 and the standard deviation is 1.
B) The total area under the curve is equal to 1.00.
C) The curve is continuous.
D) The mean is located at the center of the distribution.
A) The mean is 0 and the standard deviation is 1.
B) The total area under the curve is equal to 1.00.
C) The curve is continuous.
D) The mean is located at the center of the distribution.
Unlock Deck
Unlock for access to all 81 flashcards in this deck.
Unlock Deck
k this deck
5
Find the area under the standard normal distribution curve between z = 0 and z = 2.16.
A) 2.1600
B) 0.9846
C) 0.4846
D) 0.3708
A) 2.1600
B) 0.9846
C) 0.4846
D) 0.3708
Unlock Deck
Unlock for access to all 81 flashcards in this deck.
Unlock Deck
k this deck
6
For a normal distribution curve with a mean of 15 and a standard deviation of 3, which range of the variable defines an area under the curve corresponding to a probability of approximately 68%?
A) from 13.5 to 16.5
B) from 12 to 18
C) from 15 to 21
D) from 9 to 21
A) from 13.5 to 16.5
B) from 12 to 18
C) from 15 to 21
D) from 9 to 21
Unlock Deck
Unlock for access to all 81 flashcards in this deck.
Unlock Deck
k this deck
7
The number of standard deviations a particular X value is from the mean is commonly referred to as ________.
A) z
B) P(X)
C)
D)
A) z
B) P(X)
C)
D)
Unlock Deck
Unlock for access to all 81 flashcards in this deck.
Unlock Deck
k this deck
8
The normal distribution curve can be used as a probability distribution curve for normally distributed variables.
Unlock Deck
Unlock for access to all 81 flashcards in this deck.
Unlock Deck
k this deck
9
Identify the type of distribution pattern that occurs when the majority of the data values fall to the left of the mean?
A) symmetrical
B) positively skewed
C) negatively skewed
D) left skewed
A) symmetrical
B) positively skewed
C) negatively skewed
D) left skewed
Unlock Deck
Unlock for access to all 81 flashcards in this deck.
Unlock Deck
k this deck
10
The area under a normal distribution curve is always positive even if the z value is negative.
Unlock Deck
Unlock for access to all 81 flashcards in this deck.
Unlock Deck
k this deck
11
Stating that the area under the standard normal distribution curve between z = 0 and z = 1.00 is 0.3413, is the same as stating that the _____________ of randomly selecting a standard normally distributed variable z with a value between 0 and 1.00 is 0.3413.
Unlock Deck
Unlock for access to all 81 flashcards in this deck.
Unlock Deck
k this deck
12
Which choice is another term that can be used to describe a normal distribution:
A) independent variable
B) discrete distribution
C) negatively or positively skewed
D) bell curve
A) independent variable
B) discrete distribution
C) negatively or positively skewed
D) bell curve
Unlock Deck
Unlock for access to all 81 flashcards in this deck.
Unlock Deck
k this deck
13
To find the area under the standard normal distribution curve between two z values, one first finds the difference between the two z values, then locates the value corresponding to that difference in the Standard Normal Distribution table.
Unlock Deck
Unlock for access to all 81 flashcards in this deck.
Unlock Deck
k this deck
14
The area under the normal distribution curve that lies within three standard deviations of the mean is approximately 95%.
Unlock Deck
Unlock for access to all 81 flashcards in this deck.
Unlock Deck
k this deck
15
When the data values are evenly distributed about the mean, the distribution is said to be ______________.
Unlock Deck
Unlock for access to all 81 flashcards in this deck.
Unlock Deck
k this deck
16
When the majority of the data values fall to the right of the mean, the distribution is said to be left-skewed.
Unlock Deck
Unlock for access to all 81 flashcards in this deck.
Unlock Deck
k this deck
17
If a normal distribution has a mean of 20 and a standard deviation of 10, then
A) the median is 20 and the mode is 20.
B) the median is 10 and the mode is 30.
C) the median is 30 and the mode is 10.
D) the median is 20 and the mode is 30.
A) the median is 20 and the mode is 20.
B) the median is 10 and the mode is 30.
C) the median is 30 and the mode is 10.
D) the median is 20 and the mode is 30.
Unlock Deck
Unlock for access to all 81 flashcards in this deck.
Unlock Deck
k this deck
18
One normal curve has a mean of 20 and a standard deviation of 5. A second normal curve has a mean of 5 and a standard deviation of 20. The curve that is more dispersed, or spread out, is
A) the first normal curve.
B) the second normal curve.
C) both; they are equally spread out.
D) neither; by definition,a normal curve shows no spread.
A) the first normal curve.
B) the second normal curve.
C) both; they are equally spread out.
D) neither; by definition,a normal curve shows no spread.
Unlock Deck
Unlock for access to all 81 flashcards in this deck.
Unlock Deck
k this deck
19
On an easy test, the mean score was 98 out of a possible 100 points. The distribution of the test scores is likely to be
A) symmetric.
B) negatively skewed.
C) positively skewed.
D) diagonally skewed.
A) symmetric.
B) negatively skewed.
C) positively skewed.
D) diagonally skewed.
Unlock Deck
Unlock for access to all 81 flashcards in this deck.
Unlock Deck
k this deck
20
The figure below is an example of a negatively skewed distribution.
Unlock Deck
Unlock for access to all 81 flashcards in this deck.
Unlock Deck
k this deck
21
The probability is 0.3340.
is 0.3340. Unlock Deck
Unlock for access to all 81 flashcards in this deck.
Unlock Deck
k this deck
22
Find the area under the standard normal distribution curve between z = -2.05 and z = 2.05.
A) 0.4938
B) 0.4798
C) 0.9596
D) 0.9876
A) 0.4938
B) 0.4798
C) 0.9596
D) 0.9876
Unlock Deck
Unlock for access to all 81 flashcards in this deck.
Unlock Deck
k this deck
23
Find the probability P(-0.77 < z < -0.16) using the standard normal distribution.
A) 0.0400
B) 0.7842
C) 0.3458
D) 0.2158
A) 0.0400
B) 0.7842
C) 0.3458
D) 0.2158
Unlock Deck
Unlock for access to all 81 flashcards in this deck.
Unlock Deck
k this deck
24
Find the probability P(-1.09 < z < 1.06) using the standard normal distribution.
A) 0.8410
B) 0.2824
C) 0.7176
D) 0.6744
A) 0.8410
B) 0.2824
C) 0.7176
D) 0.6744
Unlock Deck
Unlock for access to all 81 flashcards in this deck.
Unlock Deck
k this deck
25
Find the probability , using the standard normal distribution.
A) 45.25%
B) 45.54%
C) 42.07%
D) 35.54%
, using the standard normal distribution.A) 45.25%
B) 45.54%
C) 42.07%
D) 35.54%
Unlock Deck
Unlock for access to all 81 flashcards in this deck.
Unlock Deck
k this deck
26
Find the z value to the right of the mean so that 62.93% of the area under the distribution curve lies to the left of it.
Unlock Deck
Unlock for access to all 81 flashcards in this deck.
Unlock Deck
k this deck
27
The area under the standard normal distribution curve to the right of z = 1.83 is 0.4664.
Unlock Deck
Unlock for access to all 81 flashcards in this deck.
Unlock Deck
k this deck
28
Find the probability using the standard normal distribution.
A) 0.6591
B) 0.3409
C) 0.8409
D) 0.5900
using the standard normal distribution.A) 0.6591
B) 0.3409
C) 0.8409
D) 0.5900
Unlock Deck
Unlock for access to all 81 flashcards in this deck.
Unlock Deck
k this deck
29
Find the z value that corresponds to the given area.
A) 1.33
B) -0.51
C) 0.41
D) -0.22
A) 1.33
B) -0.51
C) 0.41
D) -0.22
Unlock Deck
Unlock for access to all 81 flashcards in this deck.
Unlock Deck
k this deck
30
Find the probability using the standard normal distribution.
A) 0.2517
B) 0.7517
C) 0.7483
D) 0.2483
using the standard normal distribution.A) 0.2517
B) 0.7517
C) 0.7483
D) 0.2483
Unlock Deck
Unlock for access to all 81 flashcards in this deck.
Unlock Deck
k this deck
31
Find the area under the standard normal distribution curve between and .
A) -2.1600
B) 0.9846
C) 0.4846
D) 0.3708
and . A) -2.1600
B) 0.9846
C) 0.4846
D) 0.3708
Unlock Deck
Unlock for access to all 81 flashcards in this deck.
Unlock Deck
k this deck
32
Find the probability using the standard normal distribution.
A) 0.7800
B) 0.4129
C) 0.5871
D) 0.0871
using the standard normal distribution.A) 0.7800
B) 0.4129
C) 0.5871
D) 0.0871
Unlock Deck
Unlock for access to all 81 flashcards in this deck.
Unlock Deck
k this deck
33
Find the probability P(0.21 < z < 1.28) using the standard normal distribution.
A) 0.3166
B) 0.6834
C) 0.8166
D) 0.4100
A) 0.3166
B) 0.6834
C) 0.8166
D) 0.4100
Unlock Deck
Unlock for access to all 81 flashcards in this deck.
Unlock Deck
k this deck
34
Find the z value to the right of the mean such that 85% of the total area under the standard normal distribution curve lies to the left of it?
Unlock Deck
Unlock for access to all 81 flashcards in this deck.
Unlock Deck
k this deck
35
Find the probability using the standard normal distribution.
A) 0.2946
B) 0.7054
C) 0.7946
D) 0.2054
using the standard normal distribution.A) 0.2946
B) 0.7054
C) 0.7946
D) 0.2054
Unlock Deck
Unlock for access to all 81 flashcards in this deck.
Unlock Deck
k this deck
36
Find the z value that corresponds to the given area.
A) -0.79
B) 0.57
C) 0.44
D) 0.27
A) -0.79
B) 0.57
C) 0.44
D) 0.27
Unlock Deck
Unlock for access to all 81 flashcards in this deck.
Unlock Deck
k this deck
37
In a standard normal distribution, what z value corresponds to 17% of the data between the mean and the z value?
A) 1.25
B) 0.44
C) 0.52
D) 2.10
A) 1.25
B) 0.44
C) 0.52
D) 2.10
Unlock Deck
Unlock for access to all 81 flashcards in this deck.
Unlock Deck
k this deck
38
Find the z value that corresponds to the given area.
A) -1.46
B) 1.23
C) 1.46
D) 0.07
A) -1.46
B) 1.23
C) 1.46
D) 0.07
Unlock Deck
Unlock for access to all 81 flashcards in this deck.
Unlock Deck
k this deck
39
What is the area under the standard normal distribution curve between z = 1.50 and z = 2.50?
A) 0.0802
B) 0.0606
C) 0.0764
D) 1.00
A) 0.0802
B) 0.0606
C) 0.0764
D) 1.00
Unlock Deck
Unlock for access to all 81 flashcards in this deck.
Unlock Deck
k this deck
40
Find the area under the standard normal distribution curve to the left of z = 1.69.
A) 0.4545
B) 0.4452
C) 0.9545
D) 0.9452
A) 0.4545
B) 0.4452
C) 0.9545
D) 0.9452
Unlock Deck
Unlock for access to all 81 flashcards in this deck.
Unlock Deck
k this deck
41
What is the z value such that 50% of the total area under the standard normal distribution curved lies to the right of it?
Unlock Deck
Unlock for access to all 81 flashcards in this deck.
Unlock Deck
k this deck
42
The data shown represent quiz scores from Ms. Mayer's 5th grade class. Use the Pearson coefficient to check for skewness.
21 25 9 21 23 22 22 15 23 22 16 11 20 20 17 22 21
A) so data is skewed
B) so data is skewed
C) so data is skewed
D) so data is not skewed
21 25 9 21 23 22 22 15 23 22 16 11 20 20 17 22 21
A)
so data is skewedB)
so data is skewedC)
so data is skewedD)
so data is not skewed Unlock Deck
Unlock for access to all 81 flashcards in this deck.
Unlock Deck
k this deck
43
The average gas mileage of a certain model car is 28.0 miles per gallon. If the gas mileages are normally distributed with a standard deviation of 0.45 miles per gallon, find the probability that a car has a gas mileage of between 27.8 and 28.2 miles per gallon.
A) 0.343
B) 0.157
C) 0.403
D) 0.172
A) 0.343
B) 0.157
C) 0.403
D) 0.172
Unlock Deck
Unlock for access to all 81 flashcards in this deck.
Unlock Deck
k this deck
44
The average hourly wage of workers at a fast food restaurant is $6.50/hr. Assume the wages are normally distributed with a standard deviation of $0.45. If a worker at this fast food restaurant is selected at random, what is the probability that the worker earns more than $6.75?
A) 28.8%
B) 27.6%
C) 42.1%
D) 5.2%
A) 28.8%
B) 27.6%
C) 42.1%
D) 5.2%
Unlock Deck
Unlock for access to all 81 flashcards in this deck.
Unlock Deck
k this deck
45
The average length of crocodiles in a swamp is 12 feet. If the lengths are normally distributed with a standard deviation of 1.9 feet, find the probability that a crocodile is more than 11.5 feet long.
A) 0.90
B) 0.40
C) 0.10
D) 0.60
A) 0.90
B) 0.40
C) 0.10
D) 0.60
Unlock Deck
Unlock for access to all 81 flashcards in this deck.
Unlock Deck
k this deck
46
X is a normally distributed random variable with a mean of 10.00. If the probability that X is less than 11.54 is 0.67 (as shown below), then what is the standard deviation of X? (Note: the diagram is not necessarily to scale.)
A) 1.75
B) 3.50
C) 4.20
D) 12.25
A) 1.75
B) 3.50
C) 4.20
D) 12.25
Unlock Deck
Unlock for access to all 81 flashcards in this deck.
Unlock Deck
k this deck
47
X is a normally distributed random variable with a standard deviation of 2.00. Find the mean of X if 12.71% of the area under the distribution curve lies to the right of 8.28. (Note: the diagram is not necessarily to scale.)
A) 7.6
B) 6.6
C) 6.0
D) 5.5
A) 7.6
B) 6.6
C) 6.0
D) 5.5
Unlock Deck
Unlock for access to all 81 flashcards in this deck.
Unlock Deck
k this deck
48
Mrs. Smith's reading class can read an average of 175 words per minute with a standard deviation of 20 words per minute. The top 3% of the class is to receive a special award. What is the minimum number of words per minute a student would need to read in order to get the award? Assume the data is normally distributed.
Unlock Deck
Unlock for access to all 81 flashcards in this deck.
Unlock Deck
k this deck
49
For a normal distribution with a mean of 4 and a standard deviation of 2, the value 5 has a z value of
A) -0.5
B) 0.5
C) 1.5
D) 2.5
A) -0.5
B) 0.5
C) 1.5
D) 2.5
Unlock Deck
Unlock for access to all 81 flashcards in this deck.
Unlock Deck
k this deck
50
At a large department store, the average number of years of employment for a cashier is 5.7 with a standard deviation of 1.8 years, and the distribution is approximately normal. If an employee is picked at random, what is the probability that the employee has worked at the store for over 10 years?
A) 99.2%
B) 49.2%
C) 1.7%
D) 0.8%
A) 99.2%
B) 49.2%
C) 1.7%
D) 0.8%
Unlock Deck
Unlock for access to all 81 flashcards in this deck.
Unlock Deck
k this deck
51
The following formula can be used to find the specific value of the variable in a data set that corresponds to a particular value of the standard normal variable:
Unlock Deck
Unlock for access to all 81 flashcards in this deck.
Unlock Deck
k this deck
52
The average height of flowering cherry trees in a certain nursery is 10.5 feet. If the heights are normally distributed with a standard deviation of 1.5 feet, find the probability that a tree is less than 12.5 feet tall.
A) 0.73
B) 0.91
C) 0.96
D) 0.82
A) 0.73
B) 0.91
C) 0.96
D) 0.82
Unlock Deck
Unlock for access to all 81 flashcards in this deck.
Unlock Deck
k this deck
53
X is a normally distributed random variable with a mean of 5.0. Find the standard deviation of the distribution if 59.10% of the data lies to the right of 4.54. (Note: the diagram is not necessarily to scale.)
A) 2.0
B) 1.3
C) 1.0
D) 0.5
A) 2.0
B) 1.3
C) 1.0
D) 0.5
Unlock Deck
Unlock for access to all 81 flashcards in this deck.
Unlock Deck
k this deck
54
For a normal distribution with a mean of 8 and a standard deviation of 4, the value 6 has a z value of
A) 1.5
B) -2.5
C) -1.5
D) -0.5
A) 1.5
B) -2.5
C) -1.5
D) -0.5
Unlock Deck
Unlock for access to all 81 flashcards in this deck.
Unlock Deck
k this deck
55
In order to be accepted into a certain top university, applicants must score within the top 5% on the SAT exam. Given that the exam has a mean of 1000 and a standard deviation of 200, what is the lowest possible score a student needs to qualify for acceptance into the university?
A) 1400
B) 1330
C) 1250
D) 1100
A) 1400
B) 1330
C) 1250
D) 1100
Unlock Deck
Unlock for access to all 81 flashcards in this deck.
Unlock Deck
k this deck
56
X is a normally distributed random variable with a mean of 7 and a standard deviation of 2.5. Find the value of X for which 70.54% of the area under the distribution curve lies to the right of it. (Note: the diagram is not necessarily to scale.)
A) 6.10
B) 6.32
C) 5.65
D) 8.43
A) 6.10
B) 6.32
C) 5.65
D) 8.43
Unlock Deck
Unlock for access to all 81 flashcards in this deck.
Unlock Deck
k this deck
57
A recent study found that the life expectancy of a people living in Africa is normally distributed with an average of 53 years with a standard deviation of 7.5 years. If a person in Africa is selected at random, what is the probability that the person will die before the age of 65?
A) 94.5%
B) 44.5%
C) 61.0%
D) 89.0%
A) 94.5%
B) 44.5%
C) 61.0%
D) 89.0%
Unlock Deck
Unlock for access to all 81 flashcards in this deck.
Unlock Deck
k this deck
58
X is a normally distributed random variable with a standard deviation of 3.50. Find the mean of X when 64.8% of the area lies to the left of 10.33. (Note: the diagram is not necessarily to scale.)
A) 7.1
B) 8.7
C) 9.0
D) 10.2
A) 7.1
B) 8.7
C) 9.0
D) 10.2
Unlock Deck
Unlock for access to all 81 flashcards in this deck.
Unlock Deck
k this deck
59
If a normally distributed group of test scores have a mean of 70 and a standard deviation of 12, find the percentage of scores that will fall below 50.
A) 4.75%
B) 45.25%
C) 6.75%
D) 35.54%
A) 4.75%
B) 45.25%
C) 6.75%
D) 35.54%
Unlock Deck
Unlock for access to all 81 flashcards in this deck.
Unlock Deck
k this deck
60
X is a normally distributed random variable with a mean of 9.0 and a standard deviation of 3.00. Find the value x such that P(X < x) is equal to 0.86. (Note: the diagram is not necessarily to scale.)
A) 12.24
B) 10.47
C) 13.95
D) 9.00
A) 12.24
B) 10.47
C) 13.95
D) 9.00
Unlock Deck
Unlock for access to all 81 flashcards in this deck.
Unlock Deck
k this deck
61
The difference between a sample mean and the population mean may be referred to as ______________________.
A) the standard deviation
B) the variance
C) skewness
D) sampling error
A) the standard deviation
B) the variance
C) skewness
D) sampling error
Unlock Deck
Unlock for access to all 81 flashcards in this deck.
Unlock Deck
k this deck
62
A(n) _______________________ is employed when a continuous distribution is used to approximate a discrete distribution.
Unlock Deck
Unlock for access to all 81 flashcards in this deck.
Unlock Deck
k this deck
63
Of the members of a Boy Scout troop, 15% have received the first aid merit badge. If 40 boy scouts are selected at random, find the probability that four or more will have the first aid merit badge?
A) 86.6%
B) 81.3%
C) 36.6%
D) 31.3%
A) 86.6%
B) 81.3%
C) 36.6%
D) 31.3%
Unlock Deck
Unlock for access to all 81 flashcards in this deck.
Unlock Deck
k this deck
64
The average age of doctors in a certain hospital is 45.0 years old. Suppose the distribution of ages is normal and has a standard deviation of 4.0 years. If 16 doctors are chosen at random for a committee, find the probability that the average age of those doctors is less than 45.5 years. Assume that the variable is normally distributed.
A) 19.1%
B) 30.9%
C) 61.2%
D) 69.1%
A) 19.1%
B) 30.9%
C) 61.2%
D) 69.1%
Unlock Deck
Unlock for access to all 81 flashcards in this deck.
Unlock Deck
k this deck
65
As the sample size n increases, the shape of the distribution of the sample means taken with replacement from a population with mean and standard deviation , will approach a normal distribution. This distribution will have a mean of and a standard deviation of . This is a statement of the _______________________.
. This is a statement of the _______________________. Unlock Deck
Unlock for access to all 81 flashcards in this deck.
Unlock Deck
k this deck
66
A(n) __________________________________ is a distribution of means obtained from samples of a specific size taken from a population.
Unlock Deck
Unlock for access to all 81 flashcards in this deck.
Unlock Deck
k this deck
67
The average number of mosquitos in a stagnant pond is 60 per square meter with a standard deviation of 16. If 25 square meters are chosen at random for a mosquito count, find the probability that the average of those counts is more than 62.9 mosquitos per square meter. Assume that the variable is normally distributed.
A) 0.3%
B) 18.4%
C) 31.6%
D) 81.6%
A) 0.3%
B) 18.4%
C) 31.6%
D) 81.6%
Unlock Deck
Unlock for access to all 81 flashcards in this deck.
Unlock Deck
k this deck
68
The average diameter of sand dollars on a certain island is 3.50 centimeters with a standard deviation of 1.00 centimeters. If 25 sand dollars are chosen at random for a collection, find the probability that the average diameter of those sand dollars is more than 3.28 centimeters. Assume that the variable is normally distributed.
A) 0.636
B) 0.800
C) 0.364
D) 0.864
A) 0.636
B) 0.800
C) 0.364
D) 0.864
Unlock Deck
Unlock for access to all 81 flashcards in this deck.
Unlock Deck
k this deck
69
The mean weight of loads of rock is 47.0 tons with a standard deviation of 6.0 tons. If 16 loads are chosen at random for a weight check, find the probability that the mean weight of those loads is less than 46.2 tons. Assume that the variable is normally distributed.
A) 21.23
B) 28.77
C) 71.23
D) 78.77
A) 21.23
B) 28.77
C) 71.23
D) 78.77
Unlock Deck
Unlock for access to all 81 flashcards in this deck.
Unlock Deck
k this deck
70
A survey of 250 lobster fishermen found that they catch an average of 32.0 pounds of lobster per day with a standard deviation of 4.0 pounds. If a random sample of 36 lobster fishermen is selected, what is the probability that their average catch is less than 31.5 pounds? Assume the distribution of the weights of lobster is normal.
Unlock Deck
Unlock for access to all 81 flashcards in this deck.
Unlock Deck
k this deck
71
The average age of vehicles registered in the United States is 96 months. Assume the population is normally distributed with a standard deviation of 15 months. Find the probability that the mean age of a sample of 36 vehicles is between 98 and 100 months?
A) 44.5%
B) 28.8%
C) 15.7%
D) 6.4%
A) 44.5%
B) 28.8%
C) 15.7%
D) 6.4%
Unlock Deck
Unlock for access to all 81 flashcards in this deck.
Unlock Deck
k this deck
72
If a baseball player's batting average is 0.340 , find the probability that the player will have a bad season and get at most 60 hits in 200 times at bat?
A) 38.3%
B) 11.7%
C) 36.9%
D) 13.1%
A) 38.3%
B) 11.7%
C) 36.9%
D) 13.1%
Unlock Deck
Unlock for access to all 81 flashcards in this deck.
Unlock Deck
k this deck
73
If the standard deviation of a normally distributed population is 60.0 and we take a sample of size 25, then the standard error of the mean is
A) 12.0
B) 5.0
C) 60.0
D) 2.4
A) 12.0
B) 5.0
C) 60.0
D) 2.4
Unlock Deck
Unlock for access to all 81 flashcards in this deck.
Unlock Deck
k this deck
74
In order to have the standard error of the mean be 11, one would need to take _______ samples from a normally distributed population with a standard deviation of 55.
A) 5
B) 25
C) 125
D) 625
A) 5
B) 25
C) 125
D) 625
Unlock Deck
Unlock for access to all 81 flashcards in this deck.
Unlock Deck
k this deck
75
A biologist estimates that 40% of the deer in a region carry a certain type of tick. For a sample of 300 deer selected at random, what is the chance that 124 or fewer deer have this tick?
A) 0.864
B) 0.702
C) 0.404
D) 0.298
A) 0.864
B) 0.702
C) 0.404
D) 0.298
Unlock Deck
Unlock for access to all 81 flashcards in this deck.
Unlock Deck
k this deck
76
The length of country and western songs is normally distributed and has a mean of 200 seconds and a standard deviation of 40 seconds. Find the probability that a random selection of 16 songs will have mean length of 186.30 seconds or less. Assume the distribution of the lengths of the songs is normal.
A) 0.91
B) 0.41
C) 0.09
D) 0.59
A) 0.91
B) 0.41
C) 0.09
D) 0.59
Unlock Deck
Unlock for access to all 81 flashcards in this deck.
Unlock Deck
k this deck
77
The _________________ correction factor is important if a relatively large number of samples are taken without replacement from a small population.
Unlock Deck
Unlock for access to all 81 flashcards in this deck.
Unlock Deck
k this deck
78
Use the normal approximation to the binomial to find that probability for the specific value of X.
N = 20, p = 0.3, X = 7
A) 0.17
B) 0.35
C) 0.11
D) 0.3
N = 20, p = 0.3, X = 7
A) 0.17
B) 0.35
C) 0.11
D) 0.3
Unlock Deck
Unlock for access to all 81 flashcards in this deck.
Unlock Deck
k this deck
79
The standard deviation of a normal distribution is 20. What is the standard error of the mean obtained by averaging 225 samples?
Unlock Deck
Unlock for access to all 81 flashcards in this deck.
Unlock Deck
k this deck
80
The standard deviation of sample means will be larger than the standard deviation of the population.
Unlock Deck
Unlock for access to all 81 flashcards in this deck.
Unlock Deck
k this deck
Unlock Deck
Unlock for access to all 81 flashcards in this deck.


