Deck 5: Exploring Data: Distributions
Full screen (f)
Question
Question
Below is a histogram of car prices on a used-car lot. An advertisement for the lot says the average price of a car for sale is $12,000. Could the advertisement be true? Why or why not? 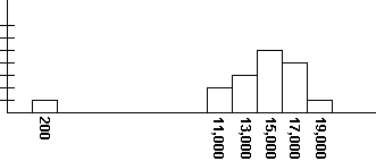
Question
Below is a histogram for a set of data. Would you use the five-number summary or the mean and standard deviation to describe these data? Why? 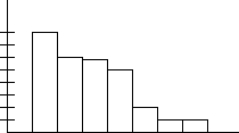
Question
Question
Question
The data below represent the numbers of auto accidents at a certain intersection each month for a year. Find the range of the data.  0, 1, 3, 4, 5, 2, 2, 6, 7, 2, 0, 1
0, 1, 3, 4, 5, 2, 2, 6, 7, 2, 0, 1 Question
Question
Question
Question
Question
Question
Below are the ages of six patients seen by a pediatrician on one day. Find the standard deviation of the ages.  3, 7, 9, 9, 15, 18
3, 7, 9, 9, 15, 18 Question
Below are the ages of six patients seen by a pediatrician on one day. Find the standard deviation of the ages.  3, 6, 7, 9, 15, 20
3, 6, 7, 9, 15, 20 Question
Question
Question
Question
Find the standard deviation of the following set of measurements.  4, 7, 9, 11, 13, 22
4, 7, 9, 11, 13, 22 Question
Question
Find the standard deviation of the following set of data:  5, 7, 17, 31, 45, 47, 68, 85, 96, 99
5, 7, 17, 31, 45, 47, 68, 85, 96, 99 Question
Question
Question
Question
Question
Question
Question
Question
Question
Question
Question
Question
Question
Question
Question
Question
Use the following histogram of waiting times for patients at a health clinic to answer Questions 6-8. 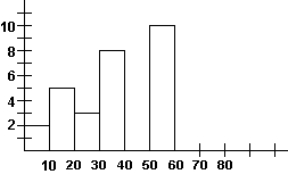
How many patients waited between 20 and 29 minutes?
A) 2
B) 3
C) 6
D) 8
How many patients waited between 20 and 29 minutes?
A) 2
B) 3
C) 6
D) 8
Question
Question
Given the stemplot below, which description is true? 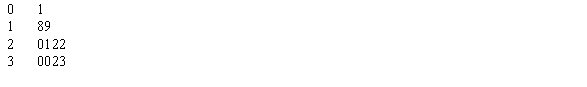
A) The number 1 is the only outlier on the stemplot.
B) The distribution is right-skewed.
C) The median is 21.
D) The range is 33.
A) The number 1 is the only outlier on the stemplot.
B) The distribution is right-skewed.
C) The median is 21.
D) The range is 33.
Question
Question
Given the stemplot below, which description is true? 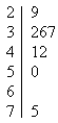
A) There are no outliers on the stemplot.
B) The numbers 29 and 75 are outliers on the stemplot.
C) The number 75 is the only outlier on the stemplot.
D) The number 60 is the only outlier on the stemplot.
A) There are no outliers on the stemplot.
B) The numbers 29 and 75 are outliers on the stemplot.
C) The number 75 is the only outlier on the stemplot.
D) The number 60 is the only outlier on the stemplot.
Question
Given the stemplot below, which description is true? 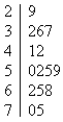
A) There are no outliers on the stemplot.
B) The number 29 is the only outlier on the stemplot.
C) The numbers 29 and 75 are the only outliers on the stemplot.
D) The number 75 is the only outlier on the stemplot.
A) There are no outliers on the stemplot.
B) The number 29 is the only outlier on the stemplot.
C) The numbers 29 and 75 are the only outliers on the stemplot.
D) The number 75 is the only outlier on the stemplot.
Question
Question
Question
Below is a histogram of the ages of people attending a concert. Which statement is true? 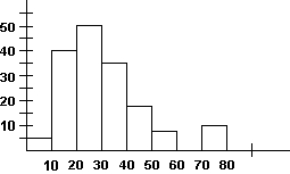
A) The histogram is roughly symmetric.
B) There is a gap in the histogram.
C) The histogram is skewed to the left.
D) The center of the distribution is at about age 50.
A) The histogram is roughly symmetric.
B) There is a gap in the histogram.
C) The histogram is skewed to the left.
D) The center of the distribution is at about age 50.
Question
Question
Question
Given the set of data below, find the mean. 
A) 4.5
B) 5
C) 7
D) 30
A) 4.5
B) 5
C) 7
D) 30
Question
Question
Given the histogram below, which statement is true? 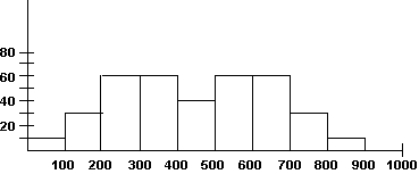
A) The histogram has an outlier between 400 and 500.
B) The histogram is skewed to the right.
C) The histogram is symmetric.
D) The histogram has a gap between 400 and 500.
A) The histogram has an outlier between 400 and 500.
B) The histogram is skewed to the right.
C) The histogram is symmetric.
D) The histogram has a gap between 400 and 500.
Question
Below are the heights (in inches) of students in a third-grade class. Find the median height. 
A) 47.5
B) 50
C) 46.0625
D) 47
A) 47.5
B) 50
C) 46.0625
D) 47
Question
Question
Question
Question
Question
Question
Below are the heights (in inches) of students in a third-grade class. Find the mean height. 
A) 47.5
B) 50
C) 46.0625
D) 47
A) 47.5
B) 50
C) 46.0625
D) 47
Question
Question
Question
Question
Given the histogram below, which statement is true? 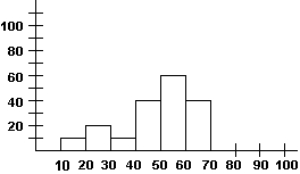
A) The histogram has a gap.
B) There is an outlier at 100.
C) The histogram is skewed to the left.
D) The histogram is roughly symmetric.
A) The histogram has a gap.
B) There is an outlier at 100.
C) The histogram is skewed to the left.
D) The histogram is roughly symmetric.
Question
Question
Below are the lengths (in minutes) of phone calls made to a business on one day. Find the five-number summary for these data. 
A) 5, 8, 14, 15.5, 20
B) 2, 4, 7, 14, 35
C) 2, 4, 6, 12, 19
D) 2, 4.5, 6.5, 13, 35
A) 5, 8, 14, 15.5, 20
B) 2, 4, 7, 14, 35
C) 2, 4, 6, 12, 19
D) 2, 4.5, 6.5, 13, 35
Question
Question
Given the set of data below, find the standard deviation. 
A) 2.37
B) 4.5
C) 4.74
D) 5.6
A) 2.37
B) 4.5
C) 4.74
D) 5.6
Question
Given the set of data below, find the mean. 
A) 34.5
B) 31
C) 31.5
D) 50
A) 34.5
B) 31
C) 31.5
D) 50
Question
Given the set of data below, find the median. 
A) 4.5
B) 5
C) 7
D) 30
A) 4.5
B) 5
C) 7
D) 30
Question
Given the set of data below, find the range. 
A) 2
B) 4
C) 7
D) 9
A) 2
B) 4
C) 7
D) 9
Question
Given the set of data below, find the standard deviation. 
A) 6.07
B) 13.58
C) 184.3
D) 921.5
A) 6.07
B) 13.58
C) 184.3
D) 921.5
Question
Given the set of data below, find the median. 
A) 34.5
B) 31
C) 31.5
D) 50
A) 34.5
B) 31
C) 31.5
D) 50
Question
Questions refer to the following frequency distribution: 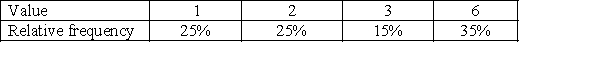
If the data set contains 20 values, how many of them are 3?
A) 6
B) 4
C) 3
D) 2
If the data set contains 20 values, how many of them are 3?
A) 6
B) 4
C) 3
D) 2
Question
Question
Question
Questions refer to the following frequency distribution:
If the data set contains 20 values, what is the median?
A) 2
B) 2.5
C) 3
D) 3.5
If the data set contains 20 values, what is the median?
A) 2
B) 2.5
C) 3
D) 3.5
Question
Question
Below are the scores of 21 students on a history exam. Find the five-number summary of the scores. 
A) 50, 65, 75, 85, 100
B) 50, 65, 75, 87.5, 100
C) 50, 65, 76.9, 87.5, 100
D) 50, 65, 77.5, 90, 100
A) 50, 65, 75, 85, 100
B) 50, 65, 75, 87.5, 100
C) 50, 65, 76.9, 87.5, 100
D) 50, 65, 77.5, 90, 100
Question
Questions refer to the following frequency distribution:
Which of the following statements describes the mean of the distribution?
A) It is less than 2.
B) It is between 2 and 3.
C) It is larger than 3.
D) The mean cannot be determined from the frequency distribution.
Which of the following statements describes the mean of the distribution?
A) It is less than 2.
B) It is between 2 and 3.
C) It is larger than 3.
D) The mean cannot be determined from the frequency distribution.
Question
Question
Question
Given the set of data below, find the range. 
A) 12
B) 34
C) 50
D) 66
A) 12
B) 34
C) 50
D) 66
Question
Question
Below are the numbers of accidents occurring at a certain corner on 15 consecutive days. Find the five-number summary of the data. 
A) 0, 1.5, 3.5, 5.5, 7
B) 0, 1, 3, 5, 7
C) 0, 4, 6, 1, 3
D) 0, 1.5, 3, 5.5, 7
A) 0, 1.5, 3.5, 5.5, 7
B) 0, 1, 3, 5, 7
C) 0, 4, 6, 1, 3
D) 0, 1.5, 3, 5.5, 7

Unlock Deck
Sign up to unlock the cards in this deck!
Unlock Deck
Unlock Deck
1/115
Play
Full screen (f)
Deck 5: Exploring Data: Distributions
1
Two towns both have a mean income for their residents of $30,000. The standard deviation of incomes of residents in town A is $2600, and the standard deviation of incomes of residents in town B is $25,000. Explain what this says about the difference in the distribution of incomes in the two towns.
In town A, the mean income is $30,000 and almost all residents earn between $20,000 and $40,000. The standard deviation of $2600 says incomes do not vary much among residents of the town. In town B, since the standard deviation is $25,000, we know that there are very poor residents and very rich residents even though the mean income is also $30,000.
2
Below is a histogram of car prices on a used-car lot. An advertisement for the lot says the average price of a car for sale is $12,000. Could the advertisement be true? Why or why not?
Yes, the advertisement could be True. The presence of a car or cars with a sale price of $200 (the outlier(s) on the histogram) could lower the mean sale price to $12,000.
3
Below is a histogram for a set of data. Would you use the five-number summary or the mean and standard deviation to describe these data? Why?
Since the distribution is skewed, the five-number summary would be the better choice to describe the data shown in the histogram.
4
After computing the standard deviation for a set of measurements, you notice your answer is negative. Is this possible?
Unlock Deck
Unlock for access to all 115 flashcards in this deck.
Unlock Deck
k this deck
5
Suppose you discover that the outlier 120.0 was recorded incorrectly: It really should be 20.0. When you change 120.0 to 20.0, is the new median larger, smaller, or the same?
Unlock Deck
Unlock for access to all 115 flashcards in this deck.
Unlock Deck
k this deck
6
The data below represent the numbers of auto accidents at a certain intersection each month for a year. Find the range of the data. 0, 1, 3, 4, 5, 2, 2, 6, 7, 2, 0, 1
0, 1, 3, 4, 5, 2, 2, 6, 7, 2, 0, 1 Unlock Deck
Unlock for access to all 115 flashcards in this deck.
Unlock Deck
k this deck
7
In the list of five measurements shown below, one is blurred. What MUST this value be, if the mean of the five measurements is 7?
Unlock Deck
Unlock for access to all 115 flashcards in this deck.
Unlock Deck
k this deck
8
What is the difference Q3 − Q1 for this data set?
Unlock Deck
Unlock for access to all 115 flashcards in this deck.
Unlock Deck
k this deck
9
What is the median of this data set?
Unlock Deck
Unlock for access to all 115 flashcards in this deck.
Unlock Deck
k this deck
10
Below are the ages of students attending an art exhibit. Find the mean age of the students.
11, 11, 12, 12, 13, 1 3, 13, 13, 13, 14, 14, 15, 15, 15, 16, 16, 17, 17, 18
11, 11, 12, 12, 13, 1 3, 13, 13, 13, 14, 14, 15, 15, 15, 16, 16, 17, 17, 18
Unlock Deck
Unlock for access to all 115 flashcards in this deck.
Unlock Deck
k this deck
11
In a normal distribution with mean 100 and standard deviation 7, which value is more common: a value between 100 and 107, or a value outside the range 93 to 107?
Unlock Deck
Unlock for access to all 115 flashcards in this deck.
Unlock Deck
k this deck
12
Below are the ages of six patients seen by a pediatrician on one day. Find the standard deviation of the ages. 3, 7, 9, 9, 15, 18
3, 7, 9, 9, 15, 18 Unlock Deck
Unlock for access to all 115 flashcards in this deck.
Unlock Deck
k this deck
13
Below are the ages of six patients seen by a pediatrician on one day. Find the standard deviation of the ages. 3, 6, 7, 9, 15, 20
3, 6, 7, 9, 15, 20 Unlock Deck
Unlock for access to all 115 flashcards in this deck.
Unlock Deck
k this deck
14
A data set consists of measurements of lengths in centimeters. What is the unit of the standard deviation?
Unlock Deck
Unlock for access to all 115 flashcards in this deck.
Unlock Deck
k this deck
15
Could it be possible that the standard deviation is 0?
Unlock Deck
Unlock for access to all 115 flashcards in this deck.
Unlock Deck
k this deck
16
What is the range of this data set?
Unlock Deck
Unlock for access to all 115 flashcards in this deck.
Unlock Deck
k this deck
17
Find the standard deviation of the following set of measurements. 4, 7, 9, 11, 13, 22
4, 7, 9, 11, 13, 22 Unlock Deck
Unlock for access to all 115 flashcards in this deck.
Unlock Deck
k this deck
18
Find the mean of the following set of data:
23, 45, 26, 18, 11, 42, 35, 16, 32
23, 45, 26, 18, 11, 42, 35, 16, 32
Unlock Deck
Unlock for access to all 115 flashcards in this deck.
Unlock Deck
k this deck
19
Find the standard deviation of the following set of data: 5, 7, 17, 31, 45, 47, 68, 85, 96, 99
5, 7, 17, 31, 45, 47, 68, 85, 96, 99 Unlock Deck
Unlock for access to all 115 flashcards in this deck.
Unlock Deck
k this deck
20
A student earned three midterm scores as 80, 75, 70 and a final test is left. What is the lowest final score if she wants to get the mean of test scores at least 80?
Unlock Deck
Unlock for access to all 115 flashcards in this deck.
Unlock Deck
k this deck
21
Create a set of five positive numbers that have median 8 and mean 6.
Unlock Deck
Unlock for access to all 115 flashcards in this deck.
Unlock Deck
k this deck
22
Based on the histogram, which statement must be true?
A) There are no gaps in the histogram.
B) Eight patients waited exactly 35 minutes.
C) Two patients were seen immediately on arrival at the clinic.
D) More patients waited longer than one half-hour than waited less than one half-hour.
A) There are no gaps in the histogram.
B) Eight patients waited exactly 35 minutes.
C) Two patients were seen immediately on arrival at the clinic.
D) More patients waited longer than one half-hour than waited less than one half-hour.
Unlock Deck
Unlock for access to all 115 flashcards in this deck.
Unlock Deck
k this deck
23
Based on the histogram, which statement is true?
A) The histogram is roughly symmetric.
B) The class from 50 to 59 minutes represents 10 outliers.
C) There is a gap in the histogram.
D) The histogram is skewed to the right.
A) The histogram is roughly symmetric.
B) The class from 50 to 59 minutes represents 10 outliers.
C) There is a gap in the histogram.
D) The histogram is skewed to the right.
Unlock Deck
Unlock for access to all 115 flashcards in this deck.
Unlock Deck
k this deck
24
Below are listed the ages (in months) of children at a daycare center. Choose the correct stemplot of the data.
18, 24, 25, 35, 37, 42, 47, 48, 48, 58
A)
B)
C)
D)
18, 24, 25, 35, 37, 42, 47, 48, 48, 58
A)
B)
C)
D)
Unlock Deck
Unlock for access to all 115 flashcards in this deck.
Unlock Deck
k this deck
25
In the list of five measurements shown below, one is blurred. Supply a fifth value that would make the median 5.
Unlock Deck
Unlock for access to all 115 flashcards in this deck.
Unlock Deck
k this deck
26
The scores of students on a standardized test form a normal distribution with a mean of 300 and a standard deviation of 40. Two thousand students took the test. Find the number of students who score above 380.
Unlock Deck
Unlock for access to all 115 flashcards in this deck.
Unlock Deck
k this deck
27
Below are listed the numbers of children in the classrooms of a small elementary school. Choose the correct stemplot of the data.
12, 14, 20, 21, 21, 25, 27, 30, 30, 30
A)
B)
C)
D)
12, 14, 20, 21, 21, 25, 27, 30, 30, 30
A)
B)
C)
D)
Unlock Deck
Unlock for access to all 115 flashcards in this deck.
Unlock Deck
k this deck
28
The average length of time, per week, that students at a certain university spend on homework is normally distributed with a mean of 24.3 hours and a standard deviation of 1.4 hours. Jane tells her parents she spends more time studying than 75% of the students on campus. How many hours per week must Jane spend on homework for this to be true?
Unlock Deck
Unlock for access to all 115 flashcards in this deck.
Unlock Deck
k this deck
29
Use the data set
3, 4, 5, 6, 7.
What value could you add to this data set that will cause the median to decrease while the range remains same?
3, 4, 5, 6, 7.
What value could you add to this data set that will cause the median to decrease while the range remains same?
Unlock Deck
Unlock for access to all 115 flashcards in this deck.
Unlock Deck
k this deck
30
Below is a list of gas mileage ratings for selected passenger cars in miles per gallon:
53, 43, 89, 41, 85, 86, 91, 92, 95, 94, 86, 102, 114, 30, 123
Make a boxplot to represent these data.
53, 43, 89, 41, 85, 86, 91, 92, 95, 94, 86, 102, 114, 30, 123
Make a boxplot to represent these data.
Unlock Deck
Unlock for access to all 115 flashcards in this deck.
Unlock Deck
k this deck
31
Use the data set
7, 8, 9, 10.
What value can you add to this data set that will make the median equal to 8.5?
7, 8, 9, 10.
What value can you add to this data set that will make the median equal to 8.5?
Unlock Deck
Unlock for access to all 115 flashcards in this deck.
Unlock Deck
k this deck
32
Create a set of five positive numbers that have median 6 and mean 10.
Unlock Deck
Unlock for access to all 115 flashcards in this deck.
Unlock Deck
k this deck
33
In the list of five measurements shown below, one is blurred. Supply a fifth value that would make the median 8.
Unlock Deck
Unlock for access to all 115 flashcards in this deck.
Unlock Deck
k this deck
34
The distribution of the scores on a standardized exam is approximately normal with mean 400 and standard deviation 35. Between what two values do the middle 50% of scores lie?
Unlock Deck
Unlock for access to all 115 flashcards in this deck.
Unlock Deck
k this deck
35
Use the following histogram of waiting times for patients at a health clinic to answer Questions 6-8.
How many patients waited between 20 and 29 minutes?
A) 2
B) 3
C) 6
D) 8
How many patients waited between 20 and 29 minutes?
A) 2
B) 3
C) 6
D) 8
Unlock Deck
Unlock for access to all 115 flashcards in this deck.
Unlock Deck
k this deck
36
Would you expect the mean salary of WNBA basketball players to be larger than the median salary or smaller than the median salary?
Unlock Deck
Unlock for access to all 115 flashcards in this deck.
Unlock Deck
k this deck
37
Given the stemplot below, which description is true?
A) The number 1 is the only outlier on the stemplot.
B) The distribution is right-skewed.
C) The median is 21.
D) The range is 33.
A) The number 1 is the only outlier on the stemplot.
B) The distribution is right-skewed.
C) The median is 21.
D) The range is 33.
Unlock Deck
Unlock for access to all 115 flashcards in this deck.
Unlock Deck
k this deck
38
The scores of students on a standardized test form a normal distribution with a mean score of 500 and a standard deviation of 100. Between what two values do the middle 50% of scores lie?
Unlock Deck
Unlock for access to all 115 flashcards in this deck.
Unlock Deck
k this deck
39
Given the stemplot below, which description is true?
A) There are no outliers on the stemplot.
B) The numbers 29 and 75 are outliers on the stemplot.
C) The number 75 is the only outlier on the stemplot.
D) The number 60 is the only outlier on the stemplot.
A) There are no outliers on the stemplot.
B) The numbers 29 and 75 are outliers on the stemplot.
C) The number 75 is the only outlier on the stemplot.
D) The number 60 is the only outlier on the stemplot.
Unlock Deck
Unlock for access to all 115 flashcards in this deck.
Unlock Deck
k this deck
40
Given the stemplot below, which description is true?
A) There are no outliers on the stemplot.
B) The number 29 is the only outlier on the stemplot.
C) The numbers 29 and 75 are the only outliers on the stemplot.
D) The number 75 is the only outlier on the stemplot.
A) There are no outliers on the stemplot.
B) The number 29 is the only outlier on the stemplot.
C) The numbers 29 and 75 are the only outliers on the stemplot.
D) The number 75 is the only outlier on the stemplot.
Unlock Deck
Unlock for access to all 115 flashcards in this deck.
Unlock Deck
k this deck
41
Use the following information to answer Questions 24-27.
Below are the numbers of errors made by a typist on various pages of typing.
14, 6, 12, 19, 2, 35, 5, 4, 3, 7, 5, 8
Find the mean number of errors.
A) 6.5
B) 7
C) 9.583
D) 10
Below are the numbers of errors made by a typist on various pages of typing.
14, 6, 12, 19, 2, 35, 5, 4, 3, 7, 5, 8
Find the mean number of errors.
A) 6.5
B) 7
C) 9.583
D) 10
Unlock Deck
Unlock for access to all 115 flashcards in this deck.
Unlock Deck
k this deck
42
What is the standard deviation of the ages?
A) 26.4
B) 20.6
C) 19.9
D) 4.5
A) 26.4
B) 20.6
C) 19.9
D) 4.5
Unlock Deck
Unlock for access to all 115 flashcards in this deck.
Unlock Deck
k this deck
43
Below is a histogram of the ages of people attending a concert. Which statement is true?
A) The histogram is roughly symmetric.
B) There is a gap in the histogram.
C) The histogram is skewed to the left.
D) The center of the distribution is at about age 50.
A) The histogram is roughly symmetric.
B) There is a gap in the histogram.
C) The histogram is skewed to the left.
D) The center of the distribution is at about age 50.
Unlock Deck
Unlock for access to all 115 flashcards in this deck.
Unlock Deck
k this deck
44
Use the following information to answer Questions 18-23.
Below is a list of the number of dogs owned by families in a particular neighborhood.
0, 0, 2, 1, 0, 1, 0, 4, 0, 1
What is the mean number of dogs owned?
A) 0
B) 0.5
C) 0.9
D) 1.29
Below is a list of the number of dogs owned by families in a particular neighborhood.
0, 0, 2, 1, 0, 1, 0, 4, 0, 1
What is the mean number of dogs owned?
A) 0
B) 0.5
C) 0.9
D) 1.29
Unlock Deck
Unlock for access to all 115 flashcards in this deck.
Unlock Deck
k this deck
45
Find the median number of errors.
A) 6.5
B) 7
C) 9.583
D) 10
A) 6.5
B) 7
C) 9.583
D) 10
Unlock Deck
Unlock for access to all 115 flashcards in this deck.
Unlock Deck
k this deck
46
Given the set of data below, find the mean.
A) 4.5
B) 5
C) 7
D) 30
A) 4.5
B) 5
C) 7
D) 30
Unlock Deck
Unlock for access to all 115 flashcards in this deck.
Unlock Deck
k this deck
47
Find the third quartile for the number of errors.
A) 5
B) 13
C) 15.5
D) 4.5
A) 5
B) 13
C) 15.5
D) 4.5
Unlock Deck
Unlock for access to all 115 flashcards in this deck.
Unlock Deck
k this deck
48
Given the histogram below, which statement is true?
A) The histogram has an outlier between 400 and 500.
B) The histogram is skewed to the right.
C) The histogram is symmetric.
D) The histogram has a gap between 400 and 500.
A) The histogram has an outlier between 400 and 500.
B) The histogram is skewed to the right.
C) The histogram is symmetric.
D) The histogram has a gap between 400 and 500.
Unlock Deck
Unlock for access to all 115 flashcards in this deck.
Unlock Deck
k this deck
49
Below are the heights (in inches) of students in a third-grade class. Find the median height.
A) 47.5
B) 50
C) 46.0625
D) 47
A) 47.5
B) 50
C) 46.0625
D) 47
Unlock Deck
Unlock for access to all 115 flashcards in this deck.
Unlock Deck
k this deck
50
Use the following information to answer Questions 12-15.
Below are the ages of 15 students in a college class.
27, 50, 33, 25, 86, 25, 85, 31, 37, 44, 20, 36, 59, 34, 28
What is the median age?
A) 34
B) 31
C) 41.3
D) 20.6
Below are the ages of 15 students in a college class.
27, 50, 33, 25, 86, 25, 85, 31, 37, 44, 20, 36, 59, 34, 28
What is the median age?
A) 34
B) 31
C) 41.3
D) 20.6
Unlock Deck
Unlock for access to all 115 flashcards in this deck.
Unlock Deck
k this deck
51
What is the third quartile for these data?
A) 0
B) 0.5
C) 1
D) 1.5
A) 0
B) 0.5
C) 1
D) 1.5
Unlock Deck
Unlock for access to all 115 flashcards in this deck.
Unlock Deck
k this deck
52
Find the first quartile for the number of errors.
A) 5
B) 13
C) 15.5
D) 4.5
A) 5
B) 13
C) 15.5
D) 4.5
Unlock Deck
Unlock for access to all 115 flashcards in this deck.
Unlock Deck
k this deck
53
What is the standard deviation for these data?
A) 0.91
B) 1.11
C) 1.22
D) 1.29
A) 0.91
B) 1.11
C) 1.22
D) 1.29
Unlock Deck
Unlock for access to all 115 flashcards in this deck.
Unlock Deck
k this deck
54
What is the first quartile for these data?
A) 0
B) 0.5
C) 1
D) 1.5
A) 0
B) 0.5
C) 1
D) 1.5
Unlock Deck
Unlock for access to all 115 flashcards in this deck.
Unlock Deck
k this deck
55
Below are the heights (in inches) of students in a third-grade class. Find the mean height.
A) 47.5
B) 50
C) 46.0625
D) 47
A) 47.5
B) 50
C) 46.0625
D) 47
Unlock Deck
Unlock for access to all 115 flashcards in this deck.
Unlock Deck
k this deck
56
What is the mean age?
A) 34
B) 31
C) 41.3
D) 20.6
A) 34
B) 31
C) 41.3
D) 20.6
Unlock Deck
Unlock for access to all 115 flashcards in this deck.
Unlock Deck
k this deck
57
What is the range of the middle 50% of the ages, Q3 - Q1?
A) 23
B) 34
C) 50
D) 66
A) 23
B) 34
C) 50
D) 66
Unlock Deck
Unlock for access to all 115 flashcards in this deck.
Unlock Deck
k this deck
58
What is the range for these data?
A) 1
B) 2
C) 3
D) 4
A) 1
B) 2
C) 3
D) 4
Unlock Deck
Unlock for access to all 115 flashcards in this deck.
Unlock Deck
k this deck
59
Given the histogram below, which statement is true?
A) The histogram has a gap.
B) There is an outlier at 100.
C) The histogram is skewed to the left.
D) The histogram is roughly symmetric.
A) The histogram has a gap.
B) There is an outlier at 100.
C) The histogram is skewed to the left.
D) The histogram is roughly symmetric.
Unlock Deck
Unlock for access to all 115 flashcards in this deck.
Unlock Deck
k this deck
60
What is the median number of dogs owned?
A) 0
B) 0.5
C) 0.9
D) 1.29
A) 0
B) 0.5
C) 0.9
D) 1.29
Unlock Deck
Unlock for access to all 115 flashcards in this deck.
Unlock Deck
k this deck
61
Below are the lengths (in minutes) of phone calls made to a business on one day. Find the five-number summary for these data.
A) 5, 8, 14, 15.5, 20
B) 2, 4, 7, 14, 35
C) 2, 4, 6, 12, 19
D) 2, 4.5, 6.5, 13, 35
A) 5, 8, 14, 15.5, 20
B) 2, 4, 7, 14, 35
C) 2, 4, 6, 12, 19
D) 2, 4.5, 6.5, 13, 35
Unlock Deck
Unlock for access to all 115 flashcards in this deck.
Unlock Deck
k this deck
62
For Questions 48-52, use the following data sets:
Set A: 1, 2, 3, 4
Set B: 1, 1, 4, 7
Set C: 0, 5, 5, 10
Set D: 6, 6, 6, 6
Which data set has standard deviation 0?
A) Set A
B) Set B
C) Set C
D) Set D
Set A: 1, 2, 3, 4
Set B: 1, 1, 4, 7
Set C: 0, 5, 5, 10
Set D: 6, 6, 6, 6
Which data set has standard deviation 0?
A) Set A
B) Set B
C) Set C
D) Set D
Unlock Deck
Unlock for access to all 115 flashcards in this deck.
Unlock Deck
k this deck
63
Given the set of data below, find the standard deviation.
A) 2.37
B) 4.5
C) 4.74
D) 5.6
A) 2.37
B) 4.5
C) 4.74
D) 5.6
Unlock Deck
Unlock for access to all 115 flashcards in this deck.
Unlock Deck
k this deck
64
Given the set of data below, find the mean.
A) 34.5
B) 31
C) 31.5
D) 50
A) 34.5
B) 31
C) 31.5
D) 50
Unlock Deck
Unlock for access to all 115 flashcards in this deck.
Unlock Deck
k this deck
65
Given the set of data below, find the median.
A) 4.5
B) 5
C) 7
D) 30
A) 4.5
B) 5
C) 7
D) 30
Unlock Deck
Unlock for access to all 115 flashcards in this deck.
Unlock Deck
k this deck
66
Given the set of data below, find the range.
A) 2
B) 4
C) 7
D) 9
A) 2
B) 4
C) 7
D) 9
Unlock Deck
Unlock for access to all 115 flashcards in this deck.
Unlock Deck
k this deck
67
Given the set of data below, find the standard deviation.
A) 6.07
B) 13.58
C) 184.3
D) 921.5
A) 6.07
B) 13.58
C) 184.3
D) 921.5
Unlock Deck
Unlock for access to all 115 flashcards in this deck.
Unlock Deck
k this deck
68
Given the set of data below, find the median.
A) 34.5
B) 31
C) 31.5
D) 50
A) 34.5
B) 31
C) 31.5
D) 50
Unlock Deck
Unlock for access to all 115 flashcards in this deck.
Unlock Deck
k this deck
69
Questions refer to the following frequency distribution:
If the data set contains 20 values, how many of them are 3?
A) 6
B) 4
C) 3
D) 2
If the data set contains 20 values, how many of them are 3?
A) 6
B) 4
C) 3
D) 2
Unlock Deck
Unlock for access to all 115 flashcards in this deck.
Unlock Deck
k this deck
70
Use the following information to answer Questions 36-39.
Below are the numbers of pages in each of seven chapters of a textbook.
14, 14, 20, 38, 47, 48, 57
What is the mean number of pages?
A) 34
B) 38
C) 37.33
D) 42.5
Below are the numbers of pages in each of seven chapters of a textbook.
14, 14, 20, 38, 47, 48, 57
What is the mean number of pages?
A) 34
B) 38
C) 37.33
D) 42.5
Unlock Deck
Unlock for access to all 115 flashcards in this deck.
Unlock Deck
k this deck
71
Consider the following data set: 1, 1, 3, 3, 6, 6, 6, 9, 11, 11
What is the relative frequency of the value 6?
A) 6/11
B) 2/11
C) 4/10
D) 3/10
What is the relative frequency of the value 6?
A) 6/11
B) 2/11
C) 4/10
D) 3/10
Unlock Deck
Unlock for access to all 115 flashcards in this deck.
Unlock Deck
k this deck
72
Questions refer to the following frequency distribution:
If the data set contains 20 values, what is the median?
A) 2
B) 2.5
C) 3
D) 3.5
If the data set contains 20 values, what is the median?
A) 2
B) 2.5
C) 3
D) 3.5
Unlock Deck
Unlock for access to all 115 flashcards in this deck.
Unlock Deck
k this deck
73
What is the standard deviation?
A) 18.52
B) 18
C) 17.82
D) 17.67
A) 18.52
B) 18
C) 17.82
D) 17.67
Unlock Deck
Unlock for access to all 115 flashcards in this deck.
Unlock Deck
k this deck
74
Below are the scores of 21 students on a history exam. Find the five-number summary of the scores.
A) 50, 65, 75, 85, 100
B) 50, 65, 75, 87.5, 100
C) 50, 65, 76.9, 87.5, 100
D) 50, 65, 77.5, 90, 100
A) 50, 65, 75, 85, 100
B) 50, 65, 75, 87.5, 100
C) 50, 65, 76.9, 87.5, 100
D) 50, 65, 77.5, 90, 100
Unlock Deck
Unlock for access to all 115 flashcards in this deck.
Unlock Deck
k this deck
75
Questions refer to the following frequency distribution:
Which of the following statements describes the mean of the distribution?
A) It is less than 2.
B) It is between 2 and 3.
C) It is larger than 3.
D) The mean cannot be determined from the frequency distribution.
Which of the following statements describes the mean of the distribution?
A) It is less than 2.
B) It is between 2 and 3.
C) It is larger than 3.
D) The mean cannot be determined from the frequency distribution.
Unlock Deck
Unlock for access to all 115 flashcards in this deck.
Unlock Deck
k this deck
76
Which of the following statements about measures of the center of a distribution of data is true?
A)
Neither the mean nor the median is strongly affected by an outlier in the data.
B)
The mean is strongly affected by an outlier in the data, but the median is not.
C)
The median is strongly affected by an outlier in the data, but the mean is not.
D)
Both the mean and the median are strongly affected by an outlier in the data.
Unlock Deck
Unlock for access to all 115 flashcards in this deck.
Unlock Deck
k this deck
77
What is the median number of pages?
A) 34
B) 38
C) 37.33
D) 42.5
A) 34
B) 38
C) 37.33
D) 42.5
Unlock Deck
Unlock for access to all 115 flashcards in this deck.
Unlock Deck
k this deck
78
Given the set of data below, find the range.
A) 12
B) 34
C) 50
D) 66
A) 12
B) 34
C) 50
D) 66
Unlock Deck
Unlock for access to all 115 flashcards in this deck.
Unlock Deck
k this deck
79
What is the range?
A) 14
B) 38
C) 43
D) 71
A) 14
B) 38
C) 43
D) 71
Unlock Deck
Unlock for access to all 115 flashcards in this deck.
Unlock Deck
k this deck
80
Below are the numbers of accidents occurring at a certain corner on 15 consecutive days. Find the five-number summary of the data.
A) 0, 1.5, 3.5, 5.5, 7
B) 0, 1, 3, 5, 7
C) 0, 4, 6, 1, 3
D) 0, 1.5, 3, 5.5, 7
A) 0, 1.5, 3.5, 5.5, 7
B) 0, 1, 3, 5, 7
C) 0, 4, 6, 1, 3
D) 0, 1.5, 3, 5.5, 7
Unlock Deck
Unlock for access to all 115 flashcards in this deck.
Unlock Deck
k this deck
Unlock Deck
Unlock for access to all 115 flashcards in this deck.


