Deck 16: International Trade
Full screen (f)
Question
Question
Question
Question
Question
Question
Question
Question
Question
Given the following production possibilities schedules, it can be seen that: 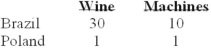
A) Brazil has a comparative advantage in producing wine.
B) Poland can produce more machines than Brazil.
C) Brazil has a comparative advantage in producing machines.
D) Poland can produce more of both goods than Brazil.
A) Brazil has a comparative advantage in producing wine.
B) Poland can produce more machines than Brazil.
C) Brazil has a comparative advantage in producing machines.
D) Poland can produce more of both goods than Brazil.
Question
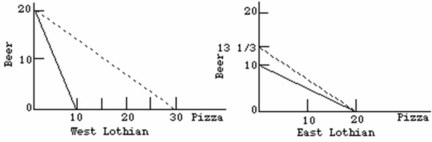
Refer to the above diagrams. The solid lines are production possibilities curves; the dashed lines are trading possibilities curves. The opportunity cost of producing a:
A) pizza is 2 beers in both countries.
B) beer is 1/2 a pizza in both countries.
C) pizza in East Lothian is 1 beer.
D) beer in West Lothian is 1/2 a pizza.
Question
Question
The following is the Production possibilities tables for two countries, Latalia and Trombonia:
Latalia's production possibilities
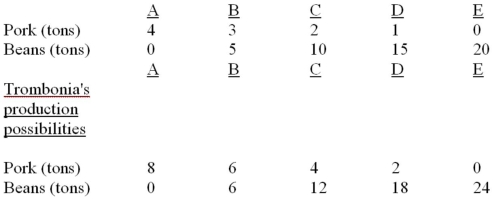
Refer to the above tables. In Latalia the domestic real cost of 1 ton of pork:
A) is 3 tons of beans.
B) diminishes with the level of pork production.
C) is 5 tons of beans.
D) is 1/5 of a ton of beans.
Latalia's production possibilities
Refer to the above tables. In Latalia the domestic real cost of 1 ton of pork:
A) is 3 tons of beans.
B) diminishes with the level of pork production.
C) is 5 tons of beans.
D) is 1/5 of a ton of beans.
Question
Question
Question
Question
Question
Question
Question
Refer to the above diagrams. The solid lines are production possibilities curves; the dashed lines are trading possibilities curves. The data contained in the production possibilities curves are based on the assumption of:
A) imperfect substitutability of resources as between beer and pizza production.
B) constant costs.
C) decreasing costs.
D) increasing costs.
Question
Question
Assuming labour forces of equal size, the production possibilities curves below suggest that West Mudsville has: 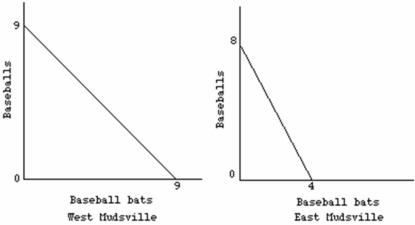
A) lower wages than workers in East Mudsville before trade but equal wages after trade.
B) absolute advantage over East Mudsville for both baseballs and, baseball hats.
C) no advantage over East Mudsville.
D) advantage of East Mudsville for baseballs and not baseball hats.
A) lower wages than workers in East Mudsville before trade but equal wages after trade.
B) absolute advantage over East Mudsville for both baseballs and, baseball hats.
C) no advantage over East Mudsville.
D) advantage of East Mudsville for baseballs and not baseball hats.
Question
Question
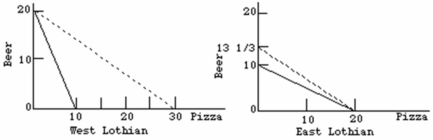
Refer to the above diagrams. The solid lines are production possibilities curves; the dashed lines are trading possibilities curves. The data suggest that:
A) West Lothian should specialize in, and export, beer.
B) both countries will be better off if they do not engage in specialization and trade involving these two products.
C) West Lothian should specialize in, and export, pizza.
D) East Lothian should specialize in, and export, beer.
Question
The following shows points from straight-line production possibilities schedules for two countries.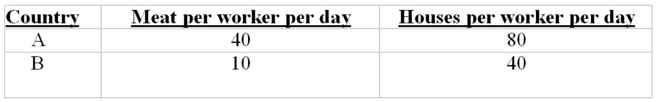
The above table indicates that:
A) country A has comparative advantage in producing meat and country B has comparative advantage in building houses.
B) country A has a comparative advantage in building houses and country B in production of meat.
C) country B can produce both products more efficiently than country A.
D) country A should specialize in building houses.
Question
Nations Quirk and Turk can produce aluminum and oil in the following maximum quantities when all of their resources are fully employed.  Which one of the following terms of trade is most likely to produce exchange between the two nations?
A) .5 unit of oil for 1 unit of aluminum
B) .5 unit of oil for 2 units of aluminum
C) 1 unit of oil for .4 unit of aluminum
D) 1 unit of oil for 5 units of aluminum
Which one of the following terms of trade is most likely to produce exchange between the two nations?A) .5 unit of oil for 1 unit of aluminum
B) .5 unit of oil for 2 units of aluminum
C) 1 unit of oil for .4 unit of aluminum
D) 1 unit of oil for 5 units of aluminum
Question
The following shows the Production possibilities tables for two countries, Latalia and Trombonia:
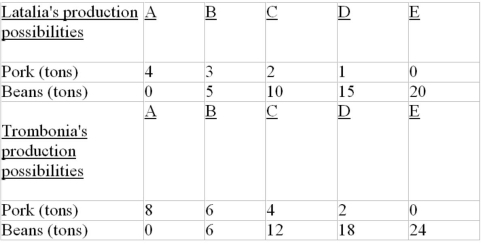
Refer to the above tables. Assume that before specialization and trade, Latalia produced combination C and Trombonia produced combination B. If these two nations now specialize completely in accordance with comparative advantage, the total gains from specialization and trade will be:
A) 4 tons of beans.
B) 1 ton of pork and 2 tons of beans.
C) 4 tons of pork.
D) 2 tons of pork and 4 tons of beans.
Question
Given the following production possibilities schedules, it can be seen that: 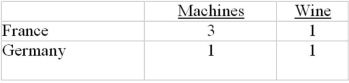
A) France has a comparative advantage in producing wine.
B) Germany can produce more machines than France.
C) France has a comparative advantage in producing machines.
D) Germany can produce more of both goods than France.
A) France has a comparative advantage in producing wine.
B) Germany can produce more machines than France.
C) France has a comparative advantage in producing machines.
D) Germany can produce more of both goods than France.
Question
Question
Question
Question
The following is the Production possibilities data for two countries, Alpha and Beta, which have populations of equal size.
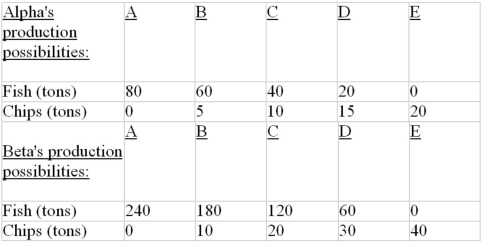
The above data show that:
A) Beta has a comparative advantage in producing chips.
B) Alpha has a comparative advantage in catching fish.
C) Alpha is subject to constant costs and Beta is subject to increasing costs.
D) Beta is more efficient than Alpha.
The above data show that:
A) Beta has a comparative advantage in producing chips.
B) Alpha has a comparative advantage in catching fish.
C) Alpha is subject to constant costs and Beta is subject to increasing costs.
D) Beta is more efficient than Alpha.
Question
Refer to the above diagrams. The solid lines are production possibilities curves; the dashed lines are trading possibilities curves. The trading possibilities curves imply that:
A) both countries are experiencing an excess of exports over imports which results in economic growth.
B) the domestic production possibilities curves entail unemployment and/or the domestic misallocation of resources.
C) world resources will be allocated more efficiently if the two nations specialize and trade in accordance with comparative advantage.
D) both nations will be worse off as a result of international specialization and trade.
Question
The graph below shows the production possibility curves for two hypothetical nations, Orin and Pohl, which each make two hypothetical products, jaxs and keps. Which of the following statements is correct? 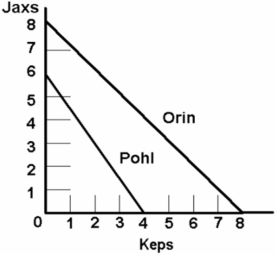
A) Orin has a comparative advantage in both jaxs and keps.
B) Pohl has a comparative advantage in jaxs.
C) The opportunity cost of making jaxs is lower in Orin than in Pohl.
D) Orin is more efficient than Pohl.
A) Orin has a comparative advantage in both jaxs and keps.
B) Pohl has a comparative advantage in jaxs.
C) The opportunity cost of making jaxs is lower in Orin than in Pohl.
D) Orin is more efficient than Pohl.
Question
Question
The following is the Production possibilities data for two countries, Alpha and Beta, which have populations of equal size.
Refer to the above data. The domestic opportunity cost of:
A) producing a ton of chips in Alpha is 1/5 of a ton of fish.
B) producing a ton of chips in Beta is 6 tons of fish.
C) catching a ton of fish in Alpha is 5 tons of chips.
D) catching a ton of fish in Beta is 6 tons of chips.
Refer to the above data. The domestic opportunity cost of:
A) producing a ton of chips in Alpha is 1/5 of a ton of fish.
B) producing a ton of chips in Beta is 6 tons of fish.
C) catching a ton of fish in Alpha is 5 tons of chips.
D) catching a ton of fish in Beta is 6 tons of chips.
Question
Question
The production possibilities table given below shows how many bushels of either wheat or rice can be produced in India and Canada with 1 unit of input. To achieve gains from specialization: 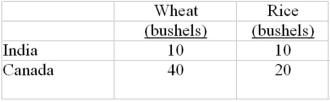
A) India should export rice to Canada and import Canadian wheat.
B) India should export wheat to Canada and import Canadian rice.
C) Canada should produce both wheat and rice and not trade with India.
D) India should produce both wheat and rice and not trade with Canada.
A) India should export rice to Canada and import Canadian wheat.
B) India should export wheat to Canada and import Canadian rice.
C) Canada should produce both wheat and rice and not trade with India.
D) India should produce both wheat and rice and not trade with Canada.
Question
The production possibilities curves below suggest that: 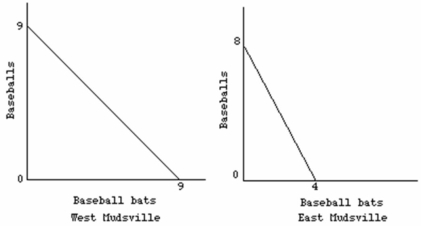
A) West Mudsville should specialize in, and export, baseball bats.
B) West Mudsville should specialize in, and export, both baseballs and baseball bats.
C) East Mudsville should specialize in, and export, baseball bats.
D) workers will try to immigrate from West Mudsville to East Mudsville.
A) West Mudsville should specialize in, and export, baseball bats.
B) West Mudsville should specialize in, and export, both baseballs and baseball bats.
C) East Mudsville should specialize in, and export, baseball bats.
D) workers will try to immigrate from West Mudsville to East Mudsville.
Question
Question
The following shows the Production possibilities tables for two countries, Latalia and Trombonia:
Refer to the above tables. If these two nations specialize on the basis of comparative advantage:
A) Trombonia will produce beans and Latalia will produce pork.
B) Trombonia will produce both beans and pork.
C) Latalia will produce both beans and pork and Trombonia will produce neither.
D) Latalia will produce beans and Trombonia will produce pork.
Question
Refer to the diagram below in which line AB is Canadian production possibility curve and AC is its trading possibilities curve. The international exchange ratio between beef and cheese (terms of trade): 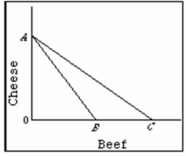
A) is the absolute value of slope of line AB.
B) is the absolute value of slope of line AC.
C) could lie anywhere between the absolute value of the slopes of lines AB and AC.
D) cannot be determined on the basis of this information.
A) is the absolute value of slope of line AB.
B) is the absolute value of slope of line AC.
C) could lie anywhere between the absolute value of the slopes of lines AB and AC.
D) cannot be determined on the basis of this information.
Question
Production possibilities data for two countries, Alpha and Beta, which have populations of equal size.
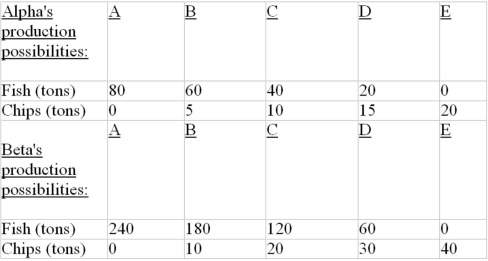
Refer to the above data. Beta:
A) should specialize in catching fish and trade with Alpha for chips.
B) should specialize in producing chips and trade with Alpha for fish.
C) will not realize gains from specialization and trade.
D) will export both fish and chips to Alpha.
Refer to the above data. Beta:
A) should specialize in catching fish and trade with Alpha for chips.
B) should specialize in producing chips and trade with Alpha for fish.
C) will not realize gains from specialization and trade.
D) will export both fish and chips to Alpha.
Question
Question
Question
Production possibilities data for Gamma and Sigma. All data are in tons.
Gamma production possibilities:
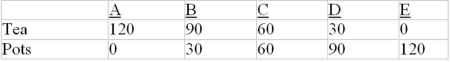 Sigma production possibilities:
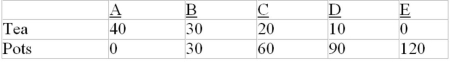
Refer to the above data. What are the limits of the terms of trade between Gamma and Sigma?
A) 1 tea = 2 pots to 1 tea = 6 pots
B) 1 tea = 3 pots to 1 tea = 6 pots
C) 1 tea = 2 pots to 1 tea = 3.5 pots
D) 1 tea = 1 pot to 1 tea = 3 pots
Gamma production possibilities:
Sigma production possibilities:Refer to the above data. What are the limits of the terms of trade between Gamma and Sigma?
A) 1 tea = 2 pots to 1 tea = 6 pots
B) 1 tea = 3 pots to 1 tea = 6 pots
C) 1 tea = 2 pots to 1 tea = 3.5 pots
D) 1 tea = 1 pot to 1 tea = 3 pots
Question
Question
Refer to the data below. Assume that before specialization and trade Gamma and Sigma both chose production possibility "C." Now if each specializes according to comparative advantage, the gains from specialization and trade will be: Production possibilities data for Gamma and Sigma. All data are in tons.
Gamma production possibilities: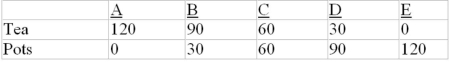 Sigma production possibilities:
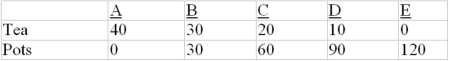
A) 40 tons of pots.
B) 20 tons of tea and 20 tons of pots.
C) 20 tons of tea.
D) 40 tons of tea.
Gamma production possibilities:
Sigma production possibilities: A) 40 tons of pots.
B) 20 tons of tea and 20 tons of pots.
C) 20 tons of tea.
D) 40 tons of tea.
Question
The data given is for two hypothetical nations, Wat and Xat. The nations have the Production Possibilities Curves (PPC) for units of rice and corn as given below.
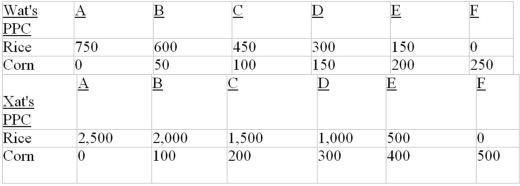
Refer to the above data, in country Wat, the comparative cost of 1 unit of:
A) rice is 3 units of corn.
B) rice is 1/3 unit of corn and should not specialize in production of it if the two nations decide to trade with each other.
C) corn is 5 units of rice.
D) corn is 1/5 unit of rice.
Refer to the above data, in country Wat, the comparative cost of 1 unit of:
A) rice is 3 units of corn.
B) rice is 1/3 unit of corn and should not specialize in production of it if the two nations decide to trade with each other.
C) corn is 5 units of rice.
D) corn is 1/5 unit of rice.
Question
Question
Question
The data given is for two hypothetical nations, Wat and Xat. The nations have the Production Possibilities Curves (PPC) for units of rice and corn as given below.
Refer to the diagram below in which, line AB is the Canadian production possibility curve and AC is its trading possibilities curve. We can conclude that Canada: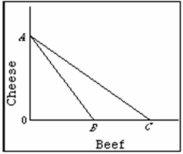
A) has chosen to specialize in the production of cheese.
B) has chosen to specialize in the production of beef.
C) has decided to trade beef for cheese.
D) is relatively more efficient than its trading partners in producing both cheese and beef.
Question
Refer to the diagrams below. The solid lines are production possibilities curves; the dashed lines are trading possibilities curves. The trading possibilities curves suggest that the terms of trade are: 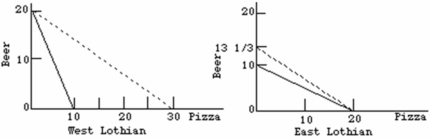
A) 1.5 beers for 1 pizza.
B) 1 beer for 2 pizzas.
C) 2 beers for 1 pizza.
D) 1 beer for 1.5 pizzas.
A) 1.5 beers for 1 pizza.
B) 1 beer for 2 pizzas.
C) 2 beers for 1 pizza.
D) 1 beer for 1.5 pizzas.
Question
Production possibilities data for Gamma and Sigma. All data are in tons.
Gamma production possibilities:
Sigma production possibilities:
On the basis of the above information:
A) Gamma should export both tea and pots to Sigma.
B) Sigma should export tea to Gamma and Gamma should export pots to Sigma.
C) Gamma should export tea to Sigma and Sigma should export pots to Gamma.
D) Gamma should export tea to Sigma, but it will not be profitable for the two nations to exchange pots.
Gamma production possibilities:
Sigma production possibilities:On the basis of the above information:
A) Gamma should export both tea and pots to Sigma.
B) Sigma should export tea to Gamma and Gamma should export pots to Sigma.
C) Gamma should export tea to Sigma and Sigma should export pots to Gamma.
D) Gamma should export tea to Sigma, but it will not be profitable for the two nations to exchange pots.
Question
Question
Refer to the tables below. Which of the following would be feasible terms for trade between Latalia and Trombonia? Production possibilities tables for two countries, Latalia and Trombonia:
Latalia's production possibilities: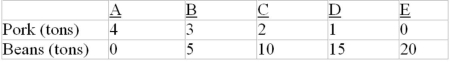 Trombonia's production possibilities:
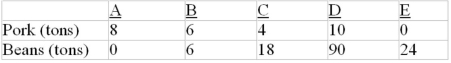
A) 1 ton of beans for 1 ton of pork
B) 2 tons of beans for 1 ton of pork
C) 6 tons of beans for 1 ton of pork
D) 4 tons of beans for 1 ton of pork
Latalia's production possibilities:
Trombonia's production possibilities: A) 1 ton of beans for 1 ton of pork
B) 2 tons of beans for 1 ton of pork
C) 6 tons of beans for 1 ton of pork
D) 4 tons of beans for 1 ton of pork
Question
Production possibilities data for two countries, Alpha and Beta, which have populations of equal size.
Refer to the above data. Assume the production possibilities in Beta double at alternatives A through E while remaining as shown in the table for Alpha. As a result Beta should:
A) continue to specialize in producing chips.
B) continue to specialize in fishing.
C) no longer specialize and trade.
D) specialize both in fishing and in producing chips and sell the surplus to Alpha.
Question
Question
The data embodied in the below diagrams suggest that: 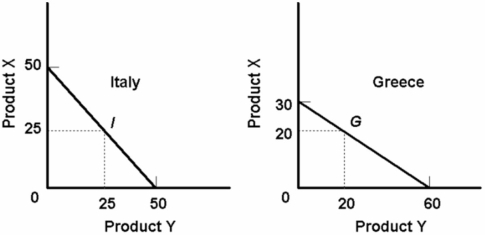
A) Italy should export X and Greece should export Y.
B) Greece should export X and Italy should export Y.
C) production in both countries is subject to increasing costs.
D) Italy should import both X and Y from Greece.
A) Italy should export X and Greece should export Y.
B) Greece should export X and Italy should export Y.
C) production in both countries is subject to increasing costs.
D) Italy should import both X and Y from Greece.
Question
Refer to the diagrams below. Which of the following is a feasible rate at which X and Y might be exchanged? 
A) 1X for 3Y
B) 1X for 1.5Y
C) 1X for 2.5Y
D) 1X for .5Y
A) 1X for 3Y
B) 1X for 1.5Y
C) 1X for 2.5Y
D) 1X for .5Y
Question
Question
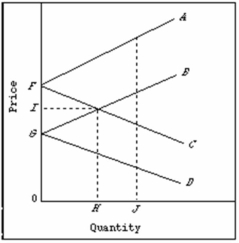
Refer to the above diagram pertaining to two nations and a specific product. In equilibrium, the nation represented by lines FA and FC will:
A) export H to the country represented by lines GB and GD.
B) import H from the country represented by lines GB and GD.
C) pay price F for its imports.
D) receive price G for its exports.
Question
Question
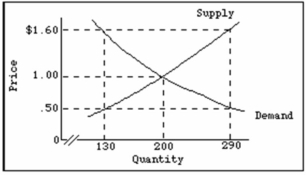
Refer to the above diagram showing the domestic demand and supply curves for a specific standardized product in a particular nation. If the world price of this product is $1, this nation will:
A) export all of the product.
B) import all of the product.
C) import some of the product and produce some of the product domestically.
D) neither export nor import the product.
Question
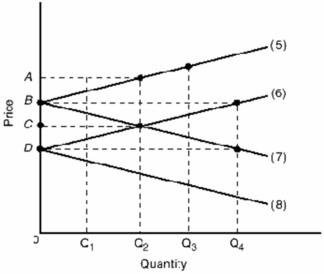
Refer to the above graph which shows the import demand and export supply curves for two nations that produce a product. The export supply curves for the two nations are represented by lines:
A) 5 and 7.
B) 5 and 6.
C) 6 and 8.
D) 7 and 8.
Question
Question
Refer to the above diagram pertaining to two nations and a specific product. Lines FA and GB are:
A) domestic supply curves for two countries.
B) domestic demand curves for two countries.
C) import demand curves for two countries.
D) export supply curves for two countries.
Question
Question
Refer to the above graph which shows the import demand and export supply curves for two nations that produce a product. The import demand curves for the two nations are represented by lines:
A) 5 and 6.
B) 5 and 7.
C) 6 and 8.
D) 7 and 8.
Question
Refer to the above diagram showing the domestic demand and supply curves for a specific standardized product in a particular nation. If the world price for this product is $.50, this nation will experience a domestic:
A) shortage of 160 units, which it will meet with 160 units of imports.
B) shortage of 160 units, which will increase the domestic price to $1.60.
C) surplus of 160 units which it will export.
D) surplus of 160 units, which will reduce the world price to $1.00.
Question
The data in the tables below, show that production in: 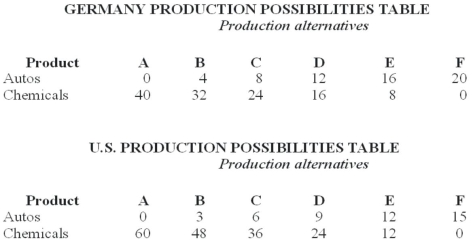
A) Germany is subject to increasing domestic opportunity costs and the U.S. to constant domestic opportunity costs.
B) the U.S. is subject to increasing domestic opportunity costs and Germany to constant domestic opportunity costs.
C) both Germany and the U.S. are subject to constant domestic opportunity costs.
D) both Germany and the U.S. are subject to increasing domestic opportunity costs.
Question
Question
Question
Question
Question
Question
Question
Refer to the above diagram showing the domestic demand and supply curves for a specific standardized product in a particular nation. If the world price for this product is $1.60, this nation will experience a domestic:
A) shortage of 160 units, which it will meet with 160 units of imports.
B) shortage of 160 units, which will increase the domestic price to $1.60.
C) surplus of 160 units, which it will export.
D) surplus of 160 units, which will reduce the world price to $1.00.
Question
Refer to the above diagram pertaining to two nations and a specific product. Lines FC and GD are:
A) domestic supply curves for two countries.
B) import demand curves for two countries.
C) domestic demand curves for two countries.
D) export supply curves for two countries.
Question
Question
Refer to the above diagram pertaining to two nations and a specific product. Point G is the:
A) domestic price for the nation represented by lines FA and FC.
B) world equilibrium price.
C) domestic price for the nation represented by lines GB and GD.
D) price above the world equilibrium price.

Unlock Deck
Sign up to unlock the cards in this deck!
Unlock Deck
Unlock Deck
1/181
Play
Full screen (f)
Deck 16: International Trade
1
The best example of a land-intensive commodity is:
A) cameras.
B) radios.
C) meat.
D) chemicals.
A) cameras.
B) radios.
C) meat.
D) chemicals.
meat.
2
The bulk of Canadian export and import trade is with:
A) Japan
B) China
C) the United States
D) England
A) Japan
B) China
C) the United States
D) England
the United States
3
Which products were the leading exports of Canada in 2011
A) steel
B) clothes
C) industrial goods and materials
D) petroleum
A) steel
B) clothes
C) industrial goods and materials
D) petroleum
industrial goods and materials
4
Differences in production efficiencies among nations in producing a particular good result from:
A) different amounts of skilled labour.
B) different climatic conditions.
C) different levels of technological knowledge.
D) all of the above.
A) different amounts of skilled labour.
B) different climatic conditions.
C) different levels of technological knowledge.
D) all of the above.
Unlock Deck
Unlock for access to all 181 flashcards in this deck.
Unlock Deck
k this deck
5
In terms of absolute volume, world trade is dominated by:
A) Japan, Germany, and China.
B) the United States, England, and China.
C) Germany, England, and France.
D) Germany, the United States, and China.
A) Japan, Germany, and China.
B) the United States, England, and China.
C) Germany, England, and France.
D) Germany, the United States, and China.
Unlock Deck
Unlock for access to all 181 flashcards in this deck.
Unlock Deck
k this deck
6
In a two-nation world, comparative advantage means that one nation can produce:
A) a product with fewer inputs than the other nation.
B) a product at lower average cost than the other nation.
C) a product at a lower domestic opportunity cost than the other nation.
D) more of a product than the other nation.
A) a product with fewer inputs than the other nation.
B) a product at lower average cost than the other nation.
C) a product at a lower domestic opportunity cost than the other nation.
D) more of a product than the other nation.
Unlock Deck
Unlock for access to all 181 flashcards in this deck.
Unlock Deck
k this deck
7
Which of the following is an example of a capital-intensive commodity?
A) clothing
B) wool
C) sunflower seeds
D) chemicals
A) clothing
B) wool
C) sunflower seeds
D) chemicals
Unlock Deck
Unlock for access to all 181 flashcards in this deck.
Unlock Deck
k this deck
8
When Sally can paint a house and plant a tree more efficiently than Tom, we can conclude that:
A) Tom has absolute advantage over Sally in both painting and gardening .
B) Sally has absolute advantage over Tom in both painting and gardening.
C) Sally has absolute advantage over Tom in gardening and not painting.
D) Tom has absolute advantage over Sally in painting and not gardening.
A) Tom has absolute advantage over Sally in both painting and gardening .
B) Sally has absolute advantage over Tom in both painting and gardening.
C) Sally has absolute advantage over Tom in gardening and not painting.
D) Tom has absolute advantage over Sally in painting and not gardening.
Unlock Deck
Unlock for access to all 181 flashcards in this deck.
Unlock Deck
k this deck
9
Given the following production possibilities schedules, it can be seen that:
A) Brazil has a comparative advantage in producing wine.
B) Poland can produce more machines than Brazil.
C) Brazil has a comparative advantage in producing machines.
D) Poland can produce more of both goods than Brazil.
A) Brazil has a comparative advantage in producing wine.
B) Poland can produce more machines than Brazil.
C) Brazil has a comparative advantage in producing machines.
D) Poland can produce more of both goods than Brazil.
Unlock Deck
Unlock for access to all 181 flashcards in this deck.
Unlock Deck
k this deck
10
Refer to the above diagrams. The solid lines are production possibilities curves; the dashed lines are trading possibilities curves. The opportunity cost of producing a:
A) pizza is 2 beers in both countries.
B) beer is 1/2 a pizza in both countries.
C) pizza in East Lothian is 1 beer.
D) beer in West Lothian is 1/2 a pizza.
Unlock Deck
Unlock for access to all 181 flashcards in this deck.
Unlock Deck
k this deck
11
Which of the following is an example of a land-intensive commodity?
A) chemicals
B) autos
C) watches
D) wool
A) chemicals
B) autos
C) watches
D) wool
Unlock Deck
Unlock for access to all 181 flashcards in this deck.
Unlock Deck
k this deck
12
The following is the Production possibilities tables for two countries, Latalia and Trombonia:
Latalia's production possibilities
Refer to the above tables. In Latalia the domestic real cost of 1 ton of pork:
A) is 3 tons of beans.
B) diminishes with the level of pork production.
C) is 5 tons of beans.
D) is 1/5 of a ton of beans.
Latalia's production possibilities
Refer to the above tables. In Latalia the domestic real cost of 1 ton of pork:
A) is 3 tons of beans.
B) diminishes with the level of pork production.
C) is 5 tons of beans.
D) is 1/5 of a ton of beans.
Unlock Deck
Unlock for access to all 181 flashcards in this deck.
Unlock Deck
k this deck
13
Which products were the leading imports of Canada in 2011
A) energy products
B) machinery and equipment
C) agricultural and fishing products
D) petroleum
A) energy products
B) machinery and equipment
C) agricultural and fishing products
D) petroleum
Unlock Deck
Unlock for access to all 181 flashcards in this deck.
Unlock Deck
k this deck
14
Which of the following is an example of a labour-intensive commodity?
A) clothing
B) beer
C) Aspirin tablets
D) gasoline
A) clothing
B) beer
C) Aspirin tablets
D) gasoline
Unlock Deck
Unlock for access to all 181 flashcards in this deck.
Unlock Deck
k this deck
15
The best example of a capital-intensive good is:
A) chemicals.
B) radios.
C) wheat.
D) wool.
A) chemicals.
B) radios.
C) wheat.
D) wool.
Unlock Deck
Unlock for access to all 181 flashcards in this deck.
Unlock Deck
k this deck
16
Consider two countries which trade with each other. The degree of specialization according to their respective comparative advantages will be greater if the countries face:
A) constant costs.
B) high tariffs.
C) low unemployment rates.
D) increasing costs.
A) constant costs.
B) high tariffs.
C) low unemployment rates.
D) increasing costs.
Unlock Deck
Unlock for access to all 181 flashcards in this deck.
Unlock Deck
k this deck
17
Several new players have significantly expanded their share of world trade. These nations are:
A) China, Taiwan, Malaysia, and Indonesia.
B) China, Singapore, South Korea, and Taiwan.
C) North Korea, China, Hong Kong, and Cambodia.
D) Japan, China, South Korea, and Taiwan.
A) China, Taiwan, Malaysia, and Indonesia.
B) China, Singapore, South Korea, and Taiwan.
C) North Korea, China, Hong Kong, and Cambodia.
D) Japan, China, South Korea, and Taiwan.
Unlock Deck
Unlock for access to all 181 flashcards in this deck.
Unlock Deck
k this deck
18
Since World War II, several factors have contributed to the rapid growth of international trade. These factors are:
A) transportation technology, general increase in tariffs, and differences among nations in terms of production cost.
B) transportation and communications technologies, and the general decline in the level of tariffs.
C) transportation technology, reductions in the number of participants, and the general increase in the level of tariffs.
D) communication technology, general increase in the level of tariffs, and the transportation technology.
Unlock Deck
Unlock for access to all 181 flashcards in this deck.
Unlock Deck
k this deck
19
Refer to the above diagrams. The solid lines are production possibilities curves; the dashed lines are trading possibilities curves. The data contained in the production possibilities curves are based on the assumption of:
A) imperfect substitutability of resources as between beer and pizza production.
B) constant costs.
C) decreasing costs.
D) increasing costs.
Unlock Deck
Unlock for access to all 181 flashcards in this deck.
Unlock Deck
k this deck
20
Canadian exports of goods and services are about:
A) 20 percent of Canadian GDP.
B) 5 percent of Canadian GDP.
C) 10 percent of Canadian GDP.
D) 30 percent of Canadian GDP.
A) 20 percent of Canadian GDP.
B) 5 percent of Canadian GDP.
C) 10 percent of Canadian GDP.
D) 30 percent of Canadian GDP.
Unlock Deck
Unlock for access to all 181 flashcards in this deck.
Unlock Deck
k this deck
21
Assuming labour forces of equal size, the production possibilities curves below suggest that West Mudsville has:
A) lower wages than workers in East Mudsville before trade but equal wages after trade.
B) absolute advantage over East Mudsville for both baseballs and, baseball hats.
C) no advantage over East Mudsville.
D) advantage of East Mudsville for baseballs and not baseball hats.
A) lower wages than workers in East Mudsville before trade but equal wages after trade.
B) absolute advantage over East Mudsville for both baseballs and, baseball hats.
C) no advantage over East Mudsville.
D) advantage of East Mudsville for baseballs and not baseball hats.
Unlock Deck
Unlock for access to all 181 flashcards in this deck.
Unlock Deck
k this deck
22
The impact of increasing, as opposed to constant costs is to:
A) intensify and prolong the comparative advantages which any nation may have initially.
B) expand the limits of the terms of trade.
C) cause the basis for further specialization to disappear as nations specialize in accordance with comparative advantage.
D) cause nations to realize economies of scale in those products in which they specialize.
Unlock Deck
Unlock for access to all 181 flashcards in this deck.
Unlock Deck
k this deck
23
Refer to the above diagrams. The solid lines are production possibilities curves; the dashed lines are trading possibilities curves. The data suggest that:
A) West Lothian should specialize in, and export, beer.
B) both countries will be better off if they do not engage in specialization and trade involving these two products.
C) West Lothian should specialize in, and export, pizza.
D) East Lothian should specialize in, and export, beer.
Unlock Deck
Unlock for access to all 181 flashcards in this deck.
Unlock Deck
k this deck
24
The following shows points from straight-line production possibilities schedules for two countries.
The above table indicates that:
A) country A has comparative advantage in producing meat and country B has comparative advantage in building houses.
B) country A has a comparative advantage in building houses and country B in production of meat.
C) country B can produce both products more efficiently than country A.
D) country A should specialize in building houses.
The above table indicates that:
A) country A has comparative advantage in producing meat and country B has comparative advantage in building houses.
B) country A has a comparative advantage in building houses and country B in production of meat.
C) country B can produce both products more efficiently than country A.
D) country A should specialize in building houses.
Unlock Deck
Unlock for access to all 181 flashcards in this deck.
Unlock Deck
k this deck
25
Nations Quirk and Turk can produce aluminum and oil in the following maximum quantities when all of their resources are fully employed. Which one of the following terms of trade is most likely to produce exchange between the two nations?
A) .5 unit of oil for 1 unit of aluminum
B) .5 unit of oil for 2 units of aluminum
C) 1 unit of oil for .4 unit of aluminum
D) 1 unit of oil for 5 units of aluminum
Which one of the following terms of trade is most likely to produce exchange between the two nations?A) .5 unit of oil for 1 unit of aluminum
B) .5 unit of oil for 2 units of aluminum
C) 1 unit of oil for .4 unit of aluminum
D) 1 unit of oil for 5 units of aluminum
Unlock Deck
Unlock for access to all 181 flashcards in this deck.
Unlock Deck
k this deck
26
The following shows the Production possibilities tables for two countries, Latalia and Trombonia:
Refer to the above tables. Assume that before specialization and trade, Latalia produced combination C and Trombonia produced combination B. If these two nations now specialize completely in accordance with comparative advantage, the total gains from specialization and trade will be:
A) 4 tons of beans.
B) 1 ton of pork and 2 tons of beans.
C) 4 tons of pork.
D) 2 tons of pork and 4 tons of beans.
Unlock Deck
Unlock for access to all 181 flashcards in this deck.
Unlock Deck
k this deck
27
Given the following production possibilities schedules, it can be seen that:
A) France has a comparative advantage in producing wine.
B) Germany can produce more machines than France.
C) France has a comparative advantage in producing machines.
D) Germany can produce more of both goods than France.
A) France has a comparative advantage in producing wine.
B) Germany can produce more machines than France.
C) France has a comparative advantage in producing machines.
D) Germany can produce more of both goods than France.
Unlock Deck
Unlock for access to all 181 flashcards in this deck.
Unlock Deck
k this deck
28
In the theory of comparative advantage, a good should be produced in that nation where:
A) the production possibilities line lies further to the right than the trading possibilities line.
B) its cost is least in terms of alternative goods which might otherwise be produced.
C) its absolute cost in terms of real resources used is least.
D) its absolute money cost of production is least.
A) the production possibilities line lies further to the right than the trading possibilities line.
B) its cost is least in terms of alternative goods which might otherwise be produced.
C) its absolute cost in terms of real resources used is least.
D) its absolute money cost of production is least.
Unlock Deck
Unlock for access to all 181 flashcards in this deck.
Unlock Deck
k this deck
29
The following information is about the cost ratios for two products-fish (F) and chicken (C)-in Singsong and Harmony. Assume that production occurs under conditions of constant costs and these are the only two nations in the world. If in Singsong: 1F = 2C and, in Harmony: 1F = 4C then, in Singsong the domestic real cost of each chicken:
A) is 1/2 a fish.
B) is 2 fish.
C) increases with the level of fish caught.
D) decreases with the level of fish caught.
A) is 1/2 a fish.
B) is 2 fish.
C) increases with the level of fish caught.
D) decreases with the level of fish caught.
Unlock Deck
Unlock for access to all 181 flashcards in this deck.
Unlock Deck
k this deck
30
If a nation has a comparative advantage in the production of X, this means the nation:
A) cannot benefit by producing and trading this product.
B) must give up less of other goods than other nations in producing a unit of X.
C) has a production possibilities curve identical to those of other nations.
D) is not subject to increasing opportunity costs.
A) cannot benefit by producing and trading this product.
B) must give up less of other goods than other nations in producing a unit of X.
C) has a production possibilities curve identical to those of other nations.
D) is not subject to increasing opportunity costs.
Unlock Deck
Unlock for access to all 181 flashcards in this deck.
Unlock Deck
k this deck
31
The following is the Production possibilities data for two countries, Alpha and Beta, which have populations of equal size.
The above data show that:
A) Beta has a comparative advantage in producing chips.
B) Alpha has a comparative advantage in catching fish.
C) Alpha is subject to constant costs and Beta is subject to increasing costs.
D) Beta is more efficient than Alpha.
The above data show that:
A) Beta has a comparative advantage in producing chips.
B) Alpha has a comparative advantage in catching fish.
C) Alpha is subject to constant costs and Beta is subject to increasing costs.
D) Beta is more efficient than Alpha.
Unlock Deck
Unlock for access to all 181 flashcards in this deck.
Unlock Deck
k this deck
32
Refer to the above diagrams. The solid lines are production possibilities curves; the dashed lines are trading possibilities curves. The trading possibilities curves imply that:
A) both countries are experiencing an excess of exports over imports which results in economic growth.
B) the domestic production possibilities curves entail unemployment and/or the domestic misallocation of resources.
C) world resources will be allocated more efficiently if the two nations specialize and trade in accordance with comparative advantage.
D) both nations will be worse off as a result of international specialization and trade.
Unlock Deck
Unlock for access to all 181 flashcards in this deck.
Unlock Deck
k this deck
33
The graph below shows the production possibility curves for two hypothetical nations, Orin and Pohl, which each make two hypothetical products, jaxs and keps. Which of the following statements is correct?
A) Orin has a comparative advantage in both jaxs and keps.
B) Pohl has a comparative advantage in jaxs.
C) The opportunity cost of making jaxs is lower in Orin than in Pohl.
D) Orin is more efficient than Pohl.
A) Orin has a comparative advantage in both jaxs and keps.
B) Pohl has a comparative advantage in jaxs.
C) The opportunity cost of making jaxs is lower in Orin than in Pohl.
D) Orin is more efficient than Pohl.
Unlock Deck
Unlock for access to all 181 flashcards in this deck.
Unlock Deck
k this deck
34
Assume that by devoting all of its resources to the production of X, nation Alpha can produce 40 units of X. By devoting all of its resources to Y, Alpha can produce 60Y. Comparable figures for nation Beta are 60X and 40Y. We can conclude that:
A) the terms of trade will be 3X equals 1Y.
B) Alpha should specialize in Y and Beta in X.
C) Alpha should specialize in X and Beta in Y.
D) there is no basis for mutually beneficial specialization and trade.
A) the terms of trade will be 3X equals 1Y.
B) Alpha should specialize in Y and Beta in X.
C) Alpha should specialize in X and Beta in Y.
D) there is no basis for mutually beneficial specialization and trade.
Unlock Deck
Unlock for access to all 181 flashcards in this deck.
Unlock Deck
k this deck
35
The following is the Production possibilities data for two countries, Alpha and Beta, which have populations of equal size.
Refer to the above data. The domestic opportunity cost of:
A) producing a ton of chips in Alpha is 1/5 of a ton of fish.
B) producing a ton of chips in Beta is 6 tons of fish.
C) catching a ton of fish in Alpha is 5 tons of chips.
D) catching a ton of fish in Beta is 6 tons of chips.
Refer to the above data. The domestic opportunity cost of:
A) producing a ton of chips in Alpha is 1/5 of a ton of fish.
B) producing a ton of chips in Beta is 6 tons of fish.
C) catching a ton of fish in Alpha is 5 tons of chips.
D) catching a ton of fish in Beta is 6 tons of chips.
Unlock Deck
Unlock for access to all 181 flashcards in this deck.
Unlock Deck
k this deck
36
According to the principle of comparative advantage, worldwide output and consumption levels will be highest when goods are produced in nations where:
A) domestic opportunity costs are lowest.
B) inflation rates are low.
C) the balance of trade is in a surplus position.
D) the exchange rate is falling.
A) domestic opportunity costs are lowest.
B) inflation rates are low.
C) the balance of trade is in a surplus position.
D) the exchange rate is falling.
Unlock Deck
Unlock for access to all 181 flashcards in this deck.
Unlock Deck
k this deck
37
The production possibilities table given below shows how many bushels of either wheat or rice can be produced in India and Canada with 1 unit of input. To achieve gains from specialization:
A) India should export rice to Canada and import Canadian wheat.
B) India should export wheat to Canada and import Canadian rice.
C) Canada should produce both wheat and rice and not trade with India.
D) India should produce both wheat and rice and not trade with Canada.
A) India should export rice to Canada and import Canadian wheat.
B) India should export wheat to Canada and import Canadian rice.
C) Canada should produce both wheat and rice and not trade with India.
D) India should produce both wheat and rice and not trade with Canada.
Unlock Deck
Unlock for access to all 181 flashcards in this deck.
Unlock Deck
k this deck
38
The production possibilities curves below suggest that:
A) West Mudsville should specialize in, and export, baseball bats.
B) West Mudsville should specialize in, and export, both baseballs and baseball bats.
C) East Mudsville should specialize in, and export, baseball bats.
D) workers will try to immigrate from West Mudsville to East Mudsville.
A) West Mudsville should specialize in, and export, baseball bats.
B) West Mudsville should specialize in, and export, both baseballs and baseball bats.
C) East Mudsville should specialize in, and export, baseball bats.
D) workers will try to immigrate from West Mudsville to East Mudsville.
Unlock Deck
Unlock for access to all 181 flashcards in this deck.
Unlock Deck
k this deck
39
The following information is about the cost ratios for two products-fish (F) and chicken (C)-in Singsong and Harmony. Assume that production occurs under conditions of constant costs and these are the only two nations in the world. If in Singsong: 1F = 2C and, in Harmony: 1F = 4C:
A) Singsong will both produce chicken and catch fish.
B) Harmony will both produce chicken and catch fish.
C) Harmony will produce chicken and Singsong will catch fish.
D) Singsong will produce chicken and Harmony will catch fish.
A) Singsong will both produce chicken and catch fish.
B) Harmony will both produce chicken and catch fish.
C) Harmony will produce chicken and Singsong will catch fish.
D) Singsong will produce chicken and Harmony will catch fish.
Unlock Deck
Unlock for access to all 181 flashcards in this deck.
Unlock Deck
k this deck
40
The following shows the Production possibilities tables for two countries, Latalia and Trombonia:
Refer to the above tables. If these two nations specialize on the basis of comparative advantage:
A) Trombonia will produce beans and Latalia will produce pork.
B) Trombonia will produce both beans and pork.
C) Latalia will produce both beans and pork and Trombonia will produce neither.
D) Latalia will produce beans and Trombonia will produce pork.
Unlock Deck
Unlock for access to all 181 flashcards in this deck.
Unlock Deck
k this deck
41
Refer to the diagram below in which line AB is Canadian production possibility curve and AC is its trading possibilities curve. The international exchange ratio between beef and cheese (terms of trade):
A) is the absolute value of slope of line AB.
B) is the absolute value of slope of line AC.
C) could lie anywhere between the absolute value of the slopes of lines AB and AC.
D) cannot be determined on the basis of this information.
A) is the absolute value of slope of line AB.
B) is the absolute value of slope of line AC.
C) could lie anywhere between the absolute value of the slopes of lines AB and AC.
D) cannot be determined on the basis of this information.
Unlock Deck
Unlock for access to all 181 flashcards in this deck.
Unlock Deck
k this deck
42
Production possibilities data for two countries, Alpha and Beta, which have populations of equal size.
Refer to the above data. Beta:
A) should specialize in catching fish and trade with Alpha for chips.
B) should specialize in producing chips and trade with Alpha for fish.
C) will not realize gains from specialization and trade.
D) will export both fish and chips to Alpha.
Refer to the above data. Beta:
A) should specialize in catching fish and trade with Alpha for chips.
B) should specialize in producing chips and trade with Alpha for fish.
C) will not realize gains from specialization and trade.
D) will export both fish and chips to Alpha.
Unlock Deck
Unlock for access to all 181 flashcards in this deck.
Unlock Deck
k this deck
43
The fact that international specialization and trade based on comparative advantage can increase world output is reflected in the fact that:
A) the production possibilities curve of any two nations are identical.
B) a nation's production possibilities and trading possibilities lines coincide.
C) a nation's trading possibilities line lies to the right of its production possibility
D) a nation's production possibilities line lies to the right of its trading possibilities.
Unlock Deck
Unlock for access to all 181 flashcards in this deck.
Unlock Deck
k this deck
44
The terms of trade reflects the:
A) rate at which gold exchanges internationally for any domestic currency.
B) ratio at which nations will exchange two goods.
C) fact that the gains from trade will be equally divided.
D) cost conditions embodied in a single country's production possibilities curve.
A) rate at which gold exchanges internationally for any domestic currency.
B) ratio at which nations will exchange two goods.
C) fact that the gains from trade will be equally divided.
D) cost conditions embodied in a single country's production possibilities curve.
Unlock Deck
Unlock for access to all 181 flashcards in this deck.
Unlock Deck
k this deck
45
Production possibilities data for Gamma and Sigma. All data are in tons.
Gamma production possibilities:
Sigma production possibilities:
Refer to the above data. What are the limits of the terms of trade between Gamma and Sigma?
A) 1 tea = 2 pots to 1 tea = 6 pots
B) 1 tea = 3 pots to 1 tea = 6 pots
C) 1 tea = 2 pots to 1 tea = 3.5 pots
D) 1 tea = 1 pot to 1 tea = 3 pots
Gamma production possibilities:
Sigma production possibilities:Refer to the above data. What are the limits of the terms of trade between Gamma and Sigma?
A) 1 tea = 2 pots to 1 tea = 6 pots
B) 1 tea = 3 pots to 1 tea = 6 pots
C) 1 tea = 2 pots to 1 tea = 3.5 pots
D) 1 tea = 1 pot to 1 tea = 3 pots
Unlock Deck
Unlock for access to all 181 flashcards in this deck.
Unlock Deck
k this deck
46
In the real world, specialization is rarely complete because:
A) nations normally experience increasing opportunity costs in producing more of the product in which they are specializing.
B) production possibilities curves are straight lines rather than curves bowed outward as viewed from the origin.
C) one nation's imports are necessarily another nation's exports.
D) international law prohibits monopolies.
Unlock Deck
Unlock for access to all 181 flashcards in this deck.
Unlock Deck
k this deck
47
Refer to the data below. Assume that before specialization and trade Gamma and Sigma both chose production possibility "C." Now if each specializes according to comparative advantage, the gains from specialization and trade will be: Production possibilities data for Gamma and Sigma. All data are in tons.
Gamma production possibilities: Sigma production possibilities:
A) 40 tons of pots.
B) 20 tons of tea and 20 tons of pots.
C) 20 tons of tea.
D) 40 tons of tea.
Gamma production possibilities:
Sigma production possibilities: A) 40 tons of pots.
B) 20 tons of tea and 20 tons of pots.
C) 20 tons of tea.
D) 40 tons of tea.
Unlock Deck
Unlock for access to all 181 flashcards in this deck.
Unlock Deck
k this deck
48
The data given is for two hypothetical nations, Wat and Xat. The nations have the Production Possibilities Curves (PPC) for units of rice and corn as given below.
Refer to the above data, in country Wat, the comparative cost of 1 unit of:
A) rice is 3 units of corn.
B) rice is 1/3 unit of corn and should not specialize in production of it if the two nations decide to trade with each other.
C) corn is 5 units of rice.
D) corn is 1/5 unit of rice.
Refer to the above data, in country Wat, the comparative cost of 1 unit of:
A) rice is 3 units of corn.
B) rice is 1/3 unit of corn and should not specialize in production of it if the two nations decide to trade with each other.
C) corn is 5 units of rice.
D) corn is 1/5 unit of rice.
Unlock Deck
Unlock for access to all 181 flashcards in this deck.
Unlock Deck
k this deck
49
The law of increasing opportunity costs:
A) applies to land-intensive commodities, but not to labour-intensive or capital-intensive commodities.
B) results in straight-line production possibilities curves rather than curves which are bowed outward as viewed from the origin.
C) refutes the principle of comparative advantage.
D) may limit the extent to which a nation specializes in producing a particular product.
Unlock Deck
Unlock for access to all 181 flashcards in this deck.
Unlock Deck
k this deck
50
Free trade based on comparative advantage is economically beneficial because:
A) it promotes an efficient allocation of world resources.
B) it increases competition.
C) it provides consumers with a wider range of products.
D) of all of the above reasons.
A) it promotes an efficient allocation of world resources.
B) it increases competition.
C) it provides consumers with a wider range of products.
D) of all of the above reasons.
Unlock Deck
Unlock for access to all 181 flashcards in this deck.
Unlock Deck
k this deck
51
The data given is for two hypothetical nations, Wat and Xat. The nations have the Production Possibilities Curves (PPC) for units of rice and corn as given below.
Refer to the diagram below in which, line AB is the Canadian production possibility curve and AC is its trading possibilities curve. We can conclude that Canada:
A) has chosen to specialize in the production of cheese.
B) has chosen to specialize in the production of beef.
C) has decided to trade beef for cheese.
D) is relatively more efficient than its trading partners in producing both cheese and beef.
Unlock Deck
Unlock for access to all 181 flashcards in this deck.
Unlock Deck
k this deck
52
Refer to the diagrams below. The solid lines are production possibilities curves; the dashed lines are trading possibilities curves. The trading possibilities curves suggest that the terms of trade are:
A) 1.5 beers for 1 pizza.
B) 1 beer for 2 pizzas.
C) 2 beers for 1 pizza.
D) 1 beer for 1.5 pizzas.
A) 1.5 beers for 1 pizza.
B) 1 beer for 2 pizzas.
C) 2 beers for 1 pizza.
D) 1 beer for 1.5 pizzas.
Unlock Deck
Unlock for access to all 181 flashcards in this deck.
Unlock Deck
k this deck
53
Production possibilities data for Gamma and Sigma. All data are in tons.
Gamma production possibilities:
Sigma production possibilities:
On the basis of the above information:
A) Gamma should export both tea and pots to Sigma.
B) Sigma should export tea to Gamma and Gamma should export pots to Sigma.
C) Gamma should export tea to Sigma and Sigma should export pots to Gamma.
D) Gamma should export tea to Sigma, but it will not be profitable for the two nations to exchange pots.
Gamma production possibilities:
Sigma production possibilities:On the basis of the above information:
A) Gamma should export both tea and pots to Sigma.
B) Sigma should export tea to Gamma and Gamma should export pots to Sigma.
C) Gamma should export tea to Sigma and Sigma should export pots to Gamma.
D) Gamma should export tea to Sigma, but it will not be profitable for the two nations to exchange pots.
Unlock Deck
Unlock for access to all 181 flashcards in this deck.
Unlock Deck
k this deck
54
The following information is about the cost ratios for two products-fish (F) and chicken (C)-in Singsong and Harmony. Assume that production occurs under conditions of constant costs and these are the only two nations in the world. If in Singsong: 1F = 2C and, in Harmony: 1F = 4C, which one of the following would not be feasible terms for trade between Singsong and Harmony?
A) 1 fish for 2 1/2 chicken
B) 1 fish for 3 chicken
C) 1 chicken for 1/5 of a fish
D) 1 chicken for 1/3 of a fish
A) 1 fish for 2 1/2 chicken
B) 1 fish for 3 chicken
C) 1 chicken for 1/5 of a fish
D) 1 chicken for 1/3 of a fish
Unlock Deck
Unlock for access to all 181 flashcards in this deck.
Unlock Deck
k this deck
55
Refer to the tables below. Which of the following would be feasible terms for trade between Latalia and Trombonia? Production possibilities tables for two countries, Latalia and Trombonia:
Latalia's production possibilities: Trombonia's production possibilities:
A) 1 ton of beans for 1 ton of pork
B) 2 tons of beans for 1 ton of pork
C) 6 tons of beans for 1 ton of pork
D) 4 tons of beans for 1 ton of pork
Latalia's production possibilities:
Trombonia's production possibilities: A) 1 ton of beans for 1 ton of pork
B) 2 tons of beans for 1 ton of pork
C) 6 tons of beans for 1 ton of pork
D) 4 tons of beans for 1 ton of pork
Unlock Deck
Unlock for access to all 181 flashcards in this deck.
Unlock Deck
k this deck
56
Production possibilities data for two countries, Alpha and Beta, which have populations of equal size.
Refer to the above data. Assume the production possibilities in Beta double at alternatives A through E while remaining as shown in the table for Alpha. As a result Beta should:
A) continue to specialize in producing chips.
B) continue to specialize in fishing.
C) no longer specialize and trade.
D) specialize both in fishing and in producing chips and sell the surplus to Alpha.
Unlock Deck
Unlock for access to all 181 flashcards in this deck.
Unlock Deck
k this deck
57
The "gain" from international trade is:
A) increased employment in the domestic export sector.
B) more goods than would be attainable through domestic production alone.
C) tariff revenue.
D) increased employment in the domestic import sector.
A) increased employment in the domestic export sector.
B) more goods than would be attainable through domestic production alone.
C) tariff revenue.
D) increased employment in the domestic import sector.
Unlock Deck
Unlock for access to all 181 flashcards in this deck.
Unlock Deck
k this deck
58
The data embodied in the below diagrams suggest that:
A) Italy should export X and Greece should export Y.
B) Greece should export X and Italy should export Y.
C) production in both countries is subject to increasing costs.
D) Italy should import both X and Y from Greece.
A) Italy should export X and Greece should export Y.
B) Greece should export X and Italy should export Y.
C) production in both countries is subject to increasing costs.
D) Italy should import both X and Y from Greece.
Unlock Deck
Unlock for access to all 181 flashcards in this deck.
Unlock Deck
k this deck
59
Refer to the diagrams below. Which of the following is a feasible rate at which X and Y might be exchanged?
A) 1X for 3Y
B) 1X for 1.5Y
C) 1X for 2.5Y
D) 1X for .5Y
A) 1X for 3Y
B) 1X for 1.5Y
C) 1X for 2.5Y
D) 1X for .5Y
Unlock Deck
Unlock for access to all 181 flashcards in this deck.
Unlock Deck
k this deck
60
Consider two countries which trade with each other. As these countries expand their production according to their comparative advantage, most probably they will experience:
A) constant costs.
B) high tariffs.
C) decreasing costs.
D) increasing costs.
A) constant costs.
B) high tariffs.
C) decreasing costs.
D) increasing costs.
Unlock Deck
Unlock for access to all 181 flashcards in this deck.
Unlock Deck
k this deck
61
Refer to the above diagram pertaining to two nations and a specific product. In equilibrium, the nation represented by lines FA and FC will:
A) export H to the country represented by lines GB and GD.
B) import H from the country represented by lines GB and GD.
C) pay price F for its imports.
D) receive price G for its exports.
Unlock Deck
Unlock for access to all 181 flashcards in this deck.
Unlock Deck
k this deck
62
In a two-nation model, the equilibrium world price will occur where:
A) one nation's export supply curve intersects the other nation's import demand curve.
B) both nations' exports are exactly twice the level of imports.
C) both nations' export supply curves are horizontal.
D) both nations' import demand curves are vertical.
A) one nation's export supply curve intersects the other nation's import demand curve.
B) both nations' exports are exactly twice the level of imports.
C) both nations' export supply curves are horizontal.
D) both nations' import demand curves are vertical.
Unlock Deck
Unlock for access to all 181 flashcards in this deck.
Unlock Deck
k this deck
63
Refer to the above diagram showing the domestic demand and supply curves for a specific standardized product in a particular nation. If the world price of this product is $1, this nation will:
A) export all of the product.
B) import all of the product.
C) import some of the product and produce some of the product domestically.
D) neither export nor import the product.
Unlock Deck
Unlock for access to all 181 flashcards in this deck.
Unlock Deck
k this deck
64
Refer to the above graph which shows the import demand and export supply curves for two nations that produce a product. The export supply curves for the two nations are represented by lines:
A) 5 and 7.
B) 5 and 6.
C) 6 and 8.
D) 7 and 8.
Unlock Deck
Unlock for access to all 181 flashcards in this deck.
Unlock Deck
k this deck
65
When the distribution of resources and technology changes among nations:
A) it costs more to produce all products.
B) the relative efficiency of producing products changes.
C) it costs less to produce all products.
D) each nation will specialize in producing one product.
A) it costs more to produce all products.
B) the relative efficiency of producing products changes.
C) it costs less to produce all products.
D) each nation will specialize in producing one product.
Unlock Deck
Unlock for access to all 181 flashcards in this deck.
Unlock Deck
k this deck
66
Refer to the above diagram pertaining to two nations and a specific product. Lines FA and GB are:
A) domestic supply curves for two countries.
B) domestic demand curves for two countries.
C) import demand curves for two countries.
D) export supply curves for two countries.
Unlock Deck
Unlock for access to all 181 flashcards in this deck.
Unlock Deck
k this deck
67
Suppose the domestic price of wheat is $3.50 per bushel in Canada, while the world price is $4.00 per bushel. Assuming no transportation costs, Canada will:
A) have a domestic shortage of wheat.
B) export wheat.
C) import wheat.
D) neither export nor import wheat.
A) have a domestic shortage of wheat.
B) export wheat.
C) import wheat.
D) neither export nor import wheat.
Unlock Deck
Unlock for access to all 181 flashcards in this deck.
Unlock Deck
k this deck
68
Refer to the above graph which shows the import demand and export supply curves for two nations that produce a product. The import demand curves for the two nations are represented by lines:
A) 5 and 6.
B) 5 and 7.
C) 6 and 8.
D) 7 and 8.
Unlock Deck
Unlock for access to all 181 flashcards in this deck.
Unlock Deck
k this deck
69
Refer to the above diagram showing the domestic demand and supply curves for a specific standardized product in a particular nation. If the world price for this product is $.50, this nation will experience a domestic:
A) shortage of 160 units, which it will meet with 160 units of imports.
B) shortage of 160 units, which will increase the domestic price to $1.60.
C) surplus of 160 units which it will export.
D) surplus of 160 units, which will reduce the world price to $1.00.
Unlock Deck
Unlock for access to all 181 flashcards in this deck.
Unlock Deck
k this deck
70
The data in the tables below, show that production in:
A) Germany is subject to increasing domestic opportunity costs and the U.S. to constant domestic opportunity costs.
B) the U.S. is subject to increasing domestic opportunity costs and Germany to constant domestic opportunity costs.
C) both Germany and the U.S. are subject to constant domestic opportunity costs.
D) both Germany and the U.S. are subject to increasing domestic opportunity costs.
Unlock Deck
Unlock for access to all 181 flashcards in this deck.
Unlock Deck
k this deck
71
Which statement is true?
A) Comparative advantage means that total world output will be greatest when each good is produced by the nation that has the highest domestic opportunity cost.
B) Comparative advantage means that total world output will decline when each good is produced by the nation with the lowest domestic opportunity cost.
C) Specialization is complete among nations when opportunity costs rise as any given nation produces more of a particular product.
D) Specialization is less than complete among nations when opportunity costs rise as any given nation produces more of a particular product.
Unlock Deck
Unlock for access to all 181 flashcards in this deck.
Unlock Deck
k this deck
72
Which is not commonly offered as a reason to support protectionism and abandon free trade?
A) maintaining military self-sufficiency
B) increasing domestic employment
C) allowing infant industries to mature and become competitive
D) promoting specialization and increasing worldwide production levels
A) maintaining military self-sufficiency
B) increasing domestic employment
C) allowing infant industries to mature and become competitive
D) promoting specialization and increasing worldwide production levels
Unlock Deck
Unlock for access to all 181 flashcards in this deck.
Unlock Deck
k this deck
73
Export supply curves are _____________; import demand curves are __________.
A) horizontal; vertical
B) vertical; horizontal
C) downsloping; upward sloping
D) upward sloping; downsloping
A) horizontal; vertical
B) vertical; horizontal
C) downsloping; upward sloping
D) upward sloping; downsloping
Unlock Deck
Unlock for access to all 181 flashcards in this deck.
Unlock Deck
k this deck
74
Suppose the domestic price of copper is $1.20 per kilogram in Canada, while the world price is $1.00 per kilogram. Assuming no transportation costs, Canada will:
A) have a domestic surplus of copper.
B) export copper.
C) import copper.
D) neither export nor import copper.
A) have a domestic surplus of copper.
B) export copper.
C) import copper.
D) neither export nor import copper.
Unlock Deck
Unlock for access to all 181 flashcards in this deck.
Unlock Deck
k this deck
75
A nation's export supply curve for a specific product:
A) is upward sloping.
B) shows the amount of the product it will export at prices below its domestic price.
C) lies below its import demand curve for the product.
D) depends on domestic supply of the product, but not on domestic demand.
A) is upward sloping.
B) shows the amount of the product it will export at prices below its domestic price.
C) lies below its import demand curve for the product.
D) depends on domestic supply of the product, but not on domestic demand.
Unlock Deck
Unlock for access to all 181 flashcards in this deck.
Unlock Deck
k this deck
76
Americans will neither export nor import aluminum when its:
A) domestic price equals the world price.
B) export supply curve lies above its import demand curve.
C) export supply curve is upward sloping.
D) import demand curve is downward sloping.
A) domestic price equals the world price.
B) export supply curve lies above its import demand curve.
C) export supply curve is upward sloping.
D) import demand curve is downward sloping.
Unlock Deck
Unlock for access to all 181 flashcards in this deck.
Unlock Deck
k this deck
77
Refer to the above diagram showing the domestic demand and supply curves for a specific standardized product in a particular nation. If the world price for this product is $1.60, this nation will experience a domestic:
A) shortage of 160 units, which it will meet with 160 units of imports.
B) shortage of 160 units, which will increase the domestic price to $1.60.
C) surplus of 160 units, which it will export.
D) surplus of 160 units, which will reduce the world price to $1.00.
Unlock Deck
Unlock for access to all 181 flashcards in this deck.
Unlock Deck
k this deck
78
Refer to the above diagram pertaining to two nations and a specific product. Lines FC and GD are:
A) domestic supply curves for two countries.
B) import demand curves for two countries.
C) domestic demand curves for two countries.
D) export supply curves for two countries.
Unlock Deck
Unlock for access to all 181 flashcards in this deck.
Unlock Deck
k this deck
79
A nation's import demand curve for a specific product:
A) is upsloping.
B) shows the amount of the product it will import at prices below its domestic price.
C) lies above its export supply curve for the product.
D) depends on domestic demand for the product, but not on domestic supply.
A) is upsloping.
B) shows the amount of the product it will import at prices below its domestic price.
C) lies above its export supply curve for the product.
D) depends on domestic demand for the product, but not on domestic supply.
Unlock Deck
Unlock for access to all 181 flashcards in this deck.
Unlock Deck
k this deck
80
Refer to the above diagram pertaining to two nations and a specific product. Point G is the:
A) domestic price for the nation represented by lines FA and FC.
B) world equilibrium price.
C) domestic price for the nation represented by lines GB and GD.
D) price above the world equilibrium price.
Unlock Deck
Unlock for access to all 181 flashcards in this deck.
Unlock Deck
k this deck
Unlock Deck
Unlock for access to all 181 flashcards in this deck.


