Deck 8: Basic Macroeconomic Relationships
Full screen (f)
Question
Question
Question
Question
Question
Question
Question
Question
Question
Question
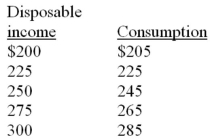
Which of the following equations correctly represents the data below? 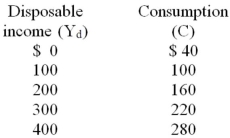
A) Yd = 40 + .6C
B) C = 60 + .4Yd
C) C = 40 + .6Yd
D) C = .6Yd
A) Yd = 40 + .6C
B) C = 60 + .4Yd
C) C = 40 + .6Yd
D) C = .6Yd
Question
Question
Question
Question
Question
Question
The consumption schedule in the diagram below indicates that: 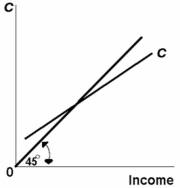
A) consumers will maximize their satisfaction where the consumption schedule and 45° line intersect.
B) up to a point consumption exceeds income, but then falls below income.
C) the MPC falls as income increases.
D) households consume as much as they earn.
A) consumers will maximize their satisfaction where the consumption schedule and 45° line intersect.
B) up to a point consumption exceeds income, but then falls below income.
C) the MPC falls as income increases.
D) households consume as much as they earn.
Question
Question
Question
Question
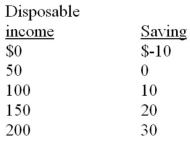
Refer to the data below. When plotted on a graph, the vertical intercept of the consumption schedule in this economy is _____ and the slope is _____. 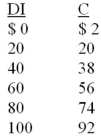
A) -2 and 1
B) $2 and .18
C) $100 and .5
D) $2 and .9
A) -2 and 1
B) $2 and .18
C) $100 and .5
D) $2 and .9
Question
Question
Question
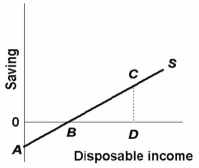
Refer to the above diagram. At disposable income level D, consumption:
A) is equal to CD.
B) is equal to OD minus CD.
C) is equal to CD/OD.
D) is equal to CD plus BD.
Question
Question
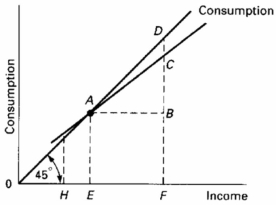
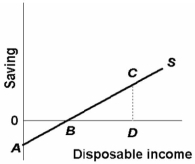
Refer to the above diagram. At income level F the volume of saving is:
A) BD.
B) AB.
C) CF - BF.
D) DC.
Question
Question
Refer to the above diagram. The break-even level of disposable income:
A) is zero.
B) is minus $10.
C) is $100.
D) cannot be determined from the information given.
Question
Question
Which of the following equations represents the saving schedule implicit in the data below? 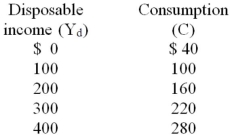
A) S = C - Yd
B) S = 40 + .4Yd
C) S = 40 + .6Yd
D) S = -40 + .4Yd
A) S = C - Yd
B) S = 40 + .4Yd
C) S = 40 + .6Yd
D) S = -40 + .4Yd
Question
Question
Question
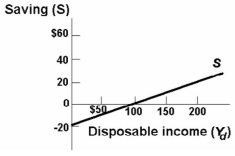
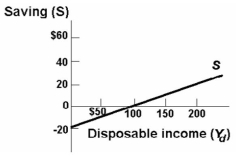
Refer to the above diagram. The break-even level of income is:
A) zero.
B) $150.
C) $60.
D) $120.
Question
Refer to the above diagram. The equation for the saving schedule is:
A) S = .6Y.
B) Y = 60 + .6S.
C) S = 60 + .4Y.
D) S = -60 + .4Y.
Question
Question
Question
Question
Question
Question
Question
Question
Following is consumption schedules for three private closed economies. DI signifies disposable income and C represents consumption expenditures. All figures are in billions of dollars.
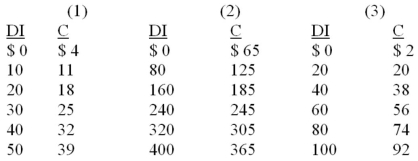
Refer to the above data. The marginal propensity to consume:
A) is highest in economy (1).
B) is highest in economy (3).
C) is highest in economy (2).
D) cannot be calculated from the data given.
Refer to the above data. The marginal propensity to consume:
A) is highest in economy (1).
B) is highest in economy (3).
C) is highest in economy (2).
D) cannot be calculated from the data given.
Question
Refer to the above data. At the $100 level of income, the average propensity to save is:
A) .10.
B) .20.
C) .25.
D) .90.
Question
Refer to the above data. The marginal propensity to consume is:
A) .80.
B) .75.
C) .20.
D) .25.
Question
Following is consumption schedules for three private closed economies. DI signifies disposable income and C represents consumption expenditures. All figures are in billions of dollars.
Refer to the above data. The marginal propensity to consume in economy (1):
A) is .5.
B) is .3.
C) is .8.
D) is .7.
Refer to the above data. The marginal propensity to consume in economy (1):
A) is .5.
B) is .3.
C) is .8.
D) is .7.
Question
Refer to the above data. At the $200 level of disposable income:
A) the marginal propensity to save is 21/2 percent.
B) dissaving is $5.
C) the average propensity to save is .20.
D) the average propensity to consume is .80.
Question
Refer to the above diagram. The marginal propensity to save is equal to:
A) CD/0D.
B) 0B/0A.
C) 0D/0D.
D) CD/BD.
Question
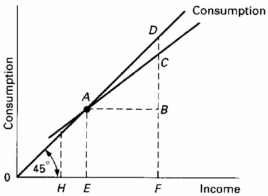
Refer to the above diagram. The marginal propensity to consume is equal to:
A) AE/0E.
B) CB/AB.
C) CF/CD.
D) CD/CF.
Question
Refer to the above data. The marginal propensity to consume is:
A) .25
B) .75.
C) .20.
D) .80.
Question
Question
Refer to the above data. The slope of the saving schedule is:
A) .80.
B) .10.
C) .20.
D) .15.
Question
Question
Refer to the above diagram. At disposable income level D, the average propensity to save is equal to:
A) CD/BD.
B) CD/OD.
C) OD/CD.
D) OA/OB.
Question
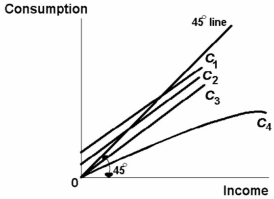
Refer to the above diagram. The MPC is constant as income rises for:
A) none of the consumption schedules shown.
B) C3 only.
C) C1, C2, and C3 only.
D) C4 only.
Question
Question
Refer to the above diagram. The marginal propensity to save is:
A) CD/EF.
B) CB/CF.
C) CB/AF.
D) EF/CB.
Question
Refer to the above diagram. The MPC and APC are both constant as income increases for:
A) none of the consumption schedules shown.
B) C3 only.
C) C3 and C4 only.
D) C1 and C2 only.
Question
Question
Refer to the above diagram. The APC diminishes as income increases for:
A) none of the consumption schedules shown.
B) C3 only.
C) C1, and C2.
D) C4 only.
Question
Question
Question
Refer to the above diagram. The marginal propensity to consume is:
A) .2.
B) .8.
C) .4.
D) .3.
Question
Question
Question
Question
Question
Following is consumption schedules for three private closed economies. DI signifies disposable income and C represents consumption expenditures. All figures are in billions of dollars.
Refer to the above data. The marginal propensity to save:
A) is highest in economy (1).
B) is highest in economy (2).
C) is highest in economy (3).
D) cannot be determined from the data given.
Refer to the above data. The marginal propensity to save:
A) is highest in economy (1).
B) is highest in economy (2).
C) is highest in economy (3).
D) cannot be determined from the data given.
Question
Following is consumption schedules for three private closed economies. DI signifies disposable income and C represents consumption expenditures. All figures are in billions of dollars.
Refer to the above data. Suppose that consumption increased by $2 billion at each level of DI in each of the three countries. We can conclude that the:
A) marginal propensity to consume will remain unchanged in each of the three countries.
B) marginal propensity to consume will decline in each of the three countries.
C) average propensity to save will fall at each level of DI in each of the three countries.
D) marginal propensity to save will rise in each of the three countries.
Question
Question
Question
Question
Question
Following is consumption schedules for three private closed economies. DI signifies disposable income and C represents consumption expenditures. All figures are in billions of dollars.
Refer to the above data. At an income level of $400 billion, the average propensity to save in economy (2) is:
A) .9125.
B) .0725.
C) .0875.
D) .9305.
Refer to the above data. At an income level of $400 billion, the average propensity to save in economy (2) is:
A) .9125.
B) .0725.
C) .0875.
D) .9305.
Question
Question
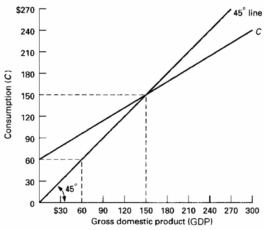
Refer to the above diagram. The average propensity to consume:
A) is greater than 1 at all levels of disposable income above $100.
B) is greater than 1 at all levels of disposable income below $100.
C) is equal to the average propensity to save.
D) cannot be determined from the information given.
Question
Question
Question
Question
Question
Following is consumption schedules for three private closed economies. DI signifies disposable income and C represents consumption expenditures. All figures are in billions of dollars.
Refer to the above data. At an income level of $40 billion, the average propensity to consume:
A) is highest in economy (1).
B) is highest in economy (2).
C) is highest in economy (3).
D) cannot be determined from the data given.
Refer to the above data. At an income level of $40 billion, the average propensity to consume:
A) is highest in economy (1).
B) is highest in economy (2).
C) is highest in economy (3).
D) cannot be determined from the data given.
Question
Refer to the data below. The MPS is: 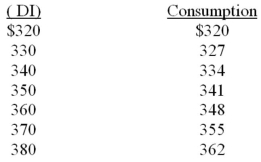
A) 7/10.
B) 3/10.
C) 2/5.
D) 3/5.
A) 7/10.
B) 3/10.
C) 2/5.
D) 3/5.

Unlock Deck
Sign up to unlock the cards in this deck!
Unlock Deck
Unlock Deck
1/188
Play
Full screen (f)
Deck 8: Basic Macroeconomic Relationships
1
The consumption schedule shows:
A) a direct relationship between aggregate consumption and accumulated wealth.
B) a direct relationship between aggregate consumption and aggregate income.
C) an inverse relationship between aggregate consumption and accumulated financial wealth.
D) an inverse relationship between aggregate consumption and aggregate income.
a direct relationship between aggregate consumption and aggregate income.
2
Given the consumption schedule, it is possible to graph the relevant saving schedule by:
A) subtracting the MPC from "one" at each level of income.
B) subtracting investment from consumption at each level of GDP.
C) plotting the horizontal differences between the consumption schedule and the 45-degree line.
D) plotting the vertical differences between the consumption schedule and the 45-degree line.
plotting the vertical differences between the consumption schedule and the 45-degree line.
3
The saving schedule is drawn on the assumption that as income increases:
A) saving will decline absolutely and as a percentage of income.
B) saving will increase absolutely, but remain constant as a percentage of income.
C) saving will increase absolutely, but decline as a percentage of income.
D) saving will increase absolutely and as a percentage of income.
A) saving will decline absolutely and as a percentage of income.
B) saving will increase absolutely, but remain constant as a percentage of income.
C) saving will increase absolutely, but decline as a percentage of income.
D) saving will increase absolutely and as a percentage of income.
saving will increase absolutely and as a percentage of income.
4
The equation C = 35 + .75Y, where C is consumption and Y is disposable income, tells us that:
A) households will consume three-fourths of whatever level of disposable income they receive.
B) households will consume $35 if their disposable income is zero and will consume three-fourths of any increase in disposable income they receive.
C) there is an inverse relationship between disposable income and consumption.
D) households will save $35 if their disposable income is zero and will consume three-fourths of any increase in disposable income they receive.
Unlock Deck
Unlock for access to all 188 flashcards in this deck.
Unlock Deck
k this deck
5
The consumption schedule shows:
A) that the MPC increases in proportion to GDP.
B) that households consume more when interest rates are low.
C) that consumption depends primarily upon the level of business investment.
D) the amounts households plan or intend to consume at various possible levels of aggregate income.
A) that the MPC increases in proportion to GDP.
B) that households consume more when interest rates are low.
C) that consumption depends primarily upon the level of business investment.
D) the amounts households plan or intend to consume at various possible levels of aggregate income.
Unlock Deck
Unlock for access to all 188 flashcards in this deck.
Unlock Deck
k this deck
6
If the MPC is .8 and the disposable income is $200, then
A) consumption and saving cannot be determined from the information given.
B) saving will be $20.
C) personal consumption expenditures will be $80.
D) saving will be $40.
A) consumption and saving cannot be determined from the information given.
B) saving will be $20.
C) personal consumption expenditures will be $80.
D) saving will be $40.
Unlock Deck
Unlock for access to all 188 flashcards in this deck.
Unlock Deck
k this deck
7
The 45-degree line on a chart relating consumption and income shows:
A) all points where the MPC is constant.
B) all points at which saving and income are equal.
C) all the points at which consumption and income are equal.
D) the amounts households will plan to save at each possible level of income.
A) all points where the MPC is constant.
B) all points at which saving and income are equal.
C) all the points at which consumption and income are equal.
D) the amounts households will plan to save at each possible level of income.
Unlock Deck
Unlock for access to all 188 flashcards in this deck.
Unlock Deck
k this deck
8
If the consumption schedule is linear, then the:
A) saving schedule will also be linear.
B) MPS will decline as income rises.
C) MPC will decline as income rises.
D) APC will be constant at all levels of income.
A) saving schedule will also be linear.
B) MPS will decline as income rises.
C) MPC will decline as income rises.
D) APC will be constant at all levels of income.
Unlock Deck
Unlock for access to all 188 flashcards in this deck.
Unlock Deck
k this deck
9
A decline in disposable income:
A) increases consumption by moving upward along a specific consumption schedule.
B) decreases consumption because it shifts the consumption schedule downward.
C) decreases consumption by moving downward along a specific consumption schedule.
D) increases consumption because it shifts the consumption schedule upward.
Unlock Deck
Unlock for access to all 188 flashcards in this deck.
Unlock Deck
k this deck
10
Which of the following equations correctly represents the data below?
A) Yd = 40 + .6C
B) C = 60 + .4Yd
C) C = 40 + .6Yd
D) C = .6Yd
A) Yd = 40 + .6C
B) C = 60 + .4Yd
C) C = 40 + .6Yd
D) C = .6Yd
Unlock Deck
Unlock for access to all 188 flashcards in this deck.
Unlock Deck
k this deck
11
The saving schedule is such that as aggregate income increases by a certain amount, saving:
A) increases by the same amount as the increase in income.
B) does not change.
C) increases.
D) decreases.
A) increases by the same amount as the increase in income.
B) does not change.
C) increases.
D) decreases.
Unlock Deck
Unlock for access to all 188 flashcards in this deck.
Unlock Deck
k this deck
12
The consumption schedule relates:
A) consumption to the level of disposable income.
B) saving to the level of disposable income.
C) disposable income to domestic income.
D) consumption to saving.
A) consumption to the level of disposable income.
B) saving to the level of disposable income.
C) disposable income to domestic income.
D) consumption to saving.
Unlock Deck
Unlock for access to all 188 flashcards in this deck.
Unlock Deck
k this deck
13
The relationship between consumption and disposable income is such that:
A) an inverse and stable relationship exists between consumption and income.
B) a direct, but very volatile, relationship exists between consumption and income.
C) a direct and quite stable relationship exists between consumption and income.
D) the two are always equal.
A) an inverse and stable relationship exists between consumption and income.
B) a direct, but very volatile, relationship exists between consumption and income.
C) a direct and quite stable relationship exists between consumption and income.
D) the two are always equal.
Unlock Deck
Unlock for access to all 188 flashcards in this deck.
Unlock Deck
k this deck
14
The most important determinant of consumption and saving is the:
A) level of bank credit.
B) level of disposable income.
C) interest rate.
D) price level.
A) level of bank credit.
B) level of disposable income.
C) interest rate.
D) price level.
Unlock Deck
Unlock for access to all 188 flashcards in this deck.
Unlock Deck
k this deck
15
The consumption schedule is drawn on the assumption that as disposable income increases consumption will:
A) be unaffected.
B) increase absolutely, but remain constant as a percentage of income.
C) increase absolutely, but decline as a percentage of income.
D) increase absolutely and as a percentage of income.
A) be unaffected.
B) increase absolutely, but remain constant as a percentage of income.
C) increase absolutely, but decline as a percentage of income.
D) increase absolutely and as a percentage of income.
Unlock Deck
Unlock for access to all 188 flashcards in this deck.
Unlock Deck
k this deck
16
The consumption schedule in the diagram below indicates that:
A) consumers will maximize their satisfaction where the consumption schedule and 45° line intersect.
B) up to a point consumption exceeds income, but then falls below income.
C) the MPC falls as income increases.
D) households consume as much as they earn.
A) consumers will maximize their satisfaction where the consumption schedule and 45° line intersect.
B) up to a point consumption exceeds income, but then falls below income.
C) the MPC falls as income increases.
D) households consume as much as they earn.
Unlock Deck
Unlock for access to all 188 flashcards in this deck.
Unlock Deck
k this deck
17
If the equation C = 20 + .6Y, where C is consumption and Y is disposable income, were graphed:
A) the vertical intercept would be +.6 and the slope would be +20.
B) it would reveal an inverse relationship between consumption and disposable income.
C) the vertical intercept would be negative, but consumption would increase as disposable income rises.
D) the vertical intercept would be +20 and the slope would be +.6.
Unlock Deck
Unlock for access to all 188 flashcards in this deck.
Unlock Deck
k this deck
18
As disposable income increases, consumption:
A) and saving both increase.
B) and saving both decrease.
C) decreases and saving increases.
D) increases and saving decreases.
A) and saving both increase.
B) and saving both decrease.
C) decreases and saving increases.
D) increases and saving decreases.
Unlock Deck
Unlock for access to all 188 flashcards in this deck.
Unlock Deck
k this deck
19
The most important determinant of consumer spending is:
A) the level of household debt.
B) consumer expectations.
C) the stock of wealth.
D) the level of disposable income.
A) the level of household debt.
B) consumer expectations.
C) the stock of wealth.
D) the level of disposable income.
Unlock Deck
Unlock for access to all 188 flashcards in this deck.
Unlock Deck
k this deck
20
Refer to the data below. When plotted on a graph, the vertical intercept of the consumption schedule in this economy is _____ and the slope is _____.
A) -2 and 1
B) $2 and .18
C) $100 and .5
D) $2 and .9
A) -2 and 1
B) $2 and .18
C) $100 and .5
D) $2 and .9
Unlock Deck
Unlock for access to all 188 flashcards in this deck.
Unlock Deck
k this deck
21
Dissaving occurs where:
A) income exceeds consumption.
B) saving exceeds consumption.
C) consumption exceeds income.
D) saving exceeds income.
A) income exceeds consumption.
B) saving exceeds consumption.
C) consumption exceeds income.
D) saving exceeds income.
Unlock Deck
Unlock for access to all 188 flashcards in this deck.
Unlock Deck
k this deck
22
One can determine the amount of consumption at any level of total income by:
A) multiplying total income by the slope of the consumption schedule.
B) multiplying total income by the APC.
C) subtracting the MPS from total income.
D) multiplying total income by the MPC.
A) multiplying total income by the slope of the consumption schedule.
B) multiplying total income by the APC.
C) subtracting the MPS from total income.
D) multiplying total income by the MPC.
Unlock Deck
Unlock for access to all 188 flashcards in this deck.
Unlock Deck
k this deck
23
Refer to the above diagram. At disposable income level D, consumption:
A) is equal to CD.
B) is equal to OD minus CD.
C) is equal to CD/OD.
D) is equal to CD plus BD.
Unlock Deck
Unlock for access to all 188 flashcards in this deck.
Unlock Deck
k this deck
24
As disposable income goes up the:
A) APC falls.
B) APS falls.
C) volume of consumption declines absolutely.
D) volume of investment can be expected to diminish.
A) APC falls.
B) APS falls.
C) volume of consumption declines absolutely.
D) volume of investment can be expected to diminish.
Unlock Deck
Unlock for access to all 188 flashcards in this deck.
Unlock Deck
k this deck
25
Refer to the above diagram. At income level F the volume of saving is:
A) BD.
B) AB.
C) CF - BF.
D) DC.
Unlock Deck
Unlock for access to all 188 flashcards in this deck.
Unlock Deck
k this deck
26
The APC can be defined as the fraction of a:
A) change in income which is not spent.
B) change in income which is spent.
C) specific level of total income which is not consumed.
D) specific level of total income which is consumed.
A) change in income which is not spent.
B) change in income which is spent.
C) specific level of total income which is not consumed.
D) specific level of total income which is consumed.
Unlock Deck
Unlock for access to all 188 flashcards in this deck.
Unlock Deck
k this deck
27
Refer to the above diagram. The break-even level of disposable income:
A) is zero.
B) is minus $10.
C) is $100.
D) cannot be determined from the information given.
Unlock Deck
Unlock for access to all 188 flashcards in this deck.
Unlock Deck
k this deck
28
If the equation for the consumption schedule is C = 20 + 0.8Y, where C is consumption and Y is disposable income, then the average propensity to consume is 1 when disposable income is:
A) $80.
B) $100.
C) $120.
D) $160.
A) $80.
B) $100.
C) $120.
D) $160.
Unlock Deck
Unlock for access to all 188 flashcards in this deck.
Unlock Deck
k this deck
29
Which of the following equations represents the saving schedule implicit in the data below?
A) S = C - Yd
B) S = 40 + .4Yd
C) S = 40 + .6Yd
D) S = -40 + .4Yd
A) S = C - Yd
B) S = 40 + .4Yd
C) S = 40 + .6Yd
D) S = -40 + .4Yd
Unlock Deck
Unlock for access to all 188 flashcards in this deck.
Unlock Deck
k this deck
30
At the point where the consumption schedule intersects the 45-degree line:
A) the MPC is 1.00.
B) the APC is 1.00.
C) saving is equal to consumption.
D) the economy is in equilibrium.
A) the MPC is 1.00.
B) the APC is 1.00.
C) saving is equal to consumption.
D) the economy is in equilibrium.
Unlock Deck
Unlock for access to all 188 flashcards in this deck.
Unlock Deck
k this deck
31
The average propensity to consume indicates the:
A) amount by which income exceeds consumption.
B) relationship between a change in saving and the consequent change in consumption.
C) percentage of total income which will be consumed.
D) percentage of a change in income which will be consumed.
A) amount by which income exceeds consumption.
B) relationship between a change in saving and the consequent change in consumption.
C) percentage of total income which will be consumed.
D) percentage of a change in income which will be consumed.
Unlock Deck
Unlock for access to all 188 flashcards in this deck.
Unlock Deck
k this deck
32
Refer to the above diagram. The break-even level of income is:
A) zero.
B) $150.
C) $60.
D) $120.
Unlock Deck
Unlock for access to all 188 flashcards in this deck.
Unlock Deck
k this deck
33
Refer to the above diagram. The equation for the saving schedule is:
A) S = .6Y.
B) Y = 60 + .6S.
C) S = 60 + .4Y.
D) S = -60 + .4Y.
Unlock Deck
Unlock for access to all 188 flashcards in this deck.
Unlock Deck
k this deck
34
At the point where the consumption schedule intersects the 45-degree line:
A) the MPC equals 1.
B) the APC is zero.
C) saving equals income.
D) saving is zero.
A) the MPC equals 1.
B) the APC is zero.
C) saving equals income.
D) saving is zero.
Unlock Deck
Unlock for access to all 188 flashcards in this deck.
Unlock Deck
k this deck
35
The equation for the above saving schedule is:
A) Yd = -20 + .8S.
B) Yd = 20 + .2S.
C) S = 20 + .8Yd.
D) S = -20 + .2Yd.
A) Yd = -20 + .8S.
B) Yd = 20 + .2S.
C) S = 20 + .8Yd.
D) S = -20 + .2Yd.
Unlock Deck
Unlock for access to all 188 flashcards in this deck.
Unlock Deck
k this deck
36
As aggregate income decreases, the APC:
A) and APS will both increase.
B) will decrease, but the APS will increase.
C) will increase, but the APS will decrease.
D) and APS will both decrease.
A) and APS will both increase.
B) will decrease, but the APS will increase.
C) will increase, but the APS will decrease.
D) and APS will both decrease.
Unlock Deck
Unlock for access to all 188 flashcards in this deck.
Unlock Deck
k this deck
37
Suppose a family's consumption exceeds its disposable income. This means that its:
A) MPC is greater than 1.
B) MPS is negative.
C) APC is greater than 1.
D) APS is positive.
A) MPC is greater than 1.
B) MPS is negative.
C) APC is greater than 1.
D) APS is positive.
Unlock Deck
Unlock for access to all 188 flashcards in this deck.
Unlock Deck
k this deck
38
The APC can be defined as:
A) change in consumption/change in income
B) consumption/income
C) change in income/change in consumption
D) income/consumption
A) change in consumption/change in income
B) consumption/income
C) change in income/change in consumption
D) income/consumption
Unlock Deck
Unlock for access to all 188 flashcards in this deck.
Unlock Deck
k this deck
39
For all levels of income to the left of the intersection of the 45-degree line and the consumption schedule, the APC is:
A) greater than 100 percent.
B) less than the APS.
C) equal to the MPC.
D) equal to 100 percent.
A) greater than 100 percent.
B) less than the APS.
C) equal to the MPC.
D) equal to 100 percent.
Unlock Deck
Unlock for access to all 188 flashcards in this deck.
Unlock Deck
k this deck
40
Dissaving means:
A) the same thing as disinvesting.
B) that households are spending in excess of their current incomes.
C) that saving and investment are equal.
D) that disposable income is less than zero.
A) the same thing as disinvesting.
B) that households are spending in excess of their current incomes.
C) that saving and investment are equal.
D) that disposable income is less than zero.
Unlock Deck
Unlock for access to all 188 flashcards in this deck.
Unlock Deck
k this deck
41
Following is consumption schedules for three private closed economies. DI signifies disposable income and C represents consumption expenditures. All figures are in billions of dollars.
Refer to the above data. The marginal propensity to consume:
A) is highest in economy (1).
B) is highest in economy (3).
C) is highest in economy (2).
D) cannot be calculated from the data given.
Refer to the above data. The marginal propensity to consume:
A) is highest in economy (1).
B) is highest in economy (3).
C) is highest in economy (2).
D) cannot be calculated from the data given.
Unlock Deck
Unlock for access to all 188 flashcards in this deck.
Unlock Deck
k this deck
42
Refer to the above data. At the $100 level of income, the average propensity to save is:
A) .10.
B) .20.
C) .25.
D) .90.
Unlock Deck
Unlock for access to all 188 flashcards in this deck.
Unlock Deck
k this deck
43
Refer to the above data. The marginal propensity to consume is:
A) .80.
B) .75.
C) .20.
D) .25.
Unlock Deck
Unlock for access to all 188 flashcards in this deck.
Unlock Deck
k this deck
44
Following is consumption schedules for three private closed economies. DI signifies disposable income and C represents consumption expenditures. All figures are in billions of dollars.
Refer to the above data. The marginal propensity to consume in economy (1):
A) is .5.
B) is .3.
C) is .8.
D) is .7.
Refer to the above data. The marginal propensity to consume in economy (1):
A) is .5.
B) is .3.
C) is .8.
D) is .7.
Unlock Deck
Unlock for access to all 188 flashcards in this deck.
Unlock Deck
k this deck
45
Refer to the above data. At the $200 level of disposable income:
A) the marginal propensity to save is 21/2 percent.
B) dissaving is $5.
C) the average propensity to save is .20.
D) the average propensity to consume is .80.
Unlock Deck
Unlock for access to all 188 flashcards in this deck.
Unlock Deck
k this deck
46
Refer to the above diagram. The marginal propensity to save is equal to:
A) CD/0D.
B) 0B/0A.
C) 0D/0D.
D) CD/BD.
Unlock Deck
Unlock for access to all 188 flashcards in this deck.
Unlock Deck
k this deck
47
Refer to the above diagram. The marginal propensity to consume is equal to:
A) AE/0E.
B) CB/AB.
C) CF/CD.
D) CD/CF.
Unlock Deck
Unlock for access to all 188 flashcards in this deck.
Unlock Deck
k this deck
48
Refer to the above data. The marginal propensity to consume is:
A) .25
B) .75.
C) .20.
D) .80.
Unlock Deck
Unlock for access to all 188 flashcards in this deck.
Unlock Deck
k this deck
49
The MPC can be defined as the fraction of a:
A) change in income which is not spent.
B) change in income which is spent.
C) given total income which is not consumed.
D) given total income which is consumed.
A) change in income which is not spent.
B) change in income which is spent.
C) given total income which is not consumed.
D) given total income which is consumed.
Unlock Deck
Unlock for access to all 188 flashcards in this deck.
Unlock Deck
k this deck
50
Refer to the above data. The slope of the saving schedule is:
A) .80.
B) .10.
C) .20.
D) .15.
Unlock Deck
Unlock for access to all 188 flashcards in this deck.
Unlock Deck
k this deck
51
As aggregate income increases, the APC:
A) and APS will both increase.
B) will decrease, but the APS will increase.
C) will increase, but the APS will decrease.
D) and APS will both decrease.
A) and APS will both increase.
B) will decrease, but the APS will increase.
C) will increase, but the APS will decrease.
D) and APS will both decrease.
Unlock Deck
Unlock for access to all 188 flashcards in this deck.
Unlock Deck
k this deck
52
Refer to the above diagram. At disposable income level D, the average propensity to save is equal to:
A) CD/BD.
B) CD/OD.
C) OD/CD.
D) OA/OB.
Unlock Deck
Unlock for access to all 188 flashcards in this deck.
Unlock Deck
k this deck
53
Refer to the above diagram. The MPC is constant as income rises for:
A) none of the consumption schedules shown.
B) C3 only.
C) C1, C2, and C3 only.
D) C4 only.
Unlock Deck
Unlock for access to all 188 flashcards in this deck.
Unlock Deck
k this deck
54
If Ben's MPC is .80, this means that he will:
A) spend eight-tenths of any increase in his disposable income.
B) spend eight-tenths of any level of disposable income.
C) break even when his disposable income is $8,000.
D) save eight-tenths of any level of disposable income.
A) spend eight-tenths of any increase in his disposable income.
B) spend eight-tenths of any level of disposable income.
C) break even when his disposable income is $8,000.
D) save eight-tenths of any level of disposable income.
Unlock Deck
Unlock for access to all 188 flashcards in this deck.
Unlock Deck
k this deck
55
Refer to the above diagram. The marginal propensity to save is:
A) CD/EF.
B) CB/CF.
C) CB/AF.
D) EF/CB.
Unlock Deck
Unlock for access to all 188 flashcards in this deck.
Unlock Deck
k this deck
56
Refer to the above diagram. The MPC and APC are both constant as income increases for:
A) none of the consumption schedules shown.
B) C3 only.
C) C3 and C4 only.
D) C1 and C2 only.
Unlock Deck
Unlock for access to all 188 flashcards in this deck.
Unlock Deck
k this deck
57
If Smith's disposable income increases from $1,200 to $1,700 and her level of saving increases from minus $100 to a plus $100, it may be concluded that her marginal propensity to:
A) save is three-fifths.
B) consume is one-half.
C) consume is three-fifths.
D) consume is one-sixth.
A) save is three-fifths.
B) consume is one-half.
C) consume is three-fifths.
D) consume is one-sixth.
Unlock Deck
Unlock for access to all 188 flashcards in this deck.
Unlock Deck
k this deck
58
Refer to the above diagram. The APC diminishes as income increases for:
A) none of the consumption schedules shown.
B) C3 only.
C) C1, and C2.
D) C4 only.
Unlock Deck
Unlock for access to all 188 flashcards in this deck.
Unlock Deck
k this deck
59
With an MPS of .4, the MPC will be:
A) 1.0 minus .4.
B) .4 minus 1.0.
C) the reciprocal of the MPS.
D) .4.
A) 1.0 minus .4.
B) .4 minus 1.0.
C) the reciprocal of the MPS.
D) .4.
Unlock Deck
Unlock for access to all 188 flashcards in this deck.
Unlock Deck
k this deck
60
Holly's break-even level of income is $10,000 and her MPC is 0.75. If her actual disposable income is $16,000, her level of:
A) consumption spending will be $14,500.
B) consumption spending will be $4,500.
C) consumption spending will be $13,000.
D) saving will be $2,500.
A) consumption spending will be $14,500.
B) consumption spending will be $4,500.
C) consumption spending will be $13,000.
D) saving will be $2,500.
Unlock Deck
Unlock for access to all 188 flashcards in this deck.
Unlock Deck
k this deck
61
Refer to the above diagram. The marginal propensity to consume is:
A) .2.
B) .8.
C) .4.
D) .3.
Unlock Deck
Unlock for access to all 188 flashcards in this deck.
Unlock Deck
k this deck
62
Suppose the consumption schedule is: C = 20 + .9Y, where C is consumption and Y is disposable income.
Refer to the above data. The MPC is:
A) .45.
B) .20.
C) .50.
D) .90.
Refer to the above data. The MPC is:
A) .45.
B) .20.
C) .50.
D) .90.
Unlock Deck
Unlock for access to all 188 flashcards in this deck.
Unlock Deck
k this deck
63
Which of the following is correct?
A) APC + APS = 1.
B) APC + MPS = 1.
C) APS + MPC = 1.
D) APS + MPS = 1.
A) APC + APS = 1.
B) APC + MPS = 1.
C) APS + MPC = 1.
D) APS + MPS = 1.
Unlock Deck
Unlock for access to all 188 flashcards in this deck.
Unlock Deck
k this deck
64
Which one of the following will cause a movement down along an economy's consumption schedule?
A) an increase in stock prices
B) a decrease in stock prices
C) an increase in consumer indebtedness
D) a decrease in disposable income
A) an increase in stock prices
B) a decrease in stock prices
C) an increase in consumer indebtedness
D) a decrease in disposable income
Unlock Deck
Unlock for access to all 188 flashcards in this deck.
Unlock Deck
k this deck
65
Which of the following relations is not correct?
A) 1 - MPC = MPS
B) MPS = MPC + 1
C) APS + APC = 1
D) MPC + MPS = 1
A) 1 - MPC = MPS
B) MPS = MPC + 1
C) APS + APC = 1
D) MPC + MPS = 1
Unlock Deck
Unlock for access to all 188 flashcards in this deck.
Unlock Deck
k this deck
66
Following is consumption schedules for three private closed economies. DI signifies disposable income and C represents consumption expenditures. All figures are in billions of dollars.
Refer to the above data. The marginal propensity to save:
A) is highest in economy (1).
B) is highest in economy (2).
C) is highest in economy (3).
D) cannot be determined from the data given.
Refer to the above data. The marginal propensity to save:
A) is highest in economy (1).
B) is highest in economy (2).
C) is highest in economy (3).
D) cannot be determined from the data given.
Unlock Deck
Unlock for access to all 188 flashcards in this deck.
Unlock Deck
k this deck
67
Following is consumption schedules for three private closed economies. DI signifies disposable income and C represents consumption expenditures. All figures are in billions of dollars.
Refer to the above data. Suppose that consumption increased by $2 billion at each level of DI in each of the three countries. We can conclude that the:
A) marginal propensity to consume will remain unchanged in each of the three countries.
B) marginal propensity to consume will decline in each of the three countries.
C) average propensity to save will fall at each level of DI in each of the three countries.
D) marginal propensity to save will rise in each of the three countries.
Unlock Deck
Unlock for access to all 188 flashcards in this deck.
Unlock Deck
k this deck
68
Which one of the following will cause a movement up along an economy's saving schedule?
A) an increase in household debt outstanding
B) an increase in disposable income
C) an increase in stock prices
D) an increase in interest rates
A) an increase in household debt outstanding
B) an increase in disposable income
C) an increase in stock prices
D) an increase in interest rates
Unlock Deck
Unlock for access to all 188 flashcards in this deck.
Unlock Deck
k this deck
69
The MPC for an economy is:
A) the slope of the consumption schedule or line.
B) the slope of the savings schedule or line.
C) 1 divided by the slope of the consumption schedule or line.
D) 1 divided by the slope of the savings schedule or line.
A) the slope of the consumption schedule or line.
B) the slope of the savings schedule or line.
C) 1 divided by the slope of the consumption schedule or line.
D) 1 divided by the slope of the savings schedule or line.
Unlock Deck
Unlock for access to all 188 flashcards in this deck.
Unlock Deck
k this deck
70
The consumption schedule is such that:
A) both the APC and the MPC increase as income rises.
B) the APC is constant and the MPC declines as income rises.
C) the MPC is constant and the APC declines as income rises.
D) the MPC and APC must be equal at all levels of income.
A) both the APC and the MPC increase as income rises.
B) the APC is constant and the MPC declines as income rises.
C) the MPC is constant and the APC declines as income rises.
D) the MPC and APC must be equal at all levels of income.
Unlock Deck
Unlock for access to all 188 flashcards in this deck.
Unlock Deck
k this deck
71
The greater is the marginal propensity to consume:
A) the smaller is the marginal propensity to save.
B) the higher is the interest rate.
C) the lower is the average propensity to consume.
D) the lower is the price level.
A) the smaller is the marginal propensity to save.
B) the higher is the interest rate.
C) the lower is the average propensity to consume.
D) the lower is the price level.
Unlock Deck
Unlock for access to all 188 flashcards in this deck.
Unlock Deck
k this deck
72
Following is consumption schedules for three private closed economies. DI signifies disposable income and C represents consumption expenditures. All figures are in billions of dollars.
Refer to the above data. At an income level of $400 billion, the average propensity to save in economy (2) is:
A) .9125.
B) .0725.
C) .0875.
D) .9305.
Refer to the above data. At an income level of $400 billion, the average propensity to save in economy (2) is:
A) .9125.
B) .0725.
C) .0875.
D) .9305.
Unlock Deck
Unlock for access to all 188 flashcards in this deck.
Unlock Deck
k this deck
73
Which of the following is correct?
A) MPC + MPS = APC + APS
B) APC + MPS = APS + MPC
C) APC + MPC = APS + MPS
D) APC - APS = MPC - MPS
A) MPC + MPS = APC + APS
B) APC + MPS = APS + MPC
C) APC + MPC = APS + MPS
D) APC - APS = MPC - MPS
Unlock Deck
Unlock for access to all 188 flashcards in this deck.
Unlock Deck
k this deck
74
Refer to the above diagram. The average propensity to consume:
A) is greater than 1 at all levels of disposable income above $100.
B) is greater than 1 at all levels of disposable income below $100.
C) is equal to the average propensity to save.
D) cannot be determined from the information given.
Unlock Deck
Unlock for access to all 188 flashcards in this deck.
Unlock Deck
k this deck
75
If the marginal propensity to consume is .9, then the marginal propensity to save must be:
A) 1.
B) .1.
C) 1.1.
D) .9.
A) 1.
B) .1.
C) 1.1.
D) .9.
Unlock Deck
Unlock for access to all 188 flashcards in this deck.
Unlock Deck
k this deck
76
If the saving schedule is a straight line, the:
A) MPS must be constant.
B) APS must be constant.
C) APC must be constant.
D) MPC must be rising.
A) MPS must be constant.
B) APS must be constant.
C) APC must be constant.
D) MPC must be rising.
Unlock Deck
Unlock for access to all 188 flashcards in this deck.
Unlock Deck
k this deck
77
Which of the following will not cause the consumption schedule to shift?
A) a sharp increase in the amount of wealth held by households
B) a change in consumer incomes
C) the expectation of a recession
D) a growing expectation that consumer durables will be in short supply
A) a sharp increase in the amount of wealth held by households
B) a change in consumer incomes
C) the expectation of a recession
D) a growing expectation that consumer durables will be in short supply
Unlock Deck
Unlock for access to all 188 flashcards in this deck.
Unlock Deck
k this deck
78
Suppose the consumption schedule is: C = 20 + .9Y, where C is consumption and Y is disposable income.
Refer to the above data. At an $800 level of disposable income, the level of saving is:
A) $180.
B) $740.
C) $60.
D) $18.
Refer to the above data. At an $800 level of disposable income, the level of saving is:
A) $180.
B) $740.
C) $60.
D) $18.
Unlock Deck
Unlock for access to all 188 flashcards in this deck.
Unlock Deck
k this deck
79
Following is consumption schedules for three private closed economies. DI signifies disposable income and C represents consumption expenditures. All figures are in billions of dollars.
Refer to the above data. At an income level of $40 billion, the average propensity to consume:
A) is highest in economy (1).
B) is highest in economy (2).
C) is highest in economy (3).
D) cannot be determined from the data given.
Refer to the above data. At an income level of $40 billion, the average propensity to consume:
A) is highest in economy (1).
B) is highest in economy (2).
C) is highest in economy (3).
D) cannot be determined from the data given.
Unlock Deck
Unlock for access to all 188 flashcards in this deck.
Unlock Deck
k this deck
80
Refer to the data below. The MPS is:
A) 7/10.
B) 3/10.
C) 2/5.
D) 3/5.
A) 7/10.
B) 3/10.
C) 2/5.
D) 3/5.
Unlock Deck
Unlock for access to all 188 flashcards in this deck.
Unlock Deck
k this deck
Unlock Deck
Unlock for access to all 188 flashcards in this deck.


