Deck 11: Time Series Forecasting
Full screen (f)
Question
What is the correct form of the exponential smoothing model?
A)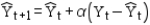
B)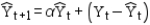
C)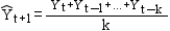
D)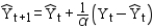
A)
B)
C)
D)
Question
Exhibit 11.9
The following questions use the data below.
Joe's Sporting Goods wants to forecast quarterly sales figures using a linear trend model. The store has collected 12 quarters of data and needs your help to analyze the data. The relevant regression output is in the following table.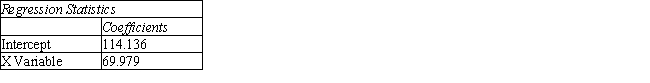

Refer to Exhibit 11.9. What is the Input X Range in the Regression command settings dialog box?
A) B3:B14
B) C3:C14
C) D3:D14
D) B3:D14
The following questions use the data below.
Joe's Sporting Goods wants to forecast quarterly sales figures using a linear trend model. The store has collected 12 quarters of data and needs your help to analyze the data. The relevant regression output is in the following table.
Refer to Exhibit 11.9. What is the Input X Range in the Regression command settings dialog box?
A) B3:B14
B) C3:C14
C) D3:D14
D) B3:D14
Question
Question
Question
Question
Exhibit 11.6
The following questions use the data below.
A store wants to predict quarterly sales. The owner has collected 3 years of sales data and wants your help in analyzing the data using the double moving average model with k = 4.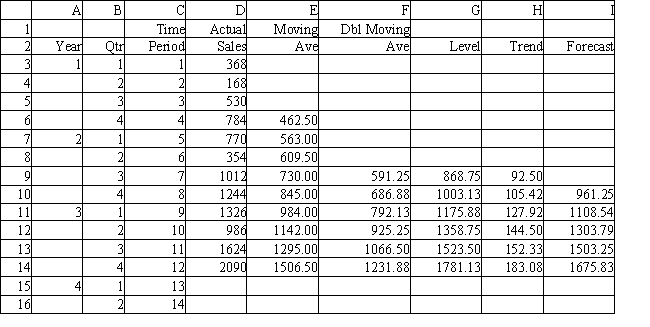
Refer to Exhibit 11.6. What formula should be entered in cell E6 (and copied to E7:E14) to compute the first average when using the double moving average method with k = 4?
A) =Average($E$3:$E$6)
B) =Average($D$3:$D$6)
C) =Average(D3:D6)
D) =Average(D5:D6)
Question
Question
Exhibit 11.1
The following questions use the data below.
Honest Al's Used Cars wants to predict how many cars are sold each month. He has collected data for 12 months. He needs your help in analyzing this data using moving averages.
Refer to Exhibit 11.1. What Excel function will compute the root mean squared error in cell C18 of the spreadsheet?
A) =SUMXMY2(B7:B14,C7:C14)
B) =SQRT(SUMXMY2(B3:B14,C3:C14)/COUNT(C3:C14))
C) =SUMXMY2(B7:B14,C7:C14)/COUNT(C7:C14)
D) =SQRT(SUMPRODUCT(B7:B14,C7:C14)/COUNT(C7:C14))
Question
Question
Question
Question
Question
Exhibit 11.1
The following questions use the data below.
Honest Al's Used Cars wants to predict how many cars are sold each month. He has collected data for 12 months. He needs your help in analyzing this data using moving averages.
Refer to Exhibit 11.1. What Excel function will compute the mean squared error in cell C18 of the spreadsheet?
A) =SUMXMY2(B7:B14,C7:C14)
B) =SUMXMY2(B3:B14,C3:C14)/COUNT(C3:C14)
C) =SUMXMY2(B7:B14,C7:C14)/COUNT(C7:C14)
D) =SUMPRODUCT(B7:B14,C7:C14)/COUNT(C7:C14)
Question
Exhibit 11.8
The following questions use the data below.
Joe's Sporting Goods wants to forecast quarterly sales figures using Winter's method. The store has collected 12 quarters of data and needs your help to analyze the data.
Refer to Exhibit 11.8. What formula should be entered in cell F7 to compute the Trend value for year 2 Quarter 1?
A) =$D$18*(E6-E7)+(1-$D$18)*F6
B) =$D$18*(E7-E6)+$D$18*F6
C) =$D$18*(E7-E6)+(1-$D$18)*F6
D) =$D$18*(E7-E6)*(1-$D$18)
Question
Question
Exhibit 11.12
The following questions use the data below.
Joe's Sporting Goods wants to forecast quarterly sales figures using a seasonal regression model. The store has collected 12 quarters of data and needs your help to analyze the data. The relevant regression output is provided in the following table.

Refer to Exhibit 11.12. What are predicted sales for the first quarter of year 4?
A) 1155 ≤ predicted sales < 1160
B) 1065 ≤ predicted sales < 1070
C) 1410 ≤ predicted sales < 1415
D) 1635 ≤ predicted sales < 1640
The following questions use the data below.
Joe's Sporting Goods wants to forecast quarterly sales figures using a seasonal regression model. The store has collected 12 quarters of data and needs your help to analyze the data. The relevant regression output is provided in the following table.
Refer to Exhibit 11.12. What are predicted sales for the first quarter of year 4?
A) 1155 ≤ predicted sales < 1160
B) 1065 ≤ predicted sales < 1070
C) 1410 ≤ predicted sales < 1415
D) 1635 ≤ predicted sales < 1640
Question
Exhibit 11.11
The following questions use the data below.
Joe's Sporting Goods wants to forecast quarterly sales figures using seasonal indices. The store has collected 12 quarters of data and needs your help to analyze the data. The relevant regression output is in the following table.

Refer to Exhibit 11.11. What formula should be entered in cell C18 to compute the Seasonal Index value for quarter 1?
A) =SUM($B$3:$B$14)/COUNTIF($B$3:$B$14,B18)
B) =SUMIF($B$3:$B$14,B18,$G$3:$G$14)/COUNTIF($B$3:$B$14,B18)
C) =SUMIF($B$3:$B$14,$G$3:$G$14)/COUNT($B$3:$B$14,B18)
D) =SUMIF($B$3:$B$14,B18)/COUNTIF($B$3:$B$14,B18)
The following questions use the data below.
Joe's Sporting Goods wants to forecast quarterly sales figures using seasonal indices. The store has collected 12 quarters of data and needs your help to analyze the data. The relevant regression output is in the following table.
Refer to Exhibit 11.11. What formula should be entered in cell C18 to compute the Seasonal Index value for quarter 1?
A) =SUM($B$3:$B$14)/COUNTIF($B$3:$B$14,B18)
B) =SUMIF($B$3:$B$14,B18,$G$3:$G$14)/COUNTIF($B$3:$B$14,B18)
C) =SUMIF($B$3:$B$14,$G$3:$G$14)/COUNT($B$3:$B$14,B18)
D) =SUMIF($B$3:$B$14,B18)/COUNTIF($B$3:$B$14,B18)
Question
Exhibit 11.2
The following questions use the data below.
Honest Al's Used Cars wants to predict how many cars are sold each month. He has collected data for 12 months. He needs your help in analyzing this data using weighted moving averages.
Refer to Exhibit 11.2. What formula should be entered in cell C6 to compute the 2-month weighted moving average forecast for month 3?
A) =F3*B4+F4*B3
B) =$F$3*B4+$F$4*B3
C) =(B3+B4)/2
D) =SUMPRODUCT($F$3:$F$4,B3:B4)
Question
Question
Exhibit 11.7
The following questions use the data below.
Joe's Sporting Goods wants to forecast quarterly sales figures using Holt's method. The store has collected 12 quarters of data and needs your help to analyze the data.
Refer to Exhibit 11.7. What formula should be entered in cell F4 to compute the trend when using Holt's method?
A) =$J$3*D4+(1-$J$3)*(E3+F3)
B) =$J$4*(E4-E3)+(1-$J$4)*F3
C) =$J$4*(E4-E3)+(1-$J$4)*G3
D) =$J$4*G3+(1-$J$4)*(D3+G3)
Question
Exhibit 11.8
The following questions use the data below.
Joe's Sporting Goods wants to forecast quarterly sales figures using Winter's method. The store has collected 12 quarters of data and needs your help to analyze the data.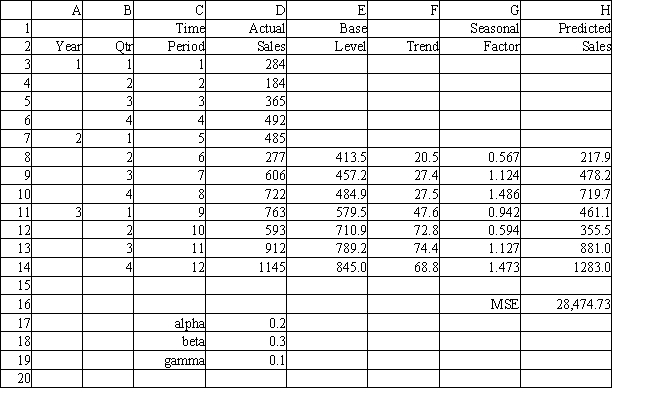
Refer to Exhibit 11.8. What formula should be entered in cell H7 to compute the Predicted Sales value for year 2 Quarter 1?
A) =SUM(E6:F6)*G3
B) =SUM(E6:F6)+G3
C) =SUM(E6:F6)
D) =SUM(E6:G3)
Question
Question
Question
Exhibit 11.12
The following questions use the data below.
Joe's Sporting Goods wants to forecast quarterly sales figures using a seasonal regression model. The store has collected 12 quarters of data and needs your help to analyze the data. The relevant regression output is provided in the following table.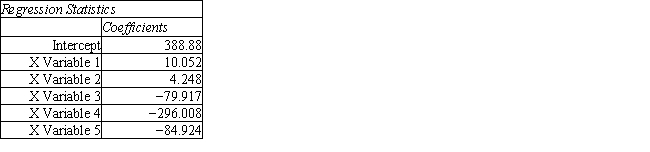
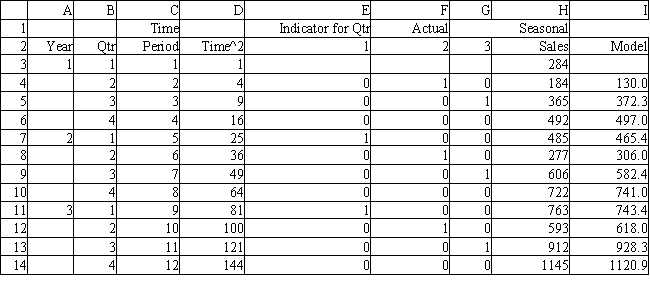
Refer to Exhibit 11.12. What formula should be entered in cell I3 to compute the Seasonal Value for year 1 Quarter 1?
A) =388.88+10.052*C3+4.248*D3+79.917*E3+296.008*F3+84.924*G3
B) =10.052*C3+4.248*D3-79.917*E3-296.008*F3-84.924*G3
C) =388.88+10.052*C3+4.248*D3-79.917*E3-296.008*F3-84.924*G3
D) =I3+10.052*C3+4.248*D3-79.917*E3-296.008*F3-84.924*G3
The following questions use the data below.
Joe's Sporting Goods wants to forecast quarterly sales figures using a seasonal regression model. The store has collected 12 quarters of data and needs your help to analyze the data. The relevant regression output is provided in the following table.
Refer to Exhibit 11.12. What formula should be entered in cell I3 to compute the Seasonal Value for year 1 Quarter 1?
A) =388.88+10.052*C3+4.248*D3+79.917*E3+296.008*F3+84.924*G3
B) =10.052*C3+4.248*D3-79.917*E3-296.008*F3-84.924*G3
C) =388.88+10.052*C3+4.248*D3-79.917*E3-296.008*F3-84.924*G3
D) =I3+10.052*C3+4.248*D3-79.917*E3-296.008*F3-84.924*G3
Question
Exhibit 11.12
The following questions use the data below.
Joe's Sporting Goods wants to forecast quarterly sales figures using a seasonal regression model. The store has collected 12 quarters of data and needs your help to analyze the data. The relevant regression output is provided in the following table.

Refer to Exhibit 11.12. What formula should be entered in cell E3 to compute the value for the indicator variable for year 1 Quarter 1?
A) =IF($B$3<>$E$2,1,0)
B) =IF($B3=E$2,1)
C) =IF($B$3=$E$2,0,1)
D) =IF($B3=E$2,1,0)
The following questions use the data below.
Joe's Sporting Goods wants to forecast quarterly sales figures using a seasonal regression model. The store has collected 12 quarters of data and needs your help to analyze the data. The relevant regression output is provided in the following table.
Refer to Exhibit 11.12. What formula should be entered in cell E3 to compute the value for the indicator variable for year 1 Quarter 1?
A) =IF($B$3<>$E$2,1,0)
B) =IF($B3=E$2,1)
C) =IF($B$3=$E$2,0,1)
D) =IF($B3=E$2,1,0)
Question
Question
Question
Question
Exhibit 11.8
The following questions use the data below.
Joe's Sporting Goods wants to forecast quarterly sales figures using Winter's method. The store has collected 12 quarters of data and needs your help to analyze the data.
Refer to Exhibit 11.8. What formula should be entered in cell E7 to compute the base level value for year 2 Quarter 1?
A) =$D$17+(1-$D$17)*(E6+F6)
B) =$D$17*D7/G3+(1-$D$17)*(E6+F6)
C) =$D$17*D7/G3+(1-$D$17)
D) =$D$17*D7/G3+($D$17)*(E6+F6)
Question
Exhibit 11.12
The following questions use the data below.
Joe's Sporting Goods wants to forecast quarterly sales figures using a seasonal regression model. The store has collected 12 quarters of data and needs your help to analyze the data. The relevant regression output is provided in the following table.

Refer to Exhibit 11.12. What is the Input X Range in the Regression command settings dialog box?
A) $C$3:$C$14
B) $H$3:$H$14
C) $C$3:$G$14
D) $H$3:$I$14
The following questions use the data below.
Joe's Sporting Goods wants to forecast quarterly sales figures using a seasonal regression model. The store has collected 12 quarters of data and needs your help to analyze the data. The relevant regression output is provided in the following table.
Refer to Exhibit 11.12. What is the Input X Range in the Regression command settings dialog box?
A) $C$3:$C$14
B) $H$3:$H$14
C) $C$3:$G$14
D) $H$3:$I$14
Question
The correct formula for the weighted moving average extrapolation technique with different weights is
A)
B)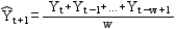
C)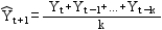
D)
A)
B)
C)
D)
Question
Exhibit 11.4
The following questions use the data below.
Joe's Sporting Goods wants to forecast quarterly sales figures using the additive seasonal method. The store has collected 12 quarters of data and needs your help to analyze the data.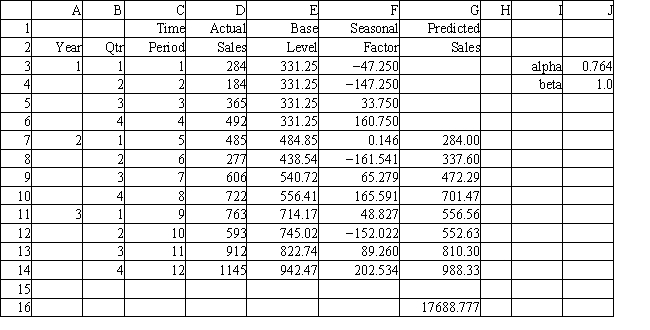
Refer to Exhibit 11.4. What formula should be entered in cell E7 to compute the remaining expected levels?
A) =$J$3*(D7-D3) + (1-$J$3)*E6
B) =$J$3*(D7-D6) + (1-$J$3)*E6
C) =$J$4*(D7-D3) + (1-$J$4)*E6
D) =$J$4*(D7-D6) + (1-$J$4)*E6
Question
The correct formula for a k period moving average is
A)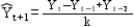
B)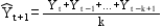
C)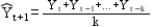
D)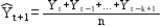
A)
B)
C)
D)
Question
The general form of an extrapolation model for time-series analysis is
A)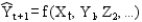
B)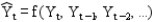
C)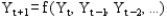
D)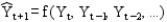
A)
B)
C)
D)
Question
Exhibit 11.9
The following questions use the data below.
Joe's Sporting Goods wants to forecast quarterly sales figures using a linear trend model. The store has collected 12 quarters of data and needs your help to analyze the data. The relevant regression output is in the following table.
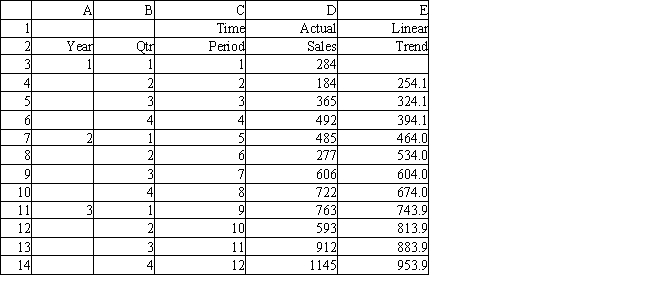
Refer to Exhibit 11.9. Which column in the spreadsheet represents the independent variable for a regression model?
A) A
B) B
C) C
D) D
The following questions use the data below.
Joe's Sporting Goods wants to forecast quarterly sales figures using a linear trend model. The store has collected 12 quarters of data and needs your help to analyze the data. The relevant regression output is in the following table.
Refer to Exhibit 11.9. Which column in the spreadsheet represents the independent variable for a regression model?
A) A
B) B
C) C
D) D
Question
How is mean absolute deviation calculated?
A)
B)
C)
D)
A)
B)
C)
D)
Question
Question
Exhibit 11.3
The following questions use the data below.
Honest Al's Used Cars wants to predict how many cars are sold each month. He has collected data for 12 months. He needs your help in analyzing this data using exponential smoothing.
Refer to Exhibit 11.3. What is the exponential smoothing forecast for month 13?
A) 79.20 ≤ forecast < 79.30
B) 79.60 ≤ forecast < 79.70
C) 80.10 ≤ forecast < 80.20
D) 81.95 ≤ forecast < 82.05
Question
Exhibit 11.4
The following questions use the data below.
Joe's Sporting Goods wants to forecast quarterly sales figures using the additive seasonal method. The store has collected 12 quarters of data and needs your help to analyze the data.
Refer to Exhibit 11.4. What formula should be entered in cell E3 to compute the base level when using the additive seasonal effects method?
A) =AVERAGE($E$3:$E$6)
B) =AVERAGE(E3, E7, E11)
C) =AVERAGE($D$3:$D$6)
D) =AVERAGE(D3, D7, D11)
Question
Question
Question
Exhibit 11.3
The following questions use the data below.
Honest Al's Used Cars wants to predict how many cars are sold each month. He has collected data for 12 months. He needs your help in analyzing this data using exponential smoothing.
Refer to Exhibit 11.3. What is the exponential smoothing forecast for month 2?
A) 69.75 ≤ forecast < 70.25
B) 73.00 ≤ forecast < 73.50
C) 74.75 ≤ forecast < 75.25
D) 79.75 ≤ forecast < 81.25
Question
Exhibit 11.7
The following questions use the data below.
Joe's Sporting Goods wants to forecast quarterly sales figures using Holt's method. The store has collected 12 quarters of data and needs your help to analyze the data.
Refer to Exhibit 11.7. What formula should be entered in cell E4 to compute the base level when using Holt's method?
A) =$J$3*D4+(1-$J$3)*(E3+F3)
B) =$J$4*D4+(1-$J$4)*(E3+F3)
C) =$J$3*G4+(1-$J$3)*(E3+F3)
D) =$J$4*(E4-E3)+(1-$J$4)*F3
Question
Exhibit 11.6
The following questions use the data below.
A store wants to predict quarterly sales. The owner has collected 3 years of sales data and wants your help in analyzing the data using the double moving average model with k = 4.
Refer to Exhibit 11.6. What formula should be entered in cell I16 to compute the forecast for time period 14?
A) =I15+2*$H$14
B) =G14+B16*H14
C) =G14+3*H14
D) =G12+H12
Question
Exhibit 11.5
The following questions use the data below.
A store wants to predict quarterly sales. The owner has collected 3 years of sales data and wants your help in analyzing the data using the multiplicative seasonal effects model.
Refer to Exhibit 11.5. What formula should be entered in cell G13 to compute the forecast for time period 11?
A) =E13+F13
B) =E12+F13
C) =E12+F8
D) =E12+F9
Question
Which of the following is true of 2-month moving average forecasting function extrapolation?
A) When forecasting ahead 4 periods, the last period forecast will be based on just forecasted values.
B) The final period forecast, will equal
  .
.
C) Each forecasted value will equal the mean of the last two actual data values.
D) The value should not be used as only a 2-month ahead forecast is valid.
A) When forecasting ahead 4 periods, the last period forecast will be based on just forecasted values.
B) The final period forecast,
will equal .C) Each forecasted value will equal the mean of the last two actual data values.
D) The value
should not be used as only a 2-month ahead forecast is valid. Question
Exhibit 11.10
The following questions use the data below.
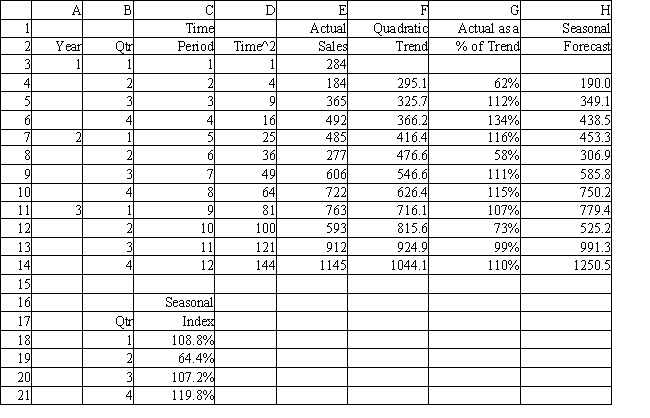
Joe's Sporting Goods wants to forecast quarterly sales figures using a quadratic trend model. The store has collected 12 quarters of data and needs your help to analyze the data. The relevant regression output is in the following table.
Refer to Exhibit 11.10. What formula should be entered in cell F3 to compute the quadratic trend for year 1 Quarter 1?
A) = 263.4545 * C3 + 5.985514 * D3 + 4.922577
B) = 263.4545 + 5.985514 * D3 + 4.922577 * C3
C) = 263.4545 + 5.985514 * C2 + 4.922577 * D2
D) = 263.4545 + 5.985514 * C3 + 4.922577 * D3
The following questions use the data below.
Joe's Sporting Goods wants to forecast quarterly sales figures using a quadratic trend model. The store has collected 12 quarters of data and needs your help to analyze the data. The relevant regression output is in the following table.
Refer to Exhibit 11.10. What formula should be entered in cell F3 to compute the quadratic trend for year 1 Quarter 1?
A) = 263.4545 * C3 + 5.985514 * D3 + 4.922577
B) = 263.4545 + 5.985514 * D3 + 4.922577 * C3
C) = 263.4545 + 5.985514 * C2 + 4.922577 * D2
D) = 263.4545 + 5.985514 * C3 + 4.922577 * D3
Question
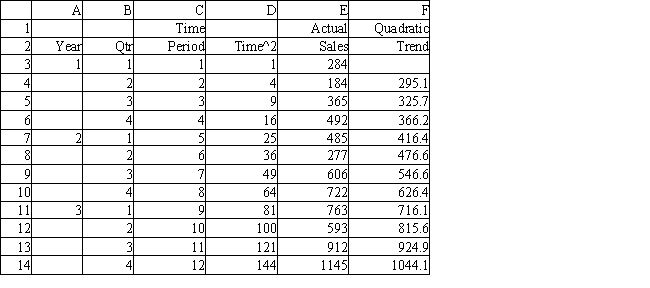
Exhibit 11.10
The following questions use the data below.
Joe's Sporting Goods wants to forecast quarterly sales figures using a quadratic trend model. The store has collected 12 quarters of data and needs your help to analyze the data. The relevant regression output is in the following table.

Refer to Exhibit 11.10. What are predicted sales for the fourth quarter of year 4?
A) 1170 ≤ predicted sales < 1175
B) 1310 ≤ predicted sales < 1315
C) 1460 ≤ predicted sales < 1465
D) 1615 ≤ predicted sales < 1620
The following questions use the data below.
Joe's Sporting Goods wants to forecast quarterly sales figures using a quadratic trend model. The store has collected 12 quarters of data and needs your help to analyze the data. The relevant regression output is in the following table.
Refer to Exhibit 11.10. What are predicted sales for the fourth quarter of year 4?
A) 1170 ≤ predicted sales < 1175
B) 1310 ≤ predicted sales < 1315
C) 1460 ≤ predicted sales < 1465
D) 1615 ≤ predicted sales < 1620
Question
Question
Exhibit 11.4
The following questions use the data below.
Joe's Sporting Goods wants to forecast quarterly sales figures using the additive seasonal method. The store has collected 12 quarters of data and needs your help to analyze the data.
In the formula for MAD, MAPE, and MSE, the Yt and terms represent
A) the actual and mean values, respectively.
B) the actual and forecasted values, respectively.
C) the forecasted and actual values, respectively.
D) the predicted and forecasted values, respectively.
The following questions use the data below.
Joe's Sporting Goods wants to forecast quarterly sales figures using the additive seasonal method. The store has collected 12 quarters of data and needs your help to analyze the data.
In the formula for MAD, MAPE, and MSE, the Yt and
terms representA) the actual and mean values, respectively.
B) the actual and forecasted values, respectively.
C) the forecasted and actual values, respectively.
D) the predicted and forecasted values, respectively.
Question
Exhibit 11.2
The following questions use the data below.
Honest Al's Used Cars wants to predict how many cars are sold each month. He has collected data for 12 months. He needs your help in analyzing this data using weighted moving averages.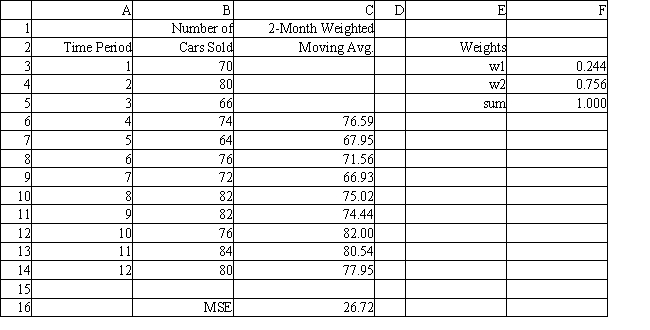
Refer to Exhibit 11.2. What would be the forecasted value for time period 13?
A) 83.024.
B) 80.796.
C) 79.245.
D) 79.908.
Question
Question
Question
Exhibit 11.3
The following questions use the data below.
Honest Al's Used Cars wants to predict how many cars are sold each month. He has collected data for 12 months. He needs your help in analyzing this data using exponential smoothing.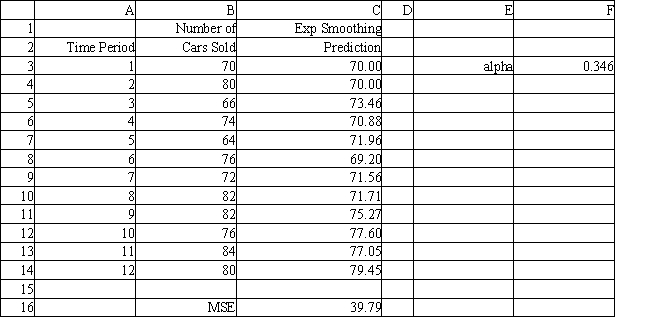
Refer to Exhibit 11.3. Assume the forecasted value for month 13 is 79.64. What is the forecasted value for month 16?
A) 85.54.
B) 83.64.
C) 79.64.
D) 82.00.
Question
Exhibit 11.1
The following questions use the data below.
Honest Al's Used Cars wants to predict how many cars are sold each month. He has collected data for 12 months. He needs your help in analyzing this data using moving averages.
Refer to Exhibit 11.1. If predicting the cars sold for time period 14, what formula must be placed in cell B16?
A) =AVERAGE(B12:B15)
B) =AVERAGE(B12:B15)/4
C) =TREND(B12:B15)
D) =B14
Question
Exhibit 11.10
The following questions use the data below.
Joe's Sporting Goods wants to forecast quarterly sales figures using a quadratic trend model. The store has collected 12 quarters of data and needs your help to analyze the data. The relevant regression output is in the following table.

Refer to Exhibit 11.10. What is the Input Y Range in the Regression command settings dialog box?
A) B3:B14
B) C3:C14
C) D3:D14
D) E3:E14
The following questions use the data below.
Joe's Sporting Goods wants to forecast quarterly sales figures using a quadratic trend model. The store has collected 12 quarters of data and needs your help to analyze the data. The relevant regression output is in the following table.
Refer to Exhibit 11.10. What is the Input Y Range in the Regression command settings dialog box?
A) B3:B14
B) C3:C14
C) D3:D14
D) E3:E14
Question
Exhibit 11.2
The following questions use the data below.
Honest Al's Used Cars wants to predict how many cars are sold each month. He has collected data for 12 months. He needs your help in analyzing this data using weighted moving averages.
Refer to Exhibit 11.2. What is the 2-month weighted moving average forecast for month 3 using the weight in the spreadsheet? Associate weight w1 with sales in time period 2 and w2 with sales in time period 1.
A) 72.44
B) 75.00
C) 76.59
D) 77.56
Question
Exhibit 11.5
The following questions use the data below.
A store wants to predict quarterly sales. The owner has collected 3 years of sales data and wants your help in analyzing the data using the multiplicative seasonal effects model.
Refer to Exhibit 11.5. What formula should be entered in cell E3 to compute the base level when using the multiplicative seasonal effects method?
A) =AVERAGE($E$3:$E$6)
B) =AVERAGE(E3, E7, E11)
C) =AVERAGE($D$3:$D$6)
D) =AVERAGE(D3, D7, D11)
Question
Exhibit 11.4
The following questions use the data below.
Joe's Sporting Goods wants to forecast quarterly sales figures using the additive seasonal method. The store has collected 12 quarters of data and needs your help to analyze the data.
Refer to Exhibit 11.4. What formula should be entered in cell G12 to compute the forecast for time period 10?
A) =E10+F7
B) =E12+F12
C) =E12+F8
D) =E11+F8
Question
Question
Exhibit 11.7
The following questions use the data below.
Joe's Sporting Goods wants to forecast quarterly sales figures using Holt's method. The store has collected 12 quarters of data and needs your help to analyze the data.
Refer to Exhibit 11.7. What are predicted sales for time period 13 using the data in the spreadsheet?
A) 908 ≤ predicted sales < 909
B) 1026 ≤ predicted sales < 1027
C) 1144 ≤ predicted sales < 1146
D) 1160 ≤ predicted sales < 1161
Question
Exhibit 11.10
The following questions use the data below.
Joe's Sporting Goods wants to forecast quarterly sales figures using a quadratic trend model. The store has collected 12 quarters of data and needs your help to analyze the data. The relevant regression output is in the following table.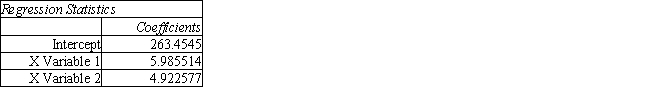

Refer to Exhibit 11.10. What is the Input X Range in the Regression command settings dialog box?
A) B3:B14
B) C3:C14
C) C3:D14
D) C3:E14
The following questions use the data below.
Joe's Sporting Goods wants to forecast quarterly sales figures using a quadratic trend model. The store has collected 12 quarters of data and needs your help to analyze the data. The relevant regression output is in the following table.
Refer to Exhibit 11.10. What is the Input X Range in the Regression command settings dialog box?
A) B3:B14
B) C3:C14
C) C3:D14
D) C3:E14
Question
Exhibit 11.1
The following questions use the data below.
Honest Al's Used Cars wants to predict how many cars are sold each month. He has collected data for 12 months. He needs your help in analyzing this data using moving averages.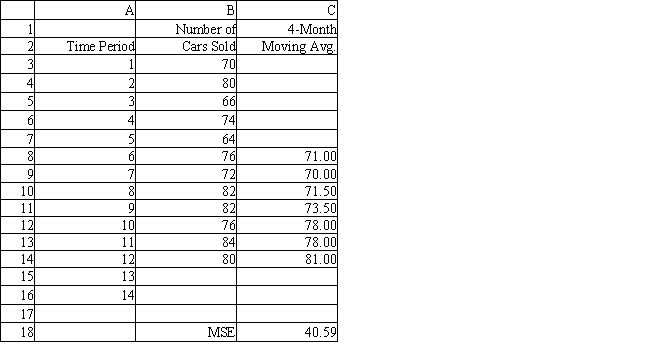
Refer to Exhibit 11.1. What formula should be entered in cell C13 to compute the 4-month moving average forecast for month 11?
A) =AVERAGE(B9:B12)/4
B) =AVERAGE(B7+B10)
C) =AVERAGE(A9:A12)
D) =AVERAGE(B9:B12)
Question
Exhibit 11.10
The following questions use the data below.
Joe's Sporting Goods wants to forecast quarterly sales figures using a quadratic trend model. The store has collected 12 quarters of data and needs your help to analyze the data. The relevant regression output is in the following table.

Refer to Exhibit 11.10. What Excel command can be used in cells F4:F14 in lieu of a formula based on the regression statistics?
A) =TREND($E$3:$E$14,$C$3:$C$14,C4)
B) =TREND($E$3:$E$14,$C$3:$D$14,C4:D4)
C) =TREND($E$3:$E$14,$C$3:$D$14,D4)
D) =TREND($E$3:$E$14,$B$3:$D$14,B4:D4)
The following questions use the data below.
Joe's Sporting Goods wants to forecast quarterly sales figures using a quadratic trend model. The store has collected 12 quarters of data and needs your help to analyze the data. The relevant regression output is in the following table.
Refer to Exhibit 11.10. What Excel command can be used in cells F4:F14 in lieu of a formula based on the regression statistics?
A) =TREND($E$3:$E$14,$C$3:$C$14,C4)
B) =TREND($E$3:$E$14,$C$3:$D$14,C4:D4)
C) =TREND($E$3:$E$14,$C$3:$D$14,D4)
D) =TREND($E$3:$E$14,$B$3:$D$14,B4:D4)
Question
Exhibit 11.3
The following questions use the data below.
Honest Al's Used Cars wants to predict how many cars are sold each month. He has collected data for 12 months. He needs your help in analyzing this data using exponential smoothing.
Refer to Exhibit 11.3. What formula should be entered in cell C4 to compute the exponential smoothing forecast for month 2?
A) =C3-$F$3*(B3-C3)
B) =C3+$F$3*(C3-B3)
C) =B3+$F$3*(B3-C3)
D) =C3+$F$3*(B3-C3)
Question
Exhibit 11.8
The following questions use the data below.
Joe's Sporting Goods wants to forecast quarterly sales figures using Winter's method. The store has collected 12 quarters of data and needs your help to analyze the data.
Refer to Exhibit 11.8. What are predicted sales for the first quarter of year 4?
A) 795 ≤ predicted sales < 800
B) 860 ≤ predicted sales < 865
C) 910 ≤ predicted sales < 915
D) 1280 ≤ predicted sales < 1285
Question
Exhibit 11.4
The following questions use the data below.
Joe's Sporting Goods wants to forecast quarterly sales figures using the additive seasonal method. The store has collected 12 quarters of data and needs your help to analyze the data.
Refer to Exhibit 11.4. What are predicted sales for time period 13 using the data in the spreadsheet?
A) 915 ≤ predicted sales < 916
B) 916 ≤ predicted sales < 917
C) 991 ≤ predicted sales < 992
D) 1045 ≤ predicted sales < 1046
Question
Exhibit 11.5
The following questions use the data below.
A store wants to predict quarterly sales. The owner has collected 3 years of sales data and wants your help in analyzing the data using the multiplicative seasonal effects model.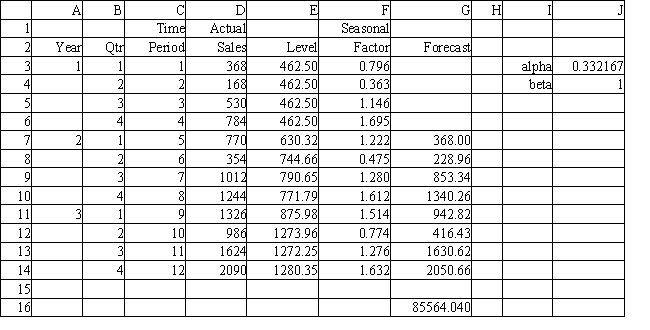
Refer to Exhibit 11.5. What formula should be entered in cell F7 to compute the seasonal factor using the multiplicative seasonal effects model?
A) =$J$3*D4+(1-$J$3)*(E3+F3)
B) =$J$4*(D7/E7)+(1-$J$4)*F3
C) =$J$4*(E7/E6)+(1-$J$4)*E6
D) =$J$3*G3+(1-$J$3)*(D3+G3)
Question
Question
Exhibit 11.6
The following questions use the data below.
A store wants to predict quarterly sales. The owner has collected 3 years of sales data and wants your help in analyzing the data using the double moving average model with k = 4.
Refer to Exhibit 11.6. What are predicted sales for time period 16 using the data in the spreadsheet?
A) 1964 ≤ predicted sales < 1965
B) 2147 ≤ predicted sales < 2148
C) 2330 ≤ predicted sales < 2331
D) 2513 ≤ predicted sales < 2513
Question
Exhibit 11.2
The following questions use the data below.
Honest Al's Used Cars wants to predict how many cars are sold each month. He has collected data for 12 months. He needs your help in analyzing this data using weighted moving averages.
Refer to Exhibit 11.2. Which cell in the spreadsheet is the objective cell in the Analytic Solver Platform (ASP) task pane area?
A) F3
B) F4
C) F5
D) C16
Question
Exhibit 11.6
The following questions use the data below.
A store wants to predict quarterly sales. The owner has collected 3 years of sales data and wants your help in analyzing the data using the double moving average model with k = 4.
Refer to Exhibit 11.6. What formula should be entered in cell F9 to compute the second average when using the double moving average method with k = 4?
A) =Average($E$3:$E$9)
B) =Average($D$3:$D$9)
C) =Average(D3:D9)
D) =Average(D6:D9)
Question
Exhibit 11.11
The following questions use the data below.
Joe's Sporting Goods wants to forecast quarterly sales figures using seasonal indices. The store has collected 12 quarters of data and needs your help to analyze the data. The relevant regression output is in the following table.
Refer to Exhibit 11.11. What formula should be entered in cell H3 to compute the Seasonal Forecast value for year 1 Quarter 1?
A) =F3*VLOOKUP(B3,$B$18:$C$21,2)
B) =F3*HLOOKUP(B3,$B$18:$B$21,2)
C) =F3*VLOOKUP(B3,$B$18:$B$21,2)
D) =F3*VLOOKUP(B3,$C$18:$C$21,2)
Question
Question
Exhibit 11.12
The following questions use the data below.
Joe's Sporting Goods wants to forecast quarterly sales figures using a seasonal regression model. The store has collected 12 quarters of data and needs your help to analyze the data. The relevant regression output is provided in the following table.

Refer to Exhibit 11.12. What is the Input Y Range in the Regression command settings dialog box?
A) $C$3:$C$14
B) $H$3:$H$14
C) $C$3:$G$14
D) $H$3:$I$14
The following questions use the data below.
Joe's Sporting Goods wants to forecast quarterly sales figures using a seasonal regression model. The store has collected 12 quarters of data and needs your help to analyze the data. The relevant regression output is provided in the following table.
Refer to Exhibit 11.12. What is the Input Y Range in the Regression command settings dialog box?
A) $C$3:$C$14
B) $H$3:$H$14
C) $C$3:$G$14
D) $H$3:$I$14
Question
Question
Exhibit 11.5
The following questions use the data below.
A store wants to predict quarterly sales. The owner has collected 3 years of sales data and wants your help in analyzing the data using the multiplicative seasonal effects model.
Refer to Exhibit 11.5. What are predicted sales for time period 13 using the data in the spreadsheet?
A) 1259 ≤ predicted sales < 1260
B) 1938 ≤ predicted sales < 1939
C) 2090 ≤ predicted sales < 2091
D) 2187 ≤ predicted sales < 2188
Question
Exhibit 11.6
The following questions use the data below.
A store wants to predict quarterly sales. The owner has collected 3 years of sales data and wants your help in analyzing the data using the double moving average model with k = 4.
Refer to Exhibit 11.6. What formula should be entered in cell H9 to compute the trend using the double moving average model with k = 4?
A) =2*(AVERAGE(E9,F9))/4
B) =2*(E9-F9)/(4-1)
C) =2*(E9-F9)/(4*2)
D) =2*(D9-F9)/(4-1)
Question
Question
Exhibit 11.7
The following questions use the data below.
Joe's Sporting Goods wants to forecast quarterly sales figures using Holt's method. The store has collected 12 quarters of data and needs your help to analyze the data.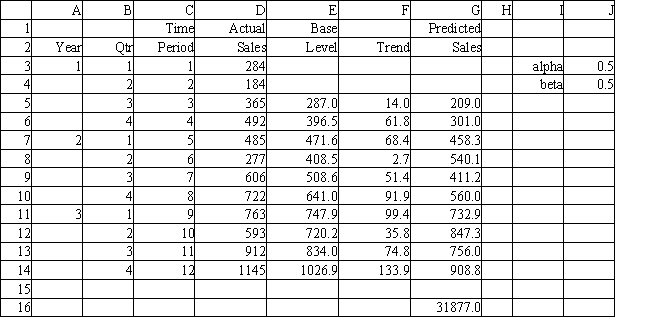
Refer to Exhibit 11.7. What are predicted sales for time period 2 using the data in the spreadsheet?
A) 208.5 ≤ predicted sales < 209.5
B) 233.5 ≤ predicted sales < 234.5
C) 283.5 ≤ predicted sales < 284.5
D) 300.5 ≤ predicted sales < 301.5

Unlock Deck
Sign up to unlock the cards in this deck!
Unlock Deck
Unlock Deck
1/125
Play
Full screen (f)
Deck 11: Time Series Forecasting
1
What is the correct form of the exponential smoothing model?
A)
B)
C)
D)
A)
B)
C)
D)
2
Exhibit 11.9
The following questions use the data below.
Joe's Sporting Goods wants to forecast quarterly sales figures using a linear trend model. The store has collected 12 quarters of data and needs your help to analyze the data. The relevant regression output is in the following table.
Refer to Exhibit 11.9. What is the Input X Range in the Regression command settings dialog box?
A) B3:B14
B) C3:C14
C) D3:D14
D) B3:D14
C3:C14
3
MAD, MAPE, MSE and RMSE are measures of model accuracy.
True
4
Seasonality is defined as
A) regular variation above and below the trend line with a cycle completing itself within a year
B) regular variation above and below the trend line with a cycle completing itself within a period longer than one year
C) a sudden change in process level due to a known cause
D) part of the error term
A) regular variation above and below the trend line with a cycle completing itself within a year
B) regular variation above and below the trend line with a cycle completing itself within a period longer than one year
C) a sudden change in process level due to a known cause
D) part of the error term
Unlock Deck
Unlock for access to all 125 flashcards in this deck.
Unlock Deck
k this deck
5
The weighted moving average technique is a special case of the moving average technique.
Unlock Deck
Unlock for access to all 125 flashcards in this deck.
Unlock Deck
k this deck
6
Exhibit 11.6
The following questions use the data below.
A store wants to predict quarterly sales. The owner has collected 3 years of sales data and wants your help in analyzing the data using the double moving average model with k = 4.
Refer to Exhibit 11.6. What formula should be entered in cell E6 (and copied to E7:E14) to compute the first average when using the double moving average method with k = 4?
A) =Average($E$3:$E$6)
B) =Average($D$3:$D$6)
C) =Average(D3:D6)
D) =Average(D5:D6)
Unlock Deck
Unlock for access to all 125 flashcards in this deck.
Unlock Deck
k this deck
7
A time series is a set of observations on a quantitative variable collected over time.
Unlock Deck
Unlock for access to all 125 flashcards in this deck.
Unlock Deck
k this deck
8
Exhibit 11.1
The following questions use the data below.
Honest Al's Used Cars wants to predict how many cars are sold each month. He has collected data for 12 months. He needs your help in analyzing this data using moving averages.
Refer to Exhibit 11.1. What Excel function will compute the root mean squared error in cell C18 of the spreadsheet?
A) =SUMXMY2(B7:B14,C7:C14)
B) =SQRT(SUMXMY2(B3:B14,C3:C14)/COUNT(C3:C14))
C) =SUMXMY2(B7:B14,C7:C14)/COUNT(C7:C14)
D) =SQRT(SUMPRODUCT(B7:B14,C7:C14)/COUNT(C7:C14))
Unlock Deck
Unlock for access to all 125 flashcards in this deck.
Unlock Deck
k this deck
9
Solver can be used to estimate model parameters when the time series is stationary and additive seasonal effects are present.
Unlock Deck
Unlock for access to all 125 flashcards in this deck.
Unlock Deck
k this deck
10
Exponential smoothing is applicable to non-stationary data.
Unlock Deck
Unlock for access to all 125 flashcards in this deck.
Unlock Deck
k this deck
11
Seasonality is a regular, repeating pattern in the data that takes longer than 1 year to complete.
Unlock Deck
Unlock for access to all 125 flashcards in this deck.
Unlock Deck
k this deck
12
The TREND( ) function can be used to calculate the estimated values for linear regression models.
Unlock Deck
Unlock for access to all 125 flashcards in this deck.
Unlock Deck
k this deck
13
Exhibit 11.1
The following questions use the data below.
Honest Al's Used Cars wants to predict how many cars are sold each month. He has collected data for 12 months. He needs your help in analyzing this data using moving averages.
Refer to Exhibit 11.1. What Excel function will compute the mean squared error in cell C18 of the spreadsheet?
A) =SUMXMY2(B7:B14,C7:C14)
B) =SUMXMY2(B3:B14,C3:C14)/COUNT(C3:C14)
C) =SUMXMY2(B7:B14,C7:C14)/COUNT(C7:C14)
D) =SUMPRODUCT(B7:B14,C7:C14)/COUNT(C7:C14)
Unlock Deck
Unlock for access to all 125 flashcards in this deck.
Unlock Deck
k this deck
14
Exhibit 11.8
The following questions use the data below.
Joe's Sporting Goods wants to forecast quarterly sales figures using Winter's method. The store has collected 12 quarters of data and needs your help to analyze the data.
Refer to Exhibit 11.8. What formula should be entered in cell F7 to compute the Trend value for year 2 Quarter 1?
A) =$D$18*(E6-E7)+(1-$D$18)*F6
B) =$D$18*(E7-E6)+$D$18*F6
C) =$D$18*(E7-E6)+(1-$D$18)*F6
D) =$D$18*(E7-E6)*(1-$D$18)
Unlock Deck
Unlock for access to all 125 flashcards in this deck.
Unlock Deck
k this deck
15
The determination of the MSE-minimizing value of the wi is a non-linear optimization problem because
A) absolute values are used.
B) the wi are fractional.
C) the wi sum to 1.
D) MSE is a non-linear objective function.
A) absolute values are used.
B) the wi are fractional.
C) the wi sum to 1.
D) MSE is a non-linear objective function.
Unlock Deck
Unlock for access to all 125 flashcards in this deck.
Unlock Deck
k this deck
16
Exhibit 11.12
The following questions use the data below.
Joe's Sporting Goods wants to forecast quarterly sales figures using a seasonal regression model. The store has collected 12 quarters of data and needs your help to analyze the data. The relevant regression output is provided in the following table.
Refer to Exhibit 11.12. What are predicted sales for the first quarter of year 4?
A) 1155 ≤ predicted sales < 1160
B) 1065 ≤ predicted sales < 1070
C) 1410 ≤ predicted sales < 1415
D) 1635 ≤ predicted sales < 1640
Unlock Deck
Unlock for access to all 125 flashcards in this deck.
Unlock Deck
k this deck
17
Exhibit 11.11
The following questions use the data below.
Joe's Sporting Goods wants to forecast quarterly sales figures using seasonal indices. The store has collected 12 quarters of data and needs your help to analyze the data. The relevant regression output is in the following table.
Refer to Exhibit 11.11. What formula should be entered in cell C18 to compute the Seasonal Index value for quarter 1?
A) =SUM($B$3:$B$14)/COUNTIF($B$3:$B$14,B18)
B) =SUMIF($B$3:$B$14,B18,$G$3:$G$14)/COUNTIF($B$3:$B$14,B18)
C) =SUMIF($B$3:$B$14,$G$3:$G$14)/COUNT($B$3:$B$14,B18)
D) =SUMIF($B$3:$B$14,B18)/COUNTIF($B$3:$B$14,B18)
Unlock Deck
Unlock for access to all 125 flashcards in this deck.
Unlock Deck
k this deck
18
Exhibit 11.2
The following questions use the data below.
Honest Al's Used Cars wants to predict how many cars are sold each month. He has collected data for 12 months. He needs your help in analyzing this data using weighted moving averages.
Refer to Exhibit 11.2. What formula should be entered in cell C6 to compute the 2-month weighted moving average forecast for month 3?
A) =F3*B4+F4*B3
B) =$F$3*B4+$F$4*B3
C) =(B3+B4)/2
D) =SUMPRODUCT($F$3:$F$4,B3:B4)
Unlock Deck
Unlock for access to all 125 flashcards in this deck.
Unlock Deck
k this deck
19
In stationary time series there is no significant upward or downward trend in the data over time.
Unlock Deck
Unlock for access to all 125 flashcards in this deck.
Unlock Deck
k this deck
20
Exhibit 11.7
The following questions use the data below.
Joe's Sporting Goods wants to forecast quarterly sales figures using Holt's method. The store has collected 12 quarters of data and needs your help to analyze the data.
Refer to Exhibit 11.7. What formula should be entered in cell F4 to compute the trend when using Holt's method?
A) =$J$3*D4+(1-$J$3)*(E3+F3)
B) =$J$4*(E4-E3)+(1-$J$4)*F3
C) =$J$4*(E4-E3)+(1-$J$4)*G3
D) =$J$4*G3+(1-$J$4)*(D3+G3)
Unlock Deck
Unlock for access to all 125 flashcards in this deck.
Unlock Deck
k this deck
21
Exhibit 11.8
The following questions use the data below.
Joe's Sporting Goods wants to forecast quarterly sales figures using Winter's method. The store has collected 12 quarters of data and needs your help to analyze the data.
Refer to Exhibit 11.8. What formula should be entered in cell H7 to compute the Predicted Sales value for year 2 Quarter 1?
A) =SUM(E6:F6)*G3
B) =SUM(E6:F6)+G3
C) =SUM(E6:F6)
D) =SUM(E6:G3)
Unlock Deck
Unlock for access to all 125 flashcards in this deck.
Unlock Deck
k this deck
22
Seasonality in a time series is indicated by
A) regular, repeating patterns in the data around a trend line.
B) regular patterns in the data around a trend line.
C) irregular patterns in the data around a trend line.
D) random patterns in the data around a trend line.
A) regular, repeating patterns in the data around a trend line.
B) regular patterns in the data around a trend line.
C) irregular patterns in the data around a trend line.
D) random patterns in the data around a trend line.
Unlock Deck
Unlock for access to all 125 flashcards in this deck.
Unlock Deck
k this deck
23
A technique that analyzes past behavior of a time-series variable to predict the future is referred to as
A) a regression model.
B) a seasonal model.
C) a past performance model.
D) an extrapolation model.
A) a regression model.
B) a seasonal model.
C) a past performance model.
D) an extrapolation model.
Unlock Deck
Unlock for access to all 125 flashcards in this deck.
Unlock Deck
k this deck
24
Exhibit 11.12
The following questions use the data below.
Joe's Sporting Goods wants to forecast quarterly sales figures using a seasonal regression model. The store has collected 12 quarters of data and needs your help to analyze the data. The relevant regression output is provided in the following table.
Refer to Exhibit 11.12. What formula should be entered in cell I3 to compute the Seasonal Value for year 1 Quarter 1?
A) =388.88+10.052*C3+4.248*D3+79.917*E3+296.008*F3+84.924*G3
B) =10.052*C3+4.248*D3-79.917*E3-296.008*F3-84.924*G3
C) =388.88+10.052*C3+4.248*D3-79.917*E3-296.008*F3-84.924*G3
D) =I3+10.052*C3+4.248*D3-79.917*E3-296.008*F3-84.924*G3
Unlock Deck
Unlock for access to all 125 flashcards in this deck.
Unlock Deck
k this deck
25
Exhibit 11.12
The following questions use the data below.
Joe's Sporting Goods wants to forecast quarterly sales figures using a seasonal regression model. The store has collected 12 quarters of data and needs your help to analyze the data. The relevant regression output is provided in the following table.
Refer to Exhibit 11.12. What formula should be entered in cell E3 to compute the value for the indicator variable for year 1 Quarter 1?
A) =IF($B$3<>$E$2,1,0)
B) =IF($B3=E$2,1)
C) =IF($B$3=$E$2,0,1)
D) =IF($B3=E$2,1,0)
Unlock Deck
Unlock for access to all 125 flashcards in this deck.
Unlock Deck
k this deck
26
Which of the following is not a quantitative technique for evaluating the accuracy of a time-series modeling technique?
A) Constructing line graphs of the data.
B) The mean absolute deviation.
C) The mean absolute percent error.
D) The root mean square error.
A) Constructing line graphs of the data.
B) The mean absolute deviation.
C) The mean absolute percent error.
D) The root mean square error.
Unlock Deck
Unlock for access to all 125 flashcards in this deck.
Unlock Deck
k this deck
27
Assume that seasonality exists in the monthly product sales data. The number of seasonal indexes needed to model this is equal to
A) 11
B) 10
C) 12
D) 4
A) 11
B) 10
C) 12
D) 4
Unlock Deck
Unlock for access to all 125 flashcards in this deck.
Unlock Deck
k this deck
28
Which of the following statements are true regarding the difference between forecasts using exponential smoothing and forecasts using a weighted moving average method?
A) The exponential smoothing forecasts will have a steeper trend line.
B) The weighted moving average forecasts will form a level line of constant value.
C) The exponential smoothing forecasts will form a level line of constant value.
D) The exponential smoothing forecasts will do a better job of capturing the underlying trend in the data.
Unlock Deck
Unlock for access to all 125 flashcards in this deck.
Unlock Deck
k this deck
29
Exhibit 11.8
The following questions use the data below.
Joe's Sporting Goods wants to forecast quarterly sales figures using Winter's method. The store has collected 12 quarters of data and needs your help to analyze the data.
Refer to Exhibit 11.8. What formula should be entered in cell E7 to compute the base level value for year 2 Quarter 1?
A) =$D$17+(1-$D$17)*(E6+F6)
B) =$D$17*D7/G3+(1-$D$17)*(E6+F6)
C) =$D$17*D7/G3+(1-$D$17)
D) =$D$17*D7/G3+($D$17)*(E6+F6)
Unlock Deck
Unlock for access to all 125 flashcards in this deck.
Unlock Deck
k this deck
30
Exhibit 11.12
The following questions use the data below.
Joe's Sporting Goods wants to forecast quarterly sales figures using a seasonal regression model. The store has collected 12 quarters of data and needs your help to analyze the data. The relevant regression output is provided in the following table.
Refer to Exhibit 11.12. What is the Input X Range in the Regression command settings dialog box?
A) $C$3:$C$14
B) $H$3:$H$14
C) $C$3:$G$14
D) $H$3:$I$14
Unlock Deck
Unlock for access to all 125 flashcards in this deck.
Unlock Deck
k this deck
31
The correct formula for the weighted moving average extrapolation technique with different weights is
A)
B)
C)
D)
A)
B)
C)
D)
Unlock Deck
Unlock for access to all 125 flashcards in this deck.
Unlock Deck
k this deck
32
Exhibit 11.4
The following questions use the data below.
Joe's Sporting Goods wants to forecast quarterly sales figures using the additive seasonal method. The store has collected 12 quarters of data and needs your help to analyze the data.
Refer to Exhibit 11.4. What formula should be entered in cell E7 to compute the remaining expected levels?
A) =$J$3*(D7-D3) + (1-$J$3)*E6
B) =$J$3*(D7-D6) + (1-$J$3)*E6
C) =$J$4*(D7-D3) + (1-$J$4)*E6
D) =$J$4*(D7-D6) + (1-$J$4)*E6
Unlock Deck
Unlock for access to all 125 flashcards in this deck.
Unlock Deck
k this deck
33
The correct formula for a k period moving average is
A)
B)
C)
D)
A)
B)
C)
D)
Unlock Deck
Unlock for access to all 125 flashcards in this deck.
Unlock Deck
k this deck
34
The general form of an extrapolation model for time-series analysis is
A)
B)
C)
D)
A)
B)
C)
D)
Unlock Deck
Unlock for access to all 125 flashcards in this deck.
Unlock Deck
k this deck
35
Exhibit 11.9
The following questions use the data below.
Joe's Sporting Goods wants to forecast quarterly sales figures using a linear trend model. The store has collected 12 quarters of data and needs your help to analyze the data. The relevant regression output is in the following table.
Refer to Exhibit 11.9. Which column in the spreadsheet represents the independent variable for a regression model?
A) A
B) B
C) C
D) D
Unlock Deck
Unlock for access to all 125 flashcards in this deck.
Unlock Deck
k this deck
36
How is mean absolute deviation calculated?
A)
B)
C)
D)
A)
B)
C)
D)
Unlock Deck
Unlock for access to all 125 flashcards in this deck.
Unlock Deck
k this deck
37
Which of the following describes a multiplicative seasonal effect in times series data?
A) An occasional pattern of equal magnitude.
B) An occasional pattern of unequal magnitude.
C) A regular, repeating pattern of equal magnitude.
D) A regular, repeating pattern of increasing magnitude.
A) An occasional pattern of equal magnitude.
B) An occasional pattern of unequal magnitude.
C) A regular, repeating pattern of equal magnitude.
D) A regular, repeating pattern of increasing magnitude.
Unlock Deck
Unlock for access to all 125 flashcards in this deck.
Unlock Deck
k this deck
38
Exhibit 11.3
The following questions use the data below.
Honest Al's Used Cars wants to predict how many cars are sold each month. He has collected data for 12 months. He needs your help in analyzing this data using exponential smoothing.
Refer to Exhibit 11.3. What is the exponential smoothing forecast for month 13?
A) 79.20 ≤ forecast < 79.30
B) 79.60 ≤ forecast < 79.70
C) 80.10 ≤ forecast < 80.20
D) 81.95 ≤ forecast < 82.05
Unlock Deck
Unlock for access to all 125 flashcards in this deck.
Unlock Deck
k this deck
39
Exhibit 11.4
The following questions use the data below.
Joe's Sporting Goods wants to forecast quarterly sales figures using the additive seasonal method. The store has collected 12 quarters of data and needs your help to analyze the data.
Refer to Exhibit 11.4. What formula should be entered in cell E3 to compute the base level when using the additive seasonal effects method?
A) =AVERAGE($E$3:$E$6)
B) =AVERAGE(E3, E7, E11)
C) =AVERAGE($D$3:$D$6)
D) =AVERAGE(D3, D7, D11)
Unlock Deck
Unlock for access to all 125 flashcards in this deck.
Unlock Deck
k this deck
40
How many indicator variables are required if there are p seasons in a time series and you are forecasting with a seasonal regression model?
A) p − 1
B) p
C) p + 1
D) p + 2
A) p − 1
B) p
C) p + 1
D) p + 2
Unlock Deck
Unlock for access to all 125 flashcards in this deck.
Unlock Deck
k this deck
41
Which of the following describes an additive seasonal effect in times series data?
A) An occasional pattern of equal magnitude.
B) An occasional pattern of unequal magnitude.
C) A regular, repeating pattern of equal magnitude.
D) A regular, repeating pattern of increasing magnitude.
A) An occasional pattern of equal magnitude.
B) An occasional pattern of unequal magnitude.
C) A regular, repeating pattern of equal magnitude.
D) A regular, repeating pattern of increasing magnitude.
Unlock Deck
Unlock for access to all 125 flashcards in this deck.
Unlock Deck
k this deck
42
Exhibit 11.3
The following questions use the data below.
Honest Al's Used Cars wants to predict how many cars are sold each month. He has collected data for 12 months. He needs your help in analyzing this data using exponential smoothing.
Refer to Exhibit 11.3. What is the exponential smoothing forecast for month 2?
A) 69.75 ≤ forecast < 70.25
B) 73.00 ≤ forecast < 73.50
C) 74.75 ≤ forecast < 75.25
D) 79.75 ≤ forecast < 81.25
Unlock Deck
Unlock for access to all 125 flashcards in this deck.
Unlock Deck
k this deck
43
Exhibit 11.7
The following questions use the data below.
Joe's Sporting Goods wants to forecast quarterly sales figures using Holt's method. The store has collected 12 quarters of data and needs your help to analyze the data.
Refer to Exhibit 11.7. What formula should be entered in cell E4 to compute the base level when using Holt's method?
A) =$J$3*D4+(1-$J$3)*(E3+F3)
B) =$J$4*D4+(1-$J$4)*(E3+F3)
C) =$J$3*G4+(1-$J$3)*(E3+F3)
D) =$J$4*(E4-E3)+(1-$J$4)*F3
Unlock Deck
Unlock for access to all 125 flashcards in this deck.
Unlock Deck
k this deck
44
Exhibit 11.6
The following questions use the data below.
A store wants to predict quarterly sales. The owner has collected 3 years of sales data and wants your help in analyzing the data using the double moving average model with k = 4.
Refer to Exhibit 11.6. What formula should be entered in cell I16 to compute the forecast for time period 14?
A) =I15+2*$H$14
B) =G14+B16*H14
C) =G14+3*H14
D) =G12+H12
Unlock Deck
Unlock for access to all 125 flashcards in this deck.
Unlock Deck
k this deck
45
Exhibit 11.5
The following questions use the data below.
A store wants to predict quarterly sales. The owner has collected 3 years of sales data and wants your help in analyzing the data using the multiplicative seasonal effects model.
Refer to Exhibit 11.5. What formula should be entered in cell G13 to compute the forecast for time period 11?
A) =E13+F13
B) =E12+F13
C) =E12+F8
D) =E12+F9
Unlock Deck
Unlock for access to all 125 flashcards in this deck.
Unlock Deck
k this deck
46
Which of the following is true of 2-month moving average forecasting function extrapolation?
A) When forecasting ahead 4 periods, the last period forecast will be based on just forecasted values.
B) The final period forecast, will equal .
C) Each forecasted value will equal the mean of the last two actual data values.
D) The value should not be used as only a 2-month ahead forecast is valid.
A) When forecasting ahead 4 periods, the last period forecast will be based on just forecasted values.
B) The final period forecast,
will equal .C) Each forecasted value will equal the mean of the last two actual data values.
D) The value
should not be used as only a 2-month ahead forecast is valid. Unlock Deck
Unlock for access to all 125 flashcards in this deck.
Unlock Deck
k this deck
47
Exhibit 11.10
The following questions use the data below.
Joe's Sporting Goods wants to forecast quarterly sales figures using a quadratic trend model. The store has collected 12 quarters of data and needs your help to analyze the data. The relevant regression output is in the following table.
Refer to Exhibit 11.10. What formula should be entered in cell F3 to compute the quadratic trend for year 1 Quarter 1?
A) = 263.4545 * C3 + 5.985514 * D3 + 4.922577
B) = 263.4545 + 5.985514 * D3 + 4.922577 * C3
C) = 263.4545 + 5.985514 * C2 + 4.922577 * D2
D) = 263.4545 + 5.985514 * C3 + 4.922577 * D3
Unlock Deck
Unlock for access to all 125 flashcards in this deck.
Unlock Deck
k this deck
48
Exhibit 11.10
The following questions use the data below.
Joe's Sporting Goods wants to forecast quarterly sales figures using a quadratic trend model. The store has collected 12 quarters of data and needs your help to analyze the data. The relevant regression output is in the following table.
Refer to Exhibit 11.10. What are predicted sales for the fourth quarter of year 4?
A) 1170 ≤ predicted sales < 1175
B) 1310 ≤ predicted sales < 1315
C) 1460 ≤ predicted sales < 1465
D) 1615 ≤ predicted sales < 1620
Unlock Deck
Unlock for access to all 125 flashcards in this deck.
Unlock Deck
k this deck
49
As alpha increases the exponential smoothing model
A) produces sluggish forecasts.
B) reacts quickly to changes in the data.
C) reacts slowly to changes in the data.
D) does not change.
A) produces sluggish forecasts.
B) reacts quickly to changes in the data.
C) reacts slowly to changes in the data.
D) does not change.
Unlock Deck
Unlock for access to all 125 flashcards in this deck.
Unlock Deck
k this deck
50
Exhibit 11.4
The following questions use the data below.
Joe's Sporting Goods wants to forecast quarterly sales figures using the additive seasonal method. The store has collected 12 quarters of data and needs your help to analyze the data.
In the formula for MAD, MAPE, and MSE, the Yt and terms represent
A) the actual and mean values, respectively.
B) the actual and forecasted values, respectively.
C) the forecasted and actual values, respectively.
D) the predicted and forecasted values, respectively.
The following questions use the data below.
Joe's Sporting Goods wants to forecast quarterly sales figures using the additive seasonal method. The store has collected 12 quarters of data and needs your help to analyze the data.
In the formula for MAD, MAPE, and MSE, the Yt and
terms representA) the actual and mean values, respectively.
B) the actual and forecasted values, respectively.
C) the forecasted and actual values, respectively.
D) the predicted and forecasted values, respectively.
Unlock Deck
Unlock for access to all 125 flashcards in this deck.
Unlock Deck
k this deck
51
Exhibit 11.2
The following questions use the data below.
Honest Al's Used Cars wants to predict how many cars are sold each month. He has collected data for 12 months. He needs your help in analyzing this data using weighted moving averages.
Refer to Exhibit 11.2. What would be the forecasted value for time period 13?
A) 83.024.
B) 80.796.
C) 79.245.
D) 79.908.
Unlock Deck
Unlock for access to all 125 flashcards in this deck.
Unlock Deck
k this deck
52
A time series which has a significant upward or downward trend is referred to as
A) static.
B) non-moving.
C) stationary.
D) non-stationary.
A) static.
B) non-moving.
C) stationary.
D) non-stationary.
Unlock Deck
Unlock for access to all 125 flashcards in this deck.
Unlock Deck
k this deck
53
A model or technique that uses past behavior of a time-series variable to predict the future is referred to as
A) a forecasting model.
B) an extrapolation model.
C) a trend model.
D) all of these.
A) a forecasting model.
B) an extrapolation model.
C) a trend model.
D) all of these.
Unlock Deck
Unlock for access to all 125 flashcards in this deck.
Unlock Deck
k this deck
54
Exhibit 11.3
The following questions use the data below.
Honest Al's Used Cars wants to predict how many cars are sold each month. He has collected data for 12 months. He needs your help in analyzing this data using exponential smoothing.
Refer to Exhibit 11.3. Assume the forecasted value for month 13 is 79.64. What is the forecasted value for month 16?
A) 85.54.
B) 83.64.
C) 79.64.
D) 82.00.
Unlock Deck
Unlock for access to all 125 flashcards in this deck.
Unlock Deck
k this deck
55
Exhibit 11.1
The following questions use the data below.
Honest Al's Used Cars wants to predict how many cars are sold each month. He has collected data for 12 months. He needs your help in analyzing this data using moving averages.
Refer to Exhibit 11.1. If predicting the cars sold for time period 14, what formula must be placed in cell B16?
A) =AVERAGE(B12:B15)
B) =AVERAGE(B12:B15)/4
C) =TREND(B12:B15)
D) =B14
Unlock Deck
Unlock for access to all 125 flashcards in this deck.
Unlock Deck
k this deck
56
Exhibit 11.10
The following questions use the data below.
Joe's Sporting Goods wants to forecast quarterly sales figures using a quadratic trend model. The store has collected 12 quarters of data and needs your help to analyze the data. The relevant regression output is in the following table.
Refer to Exhibit 11.10. What is the Input Y Range in the Regression command settings dialog box?
A) B3:B14
B) C3:C14
C) D3:D14
D) E3:E14
Unlock Deck
Unlock for access to all 125 flashcards in this deck.
Unlock Deck
k this deck
57
Exhibit 11.2
The following questions use the data below.
Honest Al's Used Cars wants to predict how many cars are sold each month. He has collected data for 12 months. He needs your help in analyzing this data using weighted moving averages.
Refer to Exhibit 11.2. What is the 2-month weighted moving average forecast for month 3 using the weight in the spreadsheet? Associate weight w1 with sales in time period 2 and w2 with sales in time period 1.
A) 72.44
B) 75.00
C) 76.59
D) 77.56
Unlock Deck
Unlock for access to all 125 flashcards in this deck.
Unlock Deck
k this deck
58
Exhibit 11.5
The following questions use the data below.
A store wants to predict quarterly sales. The owner has collected 3 years of sales data and wants your help in analyzing the data using the multiplicative seasonal effects model.
Refer to Exhibit 11.5. What formula should be entered in cell E3 to compute the base level when using the multiplicative seasonal effects method?
A) =AVERAGE($E$3:$E$6)
B) =AVERAGE(E3, E7, E11)
C) =AVERAGE($D$3:$D$6)
D) =AVERAGE(D3, D7, D11)
Unlock Deck
Unlock for access to all 125 flashcards in this deck.
Unlock Deck
k this deck
59
Exhibit 11.4
The following questions use the data below.
Joe's Sporting Goods wants to forecast quarterly sales figures using the additive seasonal method. The store has collected 12 quarters of data and needs your help to analyze the data.
Refer to Exhibit 11.4. What formula should be entered in cell G12 to compute the forecast for time period 10?
A) =E10+F7
B) =E12+F12
C) =E12+F8
D) =E11+F8
Unlock Deck
Unlock for access to all 125 flashcards in this deck.
Unlock Deck
k this deck
60
Which of the following is the common approach to time-series analysis?
A) Try several techniques and use the best results.
B) Plot the data and count the peaks to determine a value for k.
C) Plot the data and use the TREND() function.
D) Use a stationary model since it is the most robust.
A) Try several techniques and use the best results.
B) Plot the data and count the peaks to determine a value for k.
C) Plot the data and use the TREND() function.
D) Use a stationary model since it is the most robust.
Unlock Deck
Unlock for access to all 125 flashcards in this deck.
Unlock Deck
k this deck
61
Exhibit 11.7
The following questions use the data below.
Joe's Sporting Goods wants to forecast quarterly sales figures using Holt's method. The store has collected 12 quarters of data and needs your help to analyze the data.
Refer to Exhibit 11.7. What are predicted sales for time period 13 using the data in the spreadsheet?
A) 908 ≤ predicted sales < 909
B) 1026 ≤ predicted sales < 1027
C) 1144 ≤ predicted sales < 1146
D) 1160 ≤ predicted sales < 1161
Unlock Deck
Unlock for access to all 125 flashcards in this deck.
Unlock Deck
k this deck
62
Exhibit 11.10
The following questions use the data below.
Joe's Sporting Goods wants to forecast quarterly sales figures using a quadratic trend model. The store has collected 12 quarters of data and needs your help to analyze the data. The relevant regression output is in the following table.
Refer to Exhibit 11.10. What is the Input X Range in the Regression command settings dialog box?
A) B3:B14
B) C3:C14
C) C3:D14
D) C3:E14
Unlock Deck
Unlock for access to all 125 flashcards in this deck.
Unlock Deck
k this deck
63
Exhibit 11.1
The following questions use the data below.
Honest Al's Used Cars wants to predict how many cars are sold each month. He has collected data for 12 months. He needs your help in analyzing this data using moving averages.
Refer to Exhibit 11.1. What formula should be entered in cell C13 to compute the 4-month moving average forecast for month 11?
A) =AVERAGE(B9:B12)/4
B) =AVERAGE(B7+B10)
C) =AVERAGE(A9:A12)
D) =AVERAGE(B9:B12)
Unlock Deck
Unlock for access to all 125 flashcards in this deck.
Unlock Deck
k this deck
64
Exhibit 11.10
The following questions use the data below.
Joe's Sporting Goods wants to forecast quarterly sales figures using a quadratic trend model. The store has collected 12 quarters of data and needs your help to analyze the data. The relevant regression output is in the following table.
Refer to Exhibit 11.10. What Excel command can be used in cells F4:F14 in lieu of a formula based on the regression statistics?
A) =TREND($E$3:$E$14,$C$3:$C$14,C4)
B) =TREND($E$3:$E$14,$C$3:$D$14,C4:D4)
C) =TREND($E$3:$E$14,$C$3:$D$14,D4)
D) =TREND($E$3:$E$14,$B$3:$D$14,B4:D4)
Unlock Deck
Unlock for access to all 125 flashcards in this deck.
Unlock Deck
k this deck
65
Exhibit 11.3
The following questions use the data below.
Honest Al's Used Cars wants to predict how many cars are sold each month. He has collected data for 12 months. He needs your help in analyzing this data using exponential smoothing.
Refer to Exhibit 11.3. What formula should be entered in cell C4 to compute the exponential smoothing forecast for month 2?
A) =C3-$F$3*(B3-C3)
B) =C3+$F$3*(C3-B3)
C) =B3+$F$3*(B3-C3)
D) =C3+$F$3*(B3-C3)
Unlock Deck
Unlock for access to all 125 flashcards in this deck.
Unlock Deck
k this deck
66
Exhibit 11.8
The following questions use the data below.
Joe's Sporting Goods wants to forecast quarterly sales figures using Winter's method. The store has collected 12 quarters of data and needs your help to analyze the data.
Refer to Exhibit 11.8. What are predicted sales for the first quarter of year 4?
A) 795 ≤ predicted sales < 800
B) 860 ≤ predicted sales < 865
C) 910 ≤ predicted sales < 915
D) 1280 ≤ predicted sales < 1285
Unlock Deck
Unlock for access to all 125 flashcards in this deck.
Unlock Deck
k this deck
67
Exhibit 11.4
The following questions use the data below.
Joe's Sporting Goods wants to forecast quarterly sales figures using the additive seasonal method. The store has collected 12 quarters of data and needs your help to analyze the data.
Refer to Exhibit 11.4. What are predicted sales for time period 13 using the data in the spreadsheet?
A) 915 ≤ predicted sales < 916
B) 916 ≤ predicted sales < 917
C) 991 ≤ predicted sales < 992
D) 1045 ≤ predicted sales < 1046
Unlock Deck
Unlock for access to all 125 flashcards in this deck.
Unlock Deck
k this deck
68
Exhibit 11.5
The following questions use the data below.
A store wants to predict quarterly sales. The owner has collected 3 years of sales data and wants your help in analyzing the data using the multiplicative seasonal effects model.
Refer to Exhibit 11.5. What formula should be entered in cell F7 to compute the seasonal factor using the multiplicative seasonal effects model?
A) =$J$3*D4+(1-$J$3)*(E3+F3)
B) =$J$4*(D7/E7)+(1-$J$4)*F3
C) =$J$4*(E7/E6)+(1-$J$4)*E6
D) =$J$3*G3+(1-$J$3)*(D3+G3)
Unlock Deck
Unlock for access to all 125 flashcards in this deck.
Unlock Deck
k this deck
69
In an exponential smoothing method, weights are assigned
A) just to the current actual and predicted values.
B) just to the previous data point and its predicted value.
C) to all past data points with weight α.
D) to all past data points with more recent data points receiving more weight.
A) just to the current actual and predicted values.
B) just to the previous data point and its predicted value.
C) to all past data points with weight α.
D) to all past data points with more recent data points receiving more weight.
Unlock Deck
Unlock for access to all 125 flashcards in this deck.
Unlock Deck
k this deck
70
Exhibit 11.6
The following questions use the data below.
A store wants to predict quarterly sales. The owner has collected 3 years of sales data and wants your help in analyzing the data using the double moving average model with k = 4.
Refer to Exhibit 11.6. What are predicted sales for time period 16 using the data in the spreadsheet?
A) 1964 ≤ predicted sales < 1965
B) 2147 ≤ predicted sales < 2148
C) 2330 ≤ predicted sales < 2331
D) 2513 ≤ predicted sales < 2513
Unlock Deck
Unlock for access to all 125 flashcards in this deck.
Unlock Deck
k this deck
71
Exhibit 11.2
The following questions use the data below.
Honest Al's Used Cars wants to predict how many cars are sold each month. He has collected data for 12 months. He needs your help in analyzing this data using weighted moving averages.
Refer to Exhibit 11.2. Which cell in the spreadsheet is the objective cell in the Analytic Solver Platform (ASP) task pane area?
A) F3
B) F4
C) F5
D) C16
Unlock Deck
Unlock for access to all 125 flashcards in this deck.
Unlock Deck
k this deck
72
Exhibit 11.6
The following questions use the data below.
A store wants to predict quarterly sales. The owner has collected 3 years of sales data and wants your help in analyzing the data using the double moving average model with k = 4.
Refer to Exhibit 11.6. What formula should be entered in cell F9 to compute the second average when using the double moving average method with k = 4?
A) =Average($E$3:$E$9)
B) =Average($D$3:$D$9)
C) =Average(D3:D9)
D) =Average(D6:D9)
Unlock Deck
Unlock for access to all 125 flashcards in this deck.
Unlock Deck
k this deck
73
Exhibit 11.11
The following questions use the data below.
Joe's Sporting Goods wants to forecast quarterly sales figures using seasonal indices. The store has collected 12 quarters of data and needs your help to analyze the data. The relevant regression output is in the following table.
Refer to Exhibit 11.11. What formula should be entered in cell H3 to compute the Seasonal Forecast value for year 1 Quarter 1?
A) =F3*VLOOKUP(B3,$B$18:$C$21,2)
B) =F3*HLOOKUP(B3,$B$18:$B$21,2)
C) =F3*VLOOKUP(B3,$B$18:$B$21,2)
D) =F3*VLOOKUP(B3,$C$18:$C$21,2)
Unlock Deck
Unlock for access to all 125 flashcards in this deck.
Unlock Deck
k this deck
74
Forecasting into distant future periods
A) is unreliable
B) is expensive
C) is easy
D) assumes changing data patterns
A) is unreliable
B) is expensive
C) is easy
D) assumes changing data patterns
Unlock Deck
Unlock for access to all 125 flashcards in this deck.
Unlock Deck
k this deck
75
Exhibit 11.12
The following questions use the data below.
Joe's Sporting Goods wants to forecast quarterly sales figures using a seasonal regression model. The store has collected 12 quarters of data and needs your help to analyze the data. The relevant regression output is provided in the following table.
Refer to Exhibit 11.12. What is the Input Y Range in the Regression command settings dialog box?
A) $C$3:$C$14
B) $H$3:$H$14
C) $C$3:$G$14
D) $H$3:$I$14
Unlock Deck
Unlock for access to all 125 flashcards in this deck.
Unlock Deck
k this deck
76
Why might we not be able to build a regression model to predict a dependent variable?
A) We might not know the independent variables.
B) There might not be any data available for the independent variables.
C) The regression model might not fit the data well.
D) All of these are true.
A) We might not know the independent variables.
B) There might not be any data available for the independent variables.
C) The regression model might not fit the data well.
D) All of these are true.
Unlock Deck
Unlock for access to all 125 flashcards in this deck.
Unlock Deck
k this deck
77
Exhibit 11.5
The following questions use the data below.
A store wants to predict quarterly sales. The owner has collected 3 years of sales data and wants your help in analyzing the data using the multiplicative seasonal effects model.
Refer to Exhibit 11.5. What are predicted sales for time period 13 using the data in the spreadsheet?
A) 1259 ≤ predicted sales < 1260
B) 1938 ≤ predicted sales < 1939
C) 2090 ≤ predicted sales < 2091
D) 2187 ≤ predicted sales < 2188
Unlock Deck
Unlock for access to all 125 flashcards in this deck.
Unlock Deck
k this deck
78
Exhibit 11.6
The following questions use the data below.
A store wants to predict quarterly sales. The owner has collected 3 years of sales data and wants your help in analyzing the data using the double moving average model with k = 4.
Refer to Exhibit 11.6. What formula should be entered in cell H9 to compute the trend using the double moving average model with k = 4?
A) =2*(AVERAGE(E9,F9))/4
B) =2*(E9-F9)/(4-1)
C) =2*(E9-F9)/(4*2)
D) =2*(D9-F9)/(4-1)
Unlock Deck
Unlock for access to all 125 flashcards in this deck.
Unlock Deck
k this deck
79
Why might a forecaster calculate MSE values on just the most recent data in the time-series data set?
A) The forecaster might be interested in how well the forecasting method performs on the more recent data.
B) Because the most recent data may be a better predictor of future values.
C) Because the resulting forecasting function might fit the older data better that the more recent data.
D) All of these.
Unlock Deck
Unlock for access to all 125 flashcards in this deck.
Unlock Deck
k this deck
80
Exhibit 11.7
The following questions use the data below.
Joe's Sporting Goods wants to forecast quarterly sales figures using Holt's method. The store has collected 12 quarters of data and needs your help to analyze the data.
Refer to Exhibit 11.7. What are predicted sales for time period 2 using the data in the spreadsheet?
A) 208.5 ≤ predicted sales < 209.5
B) 233.5 ≤ predicted sales < 234.5
C) 283.5 ≤ predicted sales < 284.5
D) 300.5 ≤ predicted sales < 301.5
Unlock Deck
Unlock for access to all 125 flashcards in this deck.
Unlock Deck
k this deck
Unlock Deck
Unlock for access to all 125 flashcards in this deck.


