Deck 13: Queuing Theory
Full screen (f)
Question
Exhibit 12.5
The following questions use the information below.
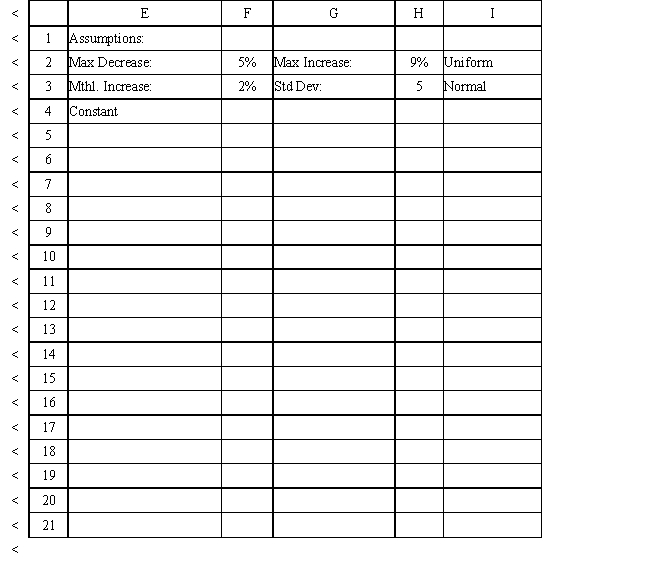
The owner of Sal's Italian Restaurant wants to study the growth of his business using simulation. He is interested in simulating the number of customers and the amount ordered by customers each month. He currently serves 1000 customers per month and feels this can vary uniformly between a decrease of as much as 5% and an increase of up to 9%. The bill for each customer is a normally distributed random variable with a mean of $20 and a standard deviation of $5. The average order has been increasing steadily over the years and the owner expects the mean order will increase by 2% per month. You have created the following spreadsheet to simulate the problem.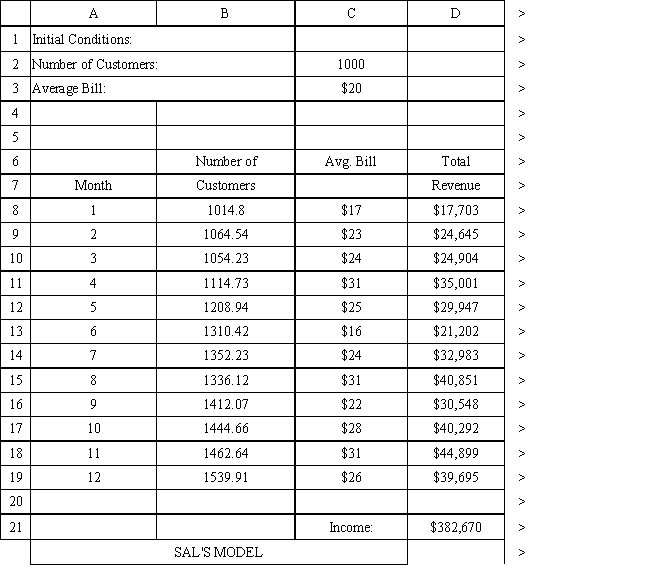
The objective in queuing problems is to find the service level that achieves an acceptable balance between the cost of providing service and customer satisfaction.
The following questions use the information below.
The owner of Sal's Italian Restaurant wants to study the growth of his business using simulation. He is interested in simulating the number of customers and the amount ordered by customers each month. He currently serves 1000 customers per month and feels this can vary uniformly between a decrease of as much as 5% and an increase of up to 9%. The bill for each customer is a normally distributed random variable with a mean of $20 and a standard deviation of $5. The average order has been increasing steadily over the years and the owner expects the mean order will increase by 2% per month. You have created the following spreadsheet to simulate the problem.
The objective in queuing problems is to find the service level that achieves an acceptable balance between the cost of providing service and customer satisfaction.
Question
Exhibit 12.5
The following questions use the information below.
The owner of Sal's Italian Restaurant wants to study the growth of his business using simulation. He is interested in simulating the number of customers and the amount ordered by customers each month. He currently serves 1000 customers per month and feels this can vary uniformly between a decrease of as much as 5% and an increase of up to 9%. The bill for each customer is a normally distributed random variable with a mean of $20 and a standard deviation of $5. The average order has been increasing steadily over the years and the owner expects the mean order will increase by 2% per month. You have created the following spreadsheet to simulate the problem.
A situation where cars arrive at an intersection can be modeled as an M/D/s queue with finite capacity.
Question
Exhibit 12.5
The following questions use the information below.
The owner of Sal's Italian Restaurant wants to study the growth of his business using simulation. He is interested in simulating the number of customers and the amount ordered by customers each month. He currently serves 1000 customers per month and feels this can vary uniformly between a decrease of as much as 5% and an increase of up to 9%. The bill for each customer is a normally distributed random variable with a mean of $20 and a standard deviation of $5. The average order has been increasing steadily over the years and the owner expects the mean order will increase by 2% per month. You have created the following spreadsheet to simulate the problem.
The amount of time a customer spends with the server is referred to as
A) system time.
B) queue time.
C) service time.
D) served time.
Question
Exhibit 12.5
The following questions use the information below.
The owner of Sal's Italian Restaurant wants to study the growth of his business using simulation. He is interested in simulating the number of customers and the amount ordered by customers each month. He currently serves 1000 customers per month and feels this can vary uniformly between a decrease of as much as 5% and an increase of up to 9%. The bill for each customer is a normally distributed random variable with a mean of $20 and a standard deviation of $5. The average order has been increasing steadily over the years and the owner expects the mean order will increase by 2% per month. You have created the following spreadsheet to simulate the problem.
One way to improve performance of a queuing system from the customer perspective is to reduce the number of servers.
Question
Exhibit 12.5
The following questions use the information below.
The owner of Sal's Italian Restaurant wants to study the growth of his business using simulation. He is interested in simulating the number of customers and the amount ordered by customers each month. He currently serves 1000 customers per month and feels this can vary uniformly between a decrease of as much as 5% and an increase of up to 9%. The bill for each customer is a normally distributed random variable with a mean of $20 and a standard deviation of $5. The average order has been increasing steadily over the years and the owner expects the mean order will increase by 2% per month. You have created the following spreadsheet to simulate the problem.
What is the service policy in the queuing systems presented in this chapter that is considered "fair" by the customers?
A) FIFO
B) LIFO
C) FILO
D) Priority
Question
Exhibit 12.5
The following questions use the information below.
The owner of Sal's Italian Restaurant wants to study the growth of his business using simulation. He is interested in simulating the number of customers and the amount ordered by customers each month. He currently serves 1000 customers per month and feels this can vary uniformly between a decrease of as much as 5% and an increase of up to 9%. The bill for each customer is a normally distributed random variable with a mean of $20 and a standard deviation of $5. The average order has been increasing steadily over the years and the owner expects the mean order will increase by 2% per month. You have created the following spreadsheet to simulate the problem.
-If the number of arrivals in a given period of time follows a Poisson distribution with mean , the interarrival times follow an exponential probability distribution with mean 1/λ
The following questions use the information below.
The owner of Sal's Italian Restaurant wants to study the growth of his business using simulation. He is interested in simulating the number of customers and the amount ordered by customers each month. He currently serves 1000 customers per month and feels this can vary uniformly between a decrease of as much as 5% and an increase of up to 9%. The bill for each customer is a normally distributed random variable with a mean of $20 and a standard deviation of $5. The average order has been increasing steadily over the years and the owner expects the mean order will increase by 2% per month. You have created the following spreadsheet to simulate the problem.
-If the number of arrivals in a given period of time follows a Poisson distribution with mean
, the interarrival times follow an exponential probability distribution with mean 1/λ Question
Exhibit 12.5
The following questions use the information below.
The owner of Sal's Italian Restaurant wants to study the growth of his business using simulation. He is interested in simulating the number of customers and the amount ordered by customers each month. He currently serves 1000 customers per month and feels this can vary uniformly between a decrease of as much as 5% and an increase of up to 9%. The bill for each customer is a normally distributed random variable with a mean of $20 and a standard deviation of $5. The average order has been increasing steadily over the years and the owner expects the mean order will increase by 2% per month. You have created the following spreadsheet to simulate the problem.
Which of the following best describes queuing theory?
A) The study of arrival rates.
B) The study of service times.
C) The study of waiting lines.
D) The evaluation of service time costs.
Question
Exhibit 12.5
The following questions use the information below.
The owner of Sal's Italian Restaurant wants to study the growth of his business using simulation. He is interested in simulating the number of customers and the amount ordered by customers each month. He currently serves 1000 customers per month and feels this can vary uniformly between a decrease of as much as 5% and an increase of up to 9%. The bill for each customer is a normally distributed random variable with a mean of $20 and a standard deviation of $5. The average order has been increasing steadily over the years and the owner expects the mean order will increase by 2% per month. You have created the following spreadsheet to simulate the problem.
If the arrival process is modeled as a Poisson random variable with arrival rate λ, then the average time between arrivals is
A) 1/μ
B) 1/λ
C) 1/λ2
D) σ
Question
Exhibit 12.5
The following questions use the information below.
The owner of Sal's Italian Restaurant wants to study the growth of his business using simulation. He is interested in simulating the number of customers and the amount ordered by customers each month. He currently serves 1000 customers per month and feels this can vary uniformly between a decrease of as much as 5% and an increase of up to 9%. The bill for each customer is a normally distributed random variable with a mean of $20 and a standard deviation of $5. The average order has been increasing steadily over the years and the owner expects the mean order will increase by 2% per month. You have created the following spreadsheet to simulate the problem.
The term queuing theory refers to the body of knowledge dealing with waiting lines.
Question
Exhibit 12.5
The following questions use the information below.
The owner of Sal's Italian Restaurant wants to study the growth of his business using simulation. He is interested in simulating the number of customers and the amount ordered by customers each month. He currently serves 1000 customers per month and feels this can vary uniformly between a decrease of as much as 5% and an increase of up to 9%. The bill for each customer is a normally distributed random variable with a mean of $20 and a standard deviation of $5. The average order has been increasing steadily over the years and the owner expects the mean order will increase by 2% per month. You have created the following spreadsheet to simulate the problem.
The M in M/G/1 stands for
A) Markovian inter-arrival times.
B) Mendelian inter-arrival times.
C) Mean inter-arrival times.
D) Mathematical inter-arrival times.
Question
Exhibit 12.5
The following questions use the information below.
The owner of Sal's Italian Restaurant wants to study the growth of his business using simulation. He is interested in simulating the number of customers and the amount ordered by customers each month. He currently serves 1000 customers per month and feels this can vary uniformly between a decrease of as much as 5% and an increase of up to 9%. The bill for each customer is a normally distributed random variable with a mean of $20 and a standard deviation of $5. The average order has been increasing steadily over the years and the owner expects the mean order will increase by 2% per month. You have created the following spreadsheet to simulate the problem.
In a queuing problem, Wq > W.
Question
Exhibit 12.5
The following questions use the information below.
The owner of Sal's Italian Restaurant wants to study the growth of his business using simulation. He is interested in simulating the number of customers and the amount ordered by customers each month. He currently serves 1000 customers per month and feels this can vary uniformly between a decrease of as much as 5% and an increase of up to 9%. The bill for each customer is a normally distributed random variable with a mean of $20 and a standard deviation of $5. The average order has been increasing steadily over the years and the owner expects the mean order will increase by 2% per month. You have created the following spreadsheet to simulate the problem.
If the service rate decreases as the arrival rate remains constant, then, in general
A) customer waiting time increases.
B) customer waiting time decreases.
C) service costs increase.
D) customer dissatisfaction decreases.
Question
Exhibit 12.5
The following questions use the information below.
The owner of Sal's Italian Restaurant wants to study the growth of his business using simulation. He is interested in simulating the number of customers and the amount ordered by customers each month. He currently serves 1000 customers per month and feels this can vary uniformly between a decrease of as much as 5% and an increase of up to 9%. The bill for each customer is a normally distributed random variable with a mean of $20 and a standard deviation of $5. The average order has been increasing steadily over the years and the owner expects the mean order will increase by 2% per month. You have created the following spreadsheet to simulate the problem.
Joe's Copy Center has 10 copiers. They break down and require service quite often. Time between breakdowns follows an exponential distribution for each copier. The repair person services machines as quickly as possible, but the service time follows an exponential distribution. What type of system is it?
A) M/M/1 with Finite Population
B) M/M/1 with Finite Queue
C) M/M/1
D) M/M/10
Question
Exhibit 12.5
The following questions use the information below.
The owner of Sal's Italian Restaurant wants to study the growth of his business using simulation. He is interested in simulating the number of customers and the amount ordered by customers each month. He currently serves 1000 customers per month and feels this can vary uniformly between a decrease of as much as 5% and an increase of up to 9%. The bill for each customer is a normally distributed random variable with a mean of $20 and a standard deviation of $5. The average order has been increasing steadily over the years and the owner expects the mean order will increase by 2% per month. You have created the following spreadsheet to simulate the problem.
What is the formula for P(t ≤ T) under the exponential distribution with rate μ?
A) 1 − eμT
B) eμT
C) 1 − e−μT
D) 1 − eT
Question
Exhibit 12.5
The following questions use the information below.
The owner of Sal's Italian Restaurant wants to study the growth of his business using simulation. He is interested in simulating the number of customers and the amount ordered by customers each month. He currently serves 1000 customers per month and feels this can vary uniformly between a decrease of as much as 5% and an increase of up to 9%. The bill for each customer is a normally distributed random variable with a mean of $20 and a standard deviation of $5. The average order has been increasing steadily over the years and the owner expects the mean order will increase by 2% per month. You have created the following spreadsheet to simulate the problem.
An arrival process is memoryless if the time until the next arrival occurs is inversely proportional to the time elapsed since the last arrival.
Question
Exhibit 12.5
The following questions use the information below.
The owner of Sal's Italian Restaurant wants to study the growth of his business using simulation. He is interested in simulating the number of customers and the amount ordered by customers each month. He currently serves 1000 customers per month and feels this can vary uniformly between a decrease of as much as 5% and an increase of up to 9%. The bill for each customer is a normally distributed random variable with a mean of $20 and a standard deviation of $5. The average order has been increasing steadily over the years and the owner expects the mean order will increase by 2% per month. You have created the following spreadsheet to simulate the problem.
The number of arrivals that occurs in a given time period represents a random variable in a queuing system.
Question
Exhibit 12.5
The following questions use the information below.
The owner of Sal's Italian Restaurant wants to study the growth of his business using simulation. He is interested in simulating the number of customers and the amount ordered by customers each month. He currently serves 1000 customers per month and feels this can vary uniformly between a decrease of as much as 5% and an increase of up to 9%. The bill for each customer is a normally distributed random variable with a mean of $20 and a standard deviation of $5. The average order has been increasing steadily over the years and the owner expects the mean order will increase by 2% per month. You have created the following spreadsheet to simulate the problem.
A barber shop has one barber, a Poisson arrival rate and exponentially distributed service times. What is the Kendall notation for this system?
A) M/M/E
B) M/M/1
C) M/E/1
D) P/M/1
Question
Exhibit 12.5
The following questions use the information below.
The owner of Sal's Italian Restaurant wants to study the growth of his business using simulation. He is interested in simulating the number of customers and the amount ordered by customers each month. He currently serves 1000 customers per month and feels this can vary uniformly between a decrease of as much as 5% and an increase of up to 9%. The bill for each customer is a normally distributed random variable with a mean of $20 and a standard deviation of $5. The average order has been increasing steadily over the years and the owner expects the mean order will increase by 2% per month. You have created the following spreadsheet to simulate the problem.
The memoryless property is also referred to as the ____ property.
A) Markov
B) Erlang
C) Poisson
D) Normal
Question
Exhibit 12.5
The following questions use the information below.
The owner of Sal's Italian Restaurant wants to study the growth of his business using simulation. He is interested in simulating the number of customers and the amount ordered by customers each month. He currently serves 1000 customers per month and feels this can vary uniformly between a decrease of as much as 5% and an increase of up to 9%. The bill for each customer is a normally distributed random variable with a mean of $20 and a standard deviation of $5. The average order has been increasing steadily over the years and the owner expects the mean order will increase by 2% per month. You have created the following spreadsheet to simulate the problem.
A balk refers to
A) a customer who refuses to join the queue.
B) a customer who refuses service by a specific server.
C) a customer who joins the queue but leaves before service is complete.
D) a customer who requires extra service time.
Question
Exhibit 12.5
The following questions use the information below.
The owner of Sal's Italian Restaurant wants to study the growth of his business using simulation. He is interested in simulating the number of customers and the amount ordered by customers each month. He currently serves 1000 customers per month and feels this can vary uniformly between a decrease of as much as 5% and an increase of up to 9%. The bill for each customer is a normally distributed random variable with a mean of $20 and a standard deviation of $5. The average order has been increasing steadily over the years and the owner expects the mean order will increase by 2% per month. You have created the following spreadsheet to simulate the problem.
In the Kendall notation M/D/4, D stands for
A) memoryless arrival distribution
B) deterministic departure distribution
C) memoryless arrival and departure distributions
D) none of the above
Question
Exhibit 13.1
The following questions are based on the output below.
A store currently operates its service system with 1 operator. Arrivals follow a Poisson distribution and service times are exponentially distributed. The following spreadsheet has been developed for the system.
In the Kendall notation M/G/4, G stands for
A) memoryless arrival distribution
B) general departure distribution
C) memoryless arrival and departure distributions
D) none of the above
Question
Exhibit 13.1
The following questions are based on the output below.
A store currently operates its service system with 1 operator. Arrivals follow a Poisson distribution and service times are exponentially distributed. The following spreadsheet has been developed for the system.
In the Kendall notation M/G/4, the number 4 indicates
A) the number of servers
B) deterministic departure distribution
C) memoryless arrival and departure distributions
D) queue capacity
Question
Exhibit 13.1
The following questions are based on the output below.
A store currently operates its service system with 1 operator. Arrivals follow a Poisson distribution and service times are exponentially distributed. The following spreadsheet has been developed for the system.
The Kendall notation for a queuing system with Poisson arrivals, exponential service and 3 service providers is
A) M/M/3
B) M/G/1
C) G/G/3
D) G/G/1
Question
Exhibit 13.1
The following questions are based on the output below.
A store currently operates its service system with 1 operator. Arrivals follow a Poisson distribution and service times are exponentially distributed. The following spreadsheet has been developed for the system.
What is the mean arrival rate based on the following 8 arrival rate observations?
Number of arrivals per hour: 6, 5, 3, 4, 7, 6, 4, 5
A) 3
B) 4
C) 5
D) 6
Question
Exhibit 12.5
The following questions use the information below.
The owner of Sal's Italian Restaurant wants to study the growth of his business using simulation. He is interested in simulating the number of customers and the amount ordered by customers each month. He currently serves 1000 customers per month and feels this can vary uniformly between a decrease of as much as 5% and an increase of up to 9%. The bill for each customer is a normally distributed random variable with a mean of $20 and a standard deviation of $5. The average order has been increasing steadily over the years and the owner expects the mean order will increase by 2% per month. You have created the following spreadsheet to simulate the problem.
A Poisson distribution shape can be described as
A) slightly skewed to the left.
B) symmetric around the parameter λ.
C) skewed to the right.
D) discrete so it lacks any definable shape.
Question
Exhibit 13.1
The following questions are based on the output below.
A store currently operates its service system with 1 operator. Arrivals follow a Poisson distribution and service times are exponentially distributed. The following spreadsheet has been developed for the system.
If a company adds an additional identical server to its M/M/1 system, making an M/M/2 system, what happens to a customer's average service time?
A) increases
B) decreases
C) it is unchanged
D) depends on the arrival rate
Question
Exhibit 13.1
The following questions are based on the output below.
A store currently operates its service system with 1 operator. Arrivals follow a Poisson distribution and service times are exponentially distributed. The following spreadsheet has been developed for the system.
An arrival process is memoryless if
A) the time until the next arrival depends on the time elapsed since the last arrival.
B) the time until the next arrival is based on the time elapsed since the last arrival.
C) the time until the next arrival does not depend on the time elapsed since the last arrival.
D) the time until the next arrival is based on the arrival rate.
Question
Exhibit 12.5
The following questions use the information below.
The owner of Sal's Italian Restaurant wants to study the growth of his business using simulation. He is interested in simulating the number of customers and the amount ordered by customers each month. He currently serves 1000 customers per month and feels this can vary uniformly between a decrease of as much as 5% and an increase of up to 9%. The bill for each customer is a normally distributed random variable with a mean of $20 and a standard deviation of $5. The average order has been increasing steadily over the years and the owner expects the mean order will increase by 2% per month. You have created the following spreadsheet to simulate the problem.
The standardized queuing system notation such as M/M/1 or M/G/2 is referred to as
A) Kendall notation.
B) Erlang notation.
C) Poisson notation.
D) Queuing notation.
Question
Exhibit 13.1
The following questions are based on the output below.
A store currently operates its service system with 1 operator. Arrivals follow a Poisson distribution and service times are exponentially distributed. The following spreadsheet has been developed for the system.
The service times for a grocery store with one checkout line have a mean of 3 minutes and a standard deviation of 20 seconds. Customer arrivals at the checkout stand follow a Poisson distribution. What type of system is it?
A) M/G/1
B) M/D/1
C) G/M/1
D) M/M/1
Question
Exhibit 12.5
The following questions use the information below.
The owner of Sal's Italian Restaurant wants to study the growth of his business using simulation. He is interested in simulating the number of customers and the amount ordered by customers each month. He currently serves 1000 customers per month and feels this can vary uniformly between a decrease of as much as 5% and an increase of up to 9%. The bill for each customer is a normally distributed random variable with a mean of $20 and a standard deviation of $5. The average order has been increasing steadily over the years and the owner expects the mean order will increase by 2% per month. You have created the following spreadsheet to simulate the problem.
For a Poisson random variable, λ represents the ____ number of arrivals per time period
A) maximum
B) minimum
C) average
D) standard deviation of
Question
Exhibit 13.1
The following questions are based on the output below.
A store currently operates its service system with 1 operator. Arrivals follow a Poisson distribution and service times are exponentially distributed. The following spreadsheet has been developed for the system.
If cell B2 contains the value for μ and cell A5 contains the value for T, what formula should go in cell B5 to compute the P(Service time) ≤ T for this exponential distribution?
A) =1-EXP($B$2*A5)
B) =EXP(-$B$2*A5)
C) =1-EXP(-$B$2)
D) =1-EXP(-$B$2*A5)
Question
Exhibit 13.1
The following questions are based on the output below.
A store currently operates its service system with 1 operator. Arrivals follow a Poisson distribution and service times are exponentially distributed. The following spreadsheet has been developed for the system.
A store is considering adding a second clerk. The customer arrival rate at this new server will be
A) twice the old rate.
B) half the old rate.
C) the same as the old rate.
D) unpredictable.
Question
Exhibit 12.5
The following questions use the information below.
The owner of Sal's Italian Restaurant wants to study the growth of his business using simulation. He is interested in simulating the number of customers and the amount ordered by customers each month. He currently serves 1000 customers per month and feels this can vary uniformly between a decrease of as much as 5% and an increase of up to 9%. The bill for each customer is a normally distributed random variable with a mean of $20 and a standard deviation of $5. The average order has been increasing steadily over the years and the owner expects the mean order will increase by 2% per month. You have created the following spreadsheet to simulate the problem.
One reason to use queuing models in business is
A) to trade-off the cost of providing service and the cost of customer dissatisfaction
B) to maximize the number of service providers
C) to minimize the cost of providing service
D) all of the above
Question
Exhibit 13.1
The following questions are based on the output below.
A store currently operates its service system with 1 operator. Arrivals follow a Poisson distribution and service times are exponentially distributed. The following spreadsheet has been developed for the system.
Refer to Exhibit 13.1. What is the probability that a customer must wait in queue before being served?
A) 0.00
B) 0.25
C) 0.75
D) 1.00
Question
Exhibit 13.1
The following questions are based on the output below.
A store currently operates its service system with 1 operator. Arrivals follow a Poisson distribution and service times are exponentially distributed. The following spreadsheet has been developed for the system.
What is the formula for the probability of x arrivals, p(x), under a Poisson distribution with arrival rate λ?
A)
B)
C)
D)
Question
Exhibit 12.5
The following questions use the information below.
The owner of Sal's Italian Restaurant wants to study the growth of his business using simulation. He is interested in simulating the number of customers and the amount ordered by customers each month. He currently serves 1000 customers per month and feels this can vary uniformly between a decrease of as much as 5% and an increase of up to 9%. The bill for each customer is a normally distributed random variable with a mean of $20 and a standard deviation of $5. The average order has been increasing steadily over the years and the owner expects the mean order will increase by 2% per month. You have created the following spreadsheet to simulate the problem.
Which of the following is a reason to employ queuing theory?
A) To reduce customer wait time in line.
B) To reduce service times.
C) To generate more arrivals to the system.
D) To reduce worker idle time in line.
Question
Exhibit 13.1
The following questions are based on the output below.
A store currently operates its service system with 1 operator. Arrivals follow a Poisson distribution and service times are exponentially distributed. The following spreadsheet has been developed for the system.
Which type of queuing system are you likely to encounter at a Wendy's restaurant?
A) Single waiting line, single service station.
B) Multiple waiting lines, single service station.
C) Single waiting line, multiple service stations.
D) Multiple waiting lines, multiple service stations.
Question
Exhibit 13.1
The following questions are based on the output below.
A store currently operates its service system with 1 operator. Arrivals follow a Poisson distribution and service times are exponentially distributed. The following spreadsheet has been developed for the system.
Which type of queuing system are you likely to encounter at an ATM?
A) Single waiting line, single service station.
B) Multiple waiting lines, single service station.
C) Single waiting line, multiple service stations.
D) Multiple waiting lines, multiple service stations.
Question
Exhibit 12.5
The following questions use the information below.
The owner of Sal's Italian Restaurant wants to study the growth of his business using simulation. He is interested in simulating the number of customers and the amount ordered by customers each month. He currently serves 1000 customers per month and feels this can vary uniformly between a decrease of as much as 5% and an increase of up to 9%. The bill for each customer is a normally distributed random variable with a mean of $20 and a standard deviation of $5. The average order has been increasing steadily over the years and the owner expects the mean order will increase by 2% per month. You have created the following spreadsheet to simulate the problem.
The number of arrivals to a store follows a Poisson distribution with mean λ = 10/hour. What is the mean inter-arrival time?
A) 6 seconds
B) 6 minutes
C) 10 minutes
D) 10 hours
Question
Exhibit 13.1
The following questions are based on the output below.
A store currently operates its service system with 1 operator. Arrivals follow a Poisson distribution and service times are exponentially distributed. The following spreadsheet has been developed for the system.
A jockey refers to
A) a customer who refuses to join the queue.
B) a customer who refuses service by a specific server.
C) a customer who joins the queue but leaves before service is complete.
D) a customer who switches between queues in the system.
Question
Exhibit 13.1
The following questions are based on the output below.
A store currently operates its service system with 1 operator. Arrivals follow a Poisson distribution and service times are exponentially distributed. The following spreadsheet has been developed for the system.
A doctor's office only has 8 chairs. The doctor's service times and customer inter-arrival times are exponentially distributed. What type of system is it?
A) M/M/1
B) M/M/8
C) M/M/1 with Finite Queue
D) M/M/1 with Finite Population
Question
Exhibit 13.1
The following questions are based on the output below.
A store currently operates its service system with 1 operator. Arrivals follow a Poisson distribution and service times are exponentially distributed. The following spreadsheet has been developed for the system.
The M/M/s model with finite capacity queue can be used to model
A) a machine breakdown process in a shop with 10 identical machines
B) traffic in a dentist's office
C) a process of patient departure from a dentist's office
D) a process of installing new machines in a shop
Question
Exhibit 13.1
The following questions are based on the output below.
A store currently operates its service system with 1 operator. Arrivals follow a Poisson distribution and service times are exponentially distributed. The following spreadsheet has been developed for the system.
Which type of queuing system are you likely to encounter at a grocery store?
A) Single waiting line, single service station.
B) Multiple waiting lines, single service station.
C) Single waiting line, multiple service stations.
D) Multiple waiting lines, multiple service stations.
Question
Exhibit 13.1
The following questions are based on the output below.
A store currently operates its service system with 1 operator. Arrivals follow a Poisson distribution and service times are exponentially distributed. The following spreadsheet has been developed for the system.
In the Kendall notation M/G/4, M stands for
A) memoryless arrival distribution
B) memoryless departure distribution
C) memoryless arrival and departure distributions
D) none of the above
Question
Exhibit 13.1
The following questions are based on the output below.
A store currently operates its service system with 1 operator. Arrivals follow a Poisson distribution and service times are exponentially distributed. The following spreadsheet has been developed for the system.
A renege refers to
A) a customer who refuses to join the queue.
B) a customer who refuses service by a specific server.
C) a customer who joins the queue but leaves before service is complete.
D) a customer who requires extra service time.
Question
Exhibit 13.1
The following questions are based on the output below.
A store currently operates its service system with 1 operator. Arrivals follow a Poisson distribution and service times are exponentially distributed. The following spreadsheet has been developed for the system.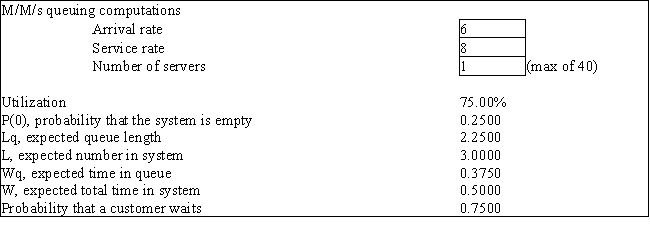
Refer to Exhibit 13.1. What is the probability that a customer can go directly into service without waiting in line?
A) 0.00
B) 0.25
C) 0.75
D) 1.00
Question
Exhibit 13.1
The following questions are based on the output below.
A store currently operates its service system with 1 operator. Arrivals follow a Poisson distribution and service times are exponentially distributed. The following spreadsheet has been developed for the system.
If a service system has a constant service time, Poisson arrival rates and 2 servers its Kendall notation is
A) P/D/2
B) M/D/2
C) M/D/1
D) G/D/2
Question
Exhibit 13.1
The following questions are based on the output below.
A store currently operates its service system with 1 operator. Arrivals follow a Poisson distribution and service times are exponentially distributed. The following spreadsheet has been developed for the system.
Joe's Copy Center has 10 copiers. They break down at a rate of 0.02 copiers per hour and are sent to the service facility. What is the average arrival rate of broken copiers to the service facility?
A) 0.02
B) 0.2
C) 10
D) It cannot be determined from the information provided.
Question
Exhibit 13.1
The following questions are based on the output below.
A store currently operates its service system with 1 operator. Arrivals follow a Poisson distribution and service times are exponentially distributed. The following spreadsheet has been developed for the system.
A common queue discipline used in practice is
A) first-in-first-out
B) random
C) last-in-first-out
D) group arrival
Question
Exhibit 13.1
The following questions are based on the output below.
A store currently operates its service system with 1 operator. Arrivals follow a Poisson distribution and service times are exponentially distributed. The following spreadsheet has been developed for the system.
Which of the following is the typical operating characteristic for the probability an arriving unit has to wait for service?
A) Wp
B) P0
C) Pw
D) Pn
Question
Exhibit 13.1
The following questions are based on the output below.
A store currently operates its service system with 1 operator. Arrivals follow a Poisson distribution and service times are exponentially distributed. The following spreadsheet has been developed for the system.
Refer to Exhibit 13.1. How many customers will be in the store on average at any one time?
A) 0.375
B) 0.50
C) 2.25
D) 3.00
Question
Exhibit 13.1
The following questions are based on the output below.
A store currently operates its service system with 1 operator. Arrivals follow a Poisson distribution and service times are exponentially distributed. The following spreadsheet has been developed for the system.
If the number of arrivals in a time period follow a Poisson distribution with mean λ then the inter-arrival times follow a(n) ____ distribution with mean ____.
A) normal; μ
B) constant; λ
C) exponential; λ
D) exponential; 1/λ
Question
Exhibit 13.1
The following questions are based on the output below.
A store currently operates its service system with 1 operator. Arrivals follow a Poisson distribution and service times are exponentially distributed. The following spreadsheet has been developed for the system.
A company has recorded the following list of service rates (customers/hour) for one of its servers. What is the mean service time for this server?
Customers / hour: 4, 4, 5, 6, 5, 4, 3, 4, 3, 5, 5, 6
A) 0.22 min
B) 1.11 min
C) 4.5 min
D) 13.3 min
Question
Exhibit 13.1
The following questions are based on the output below.
A store currently operates its service system with 1 operator. Arrivals follow a Poisson distribution and service times are exponentially distributed. The following spreadsheet has been developed for the system.
The M/M/s model with finite population can be used to model
A) a machine breakdown process in a shop with 10 identical machines
B) a process of patient arrival to a dentist's office
C) a process of patient departure from a dentist's office
D) a process of installing new machines in a shop
Question
Exhibit 13.1
The following questions are based on the output below.
A store currently operates its service system with 1 operator. Arrivals follow a Poisson distribution and service times are exponentially distributed. The following spreadsheet has been developed for the system.
The M/D/1 model results can be derived from which of the following systems?
A) M/M/1 with λ = 0
B) M/G/1 with μ = 0
C) M/G/1 with σ = 0
D) M/M/2 with finite queue length.
Question
Exhibit 13.1
The following questions are based on the output below.
A store currently operates its service system with 1 operator. Arrivals follow a Poisson distribution and service times are exponentially distributed. The following spreadsheet has been developed for the system.
What is the probability that it will take less than or equal to 0.25 hours to service any call based on the following exponential probability distribution with rate μ = 5?
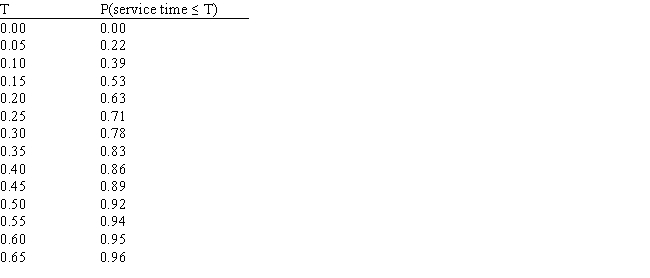
A) 0.00
B) 0.71
C) 0.92
D) 1.00
The following questions are based on the output below.
A store currently operates its service system with 1 operator. Arrivals follow a Poisson distribution and service times are exponentially distributed. The following spreadsheet has been developed for the system.
What is the probability that it will take less than or equal to 0.25 hours to service any call based on the following exponential probability distribution with rate μ = 5?
A) 0.00
B) 0.71
C) 0.92
D) 1.00
Question
Exhibit 13.1
The following questions are based on the output below.
A store currently operates its service system with 1 operator. Arrivals follow a Poisson distribution and service times are exponentially distributed. The following spreadsheet has been developed for the system.
Refer to Exhibit 13.1. What is the average amount of time spent waiting in line?
A) 0.375
B) 0.50
C) 2.25
D) 3.00
Question
Exhibit 13.1
The following questions are based on the output below.
A store currently operates its service system with 1 operator. Arrivals follow a Poisson distribution and service times are exponentially distributed. The following spreadsheet has been developed for the system.
To find steady-state values for the M/M/S queuing system, which of the following statements must be true about the arrival rate?
A) λ < s μ
B) λ − s = μ
C) λ > s μ
D) λ = s μ
Question
Exhibit 13.1
The following questions are based on the output below.
A store currently operates its service system with 1 operator. Arrivals follow a Poisson distribution and service times are exponentially distributed. The following spreadsheet has been developed for the system.
Which of the following is the typical operating characteristic for average number of units in a queue?
A) W
B) Wq
C) L
D) Lq
Question
Exhibit 13.1
The following questions are based on the output below.
A store currently operates its service system with 1 operator. Arrivals follow a Poisson distribution and service times are exponentially distributed. The following spreadsheet has been developed for the system.
Which of the following is the typical operating characteristic for average time a unit spends waiting for service?
A) W
B) Wq
C) L
D) Lq
Question
Exhibit 13.6
The following questions refer to the information and output below.
The university computer lab has 10 computers which are constantly being used by students. Users need help from the one lab assistant fairly often. Students ask for help at a Poisson rate of with an average of 4 requests per hour for any one computer. The assistant answers questions as quickly as possible and the service time follows an exponential distribution with mean of 1 minute per help session. The following queuing analysis spreadsheet was developed from this information.
Refer to Exhibit 13.6. What is the Kendall notation for this system?
Question
Exhibit 13.6
The following questions refer to the information and output below.
The university computer lab has 10 computers which are constantly being used by students. Users need help from the one lab assistant fairly often. Students ask for help at a Poisson rate of with an average of 4 requests per hour for any one computer. The assistant answers questions as quickly as possible and the service time follows an exponential distribution with mean of 1 minute per help session. The following queuing analysis spreadsheet was developed from this information.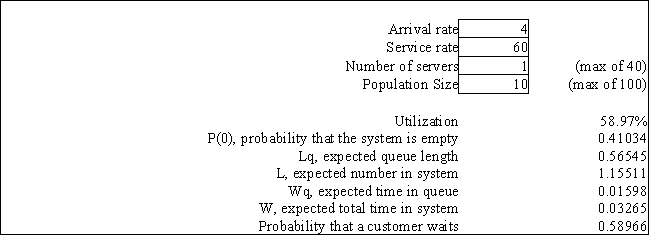
Refer to Exhibit 13.6. Based on this report what is the average number of students waiting to be helped?
Question
Exhibit 13.6
The following questions refer to the information and output below.
The university computer lab has 10 computers which are constantly being used by students. Users need help from the one lab assistant fairly often. Students ask for help at a Poisson rate of with an average of 4 requests per hour for any one computer. The assistant answers questions as quickly as possible and the service time follows an exponential distribution with mean of 1 minute per help session. The following queuing analysis spreadsheet was developed from this information.
The customer service desk at Joe's Discount Electronics store receives 5 customers per hour on average. On average, each customer requires 10 minutes for service. The customer service desk is staffed by a single person. What is the average time a customer spends in the customer service area if modeled as an M/M/1 queuing system?
Question
Exhibit 13.3
The following questions refer to the information below.
A company has recorded the following customer inter-arrival times and service times for 10 customers at one of its single teller service lines. Assume the data are exponentially distributed and the 10 data points represent a reasonable sample.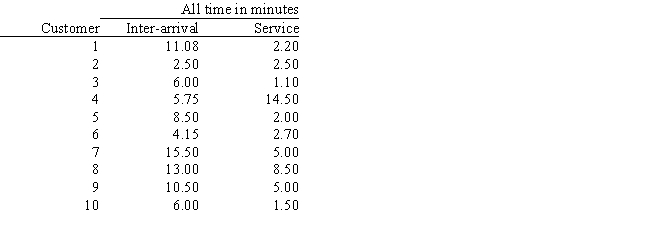
Refer to Exhibit 13.3. What is the average number of customers in the system?
Question
Exhibit 13.5
The following questions refer to the information and output below.
A computer printer in a large administrative office has a printer buffer (memory to store printing jobs) capacity of 3 jobs. If the buffer is full when a user wants to print a file the user is told that the job cannot be printed and to try again later. There are so many users in this office that we can assume that there is an infinite calling population. Jobs arrive at the printer at a Poisson rate of 55 jobs per hour and take an average of 1 minute to print. Printing times are exponentially distributed. The following queuing analysis spreadsheet was developed from this information.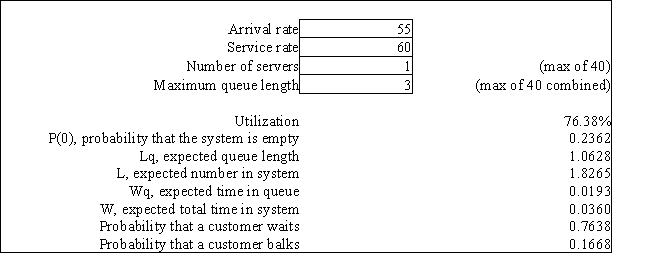
Refer to Exhibit 13.5. Based on this report what is the probability that a computer user will be told to resubmit a print job at a later time?
Question
Exhibit 13.4
The following questions refer to the information and output below.
A grocery store can serve an average of 360 customers per hour. The service times are exponentially distributed. The store has 4 checkout lines each of which serves 90 customers per hour. Customers arrive at the store at a Poisson rate of 240 customers per hour. The following queuing analysis spreadsheet was developed from this information.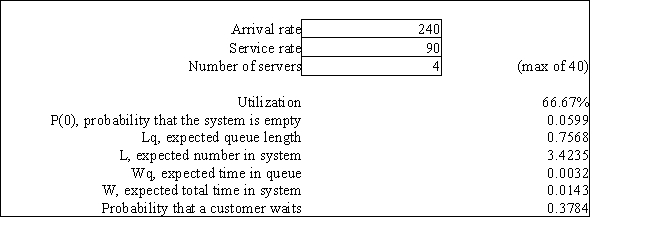
Refer to Exhibit 13.4. What is the Kendall notation for this system?
Question
A company has recorded the following list of service rates (customers/hour) for one of its servers. What is the mean service time for this server? 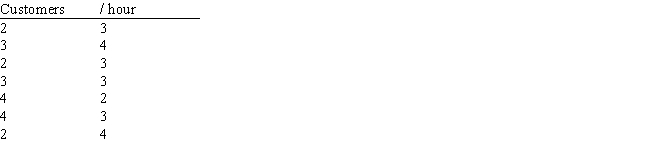
Question
Exhibit 13.7
The following questions refer to the information and output below.
A tax accountant has found that the time to serve a customer has a mean of 30 minutes (or 0.5 hours) and a standard deviation of 6 minutes (or 0.1 hours). Customer arrivals follow a Poisson distribution with an average of 60 minutes between arrivals. The following queuing analysis spreadsheet was developed from this information.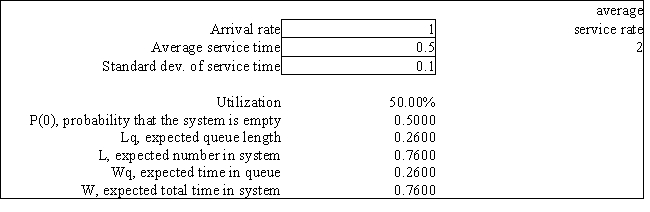
Refer to Exhibit 13.7. Based on this report how long does a customer spend at the tax accountant's office?
Question
Exhibit 13.4
The following questions refer to the information and output below.
A grocery store can serve an average of 360 customers per hour. The service times are exponentially distributed. The store has 4 checkout lines each of which serves 90 customers per hour. Customers arrive at the store at a Poisson rate of 240 customers per hour. The following queuing analysis spreadsheet was developed from this information.
Refer to Exhibit 13.4. Based on this report what percent of the time is a grocery clerk busy serving a customer?
Question
Exhibit 13.1
The following questions are based on the output below.
A store currently operates its service system with 1 operator. Arrivals follow a Poisson distribution and service times are exponentially distributed. The following spreadsheet has been developed for the system.
The M/D/1 model with infinite capacity queue can be used to model
A) a machine breakdown process in a shop with 10 identical machines
B) a process of washing a car in an automatic car wash
C) a process of patient departure from a dentist's office
D) a process of installing new machines in a shop
Question
Exhibit 13.2
The following questions refer to the information and output below.
A barber shop has one barber who can give 12 haircuts per hour. Customers arrive at a rate of 8 customers per hour. Customer inter-arrival times and service times are exponentially distributed. The following queuing analysis spreadsheet was developed from this information.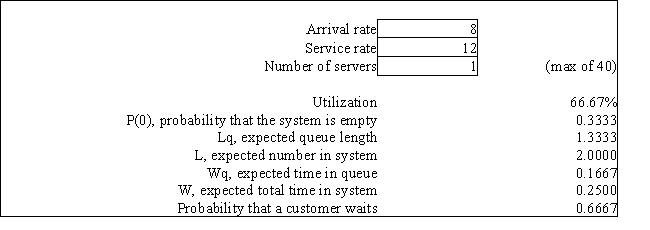
Refer to Exhibit 13.2. Based on this report what is the average number of customers waiting for a haircut?
Question
Question
Question
Exhibit 13.6
The following questions refer to the information and output below.
The university computer lab has 10 computers which are constantly being used by students. Users need help from the one lab assistant fairly often. Students ask for help at a Poisson rate of with an average of 4 requests per hour for any one computer. The assistant answers questions as quickly as possible and the service time follows an exponential distribution with mean of 1 minute per help session. The following queuing analysis spreadsheet was developed from this information.
Customers arrive at a store randomly, following a Poisson distribution at an average rate of 20 per hour. What is the probability of exactly 0, 1 2, and 3 arrivals in a 15 minute period?
Question
Exhibit 13.7
The following questions refer to the information and output below.
A tax accountant has found that the time to serve a customer has a mean of 30 minutes (or 0.5 hours) and a standard deviation of 6 minutes (or 0.1 hours). Customer arrivals follow a Poisson distribution with an average of 60 minutes between arrivals. The following queuing analysis spreadsheet was developed from this information.
Refer to Exhibit 13.7. What is the Kendall notation for this system?
Question
Exhibit 13.6
The following questions refer to the information and output below.
The university computer lab has 10 computers which are constantly being used by students. Users need help from the one lab assistant fairly often. Students ask for help at a Poisson rate of with an average of 4 requests per hour for any one computer. The assistant answers questions as quickly as possible and the service time follows an exponential distribution with mean of 1 minute per help session. The following queuing analysis spreadsheet was developed from this information.
Refer to Exhibit 13.6. Based on this report how much time do students spend getting help before they can resume work on their computers?
Question
Exhibit 13.2
The following questions refer to the information and output below.
A barber shop has one barber who can give 12 haircuts per hour. Customers arrive at a rate of 8 customers per hour. Customer inter-arrival times and service times are exponentially distributed. The following queuing analysis spreadsheet was developed from this information.
Customers arrive at a store randomly, following a Poisson distribution at an average rate of 90 per hour. How many customers arrive per minute, on average?
Question
Exhibit 13.5
The following questions refer to the information and output below.
A computer printer in a large administrative office has a printer buffer (memory to store printing jobs) capacity of 3 jobs. If the buffer is full when a user wants to print a file the user is told that the job cannot be printed and to try again later. There are so many users in this office that we can assume that there is an infinite calling population. Jobs arrive at the printer at a Poisson rate of 55 jobs per hour and take an average of 1 minute to print. Printing times are exponentially distributed. The following queuing analysis spreadsheet was developed from this information.
Refer to Exhibit 13.5. What is the Kendall notation for this system?
Question
Exhibit 13.4
The following questions refer to the information and output below.
A grocery store can serve an average of 360 customers per hour. The service times are exponentially distributed. The store has 4 checkout lines each of which serves 90 customers per hour. Customers arrive at the store at a Poisson rate of 240 customers per hour. The following queuing analysis spreadsheet was developed from this information.
Refer to Exhibit 13.4. Based on this report what is the average number of customers waiting for a checker?
Question
Exhibit 13.3
The following questions refer to the information below.
A company has recorded the following customer inter-arrival times and service times for 10 customers at one of its single teller service lines. Assume the data are exponentially distributed and the 10 data points represent a reasonable sample.
Refer to Exhibit 13.3. What is the mean service rate per hour?

Unlock Deck
Sign up to unlock the cards in this deck!
Unlock Deck
Unlock Deck
1/97
Play
Full screen (f)
Deck 13: Queuing Theory
1
Exhibit 12.5
The following questions use the information below.
The owner of Sal's Italian Restaurant wants to study the growth of his business using simulation. He is interested in simulating the number of customers and the amount ordered by customers each month. He currently serves 1000 customers per month and feels this can vary uniformly between a decrease of as much as 5% and an increase of up to 9%. The bill for each customer is a normally distributed random variable with a mean of $20 and a standard deviation of $5. The average order has been increasing steadily over the years and the owner expects the mean order will increase by 2% per month. You have created the following spreadsheet to simulate the problem.
The objective in queuing problems is to find the service level that achieves an acceptable balance between the cost of providing service and customer satisfaction.
True
2
Exhibit 12.5
The following questions use the information below.
The owner of Sal's Italian Restaurant wants to study the growth of his business using simulation. He is interested in simulating the number of customers and the amount ordered by customers each month. He currently serves 1000 customers per month and feels this can vary uniformly between a decrease of as much as 5% and an increase of up to 9%. The bill for each customer is a normally distributed random variable with a mean of $20 and a standard deviation of $5. The average order has been increasing steadily over the years and the owner expects the mean order will increase by 2% per month. You have created the following spreadsheet to simulate the problem.
A situation where cars arrive at an intersection can be modeled as an M/D/s queue with finite capacity.
False
3
Exhibit 12.5
The following questions use the information below.
The owner of Sal's Italian Restaurant wants to study the growth of his business using simulation. He is interested in simulating the number of customers and the amount ordered by customers each month. He currently serves 1000 customers per month and feels this can vary uniformly between a decrease of as much as 5% and an increase of up to 9%. The bill for each customer is a normally distributed random variable with a mean of $20 and a standard deviation of $5. The average order has been increasing steadily over the years and the owner expects the mean order will increase by 2% per month. You have created the following spreadsheet to simulate the problem.
The amount of time a customer spends with the server is referred to as
A) system time.
B) queue time.
C) service time.
D) served time.
service time.
4
Exhibit 12.5
The following questions use the information below.
The owner of Sal's Italian Restaurant wants to study the growth of his business using simulation. He is interested in simulating the number of customers and the amount ordered by customers each month. He currently serves 1000 customers per month and feels this can vary uniformly between a decrease of as much as 5% and an increase of up to 9%. The bill for each customer is a normally distributed random variable with a mean of $20 and a standard deviation of $5. The average order has been increasing steadily over the years and the owner expects the mean order will increase by 2% per month. You have created the following spreadsheet to simulate the problem.
One way to improve performance of a queuing system from the customer perspective is to reduce the number of servers.
Unlock Deck
Unlock for access to all 97 flashcards in this deck.
Unlock Deck
k this deck
5
Exhibit 12.5
The following questions use the information below.
The owner of Sal's Italian Restaurant wants to study the growth of his business using simulation. He is interested in simulating the number of customers and the amount ordered by customers each month. He currently serves 1000 customers per month and feels this can vary uniformly between a decrease of as much as 5% and an increase of up to 9%. The bill for each customer is a normally distributed random variable with a mean of $20 and a standard deviation of $5. The average order has been increasing steadily over the years and the owner expects the mean order will increase by 2% per month. You have created the following spreadsheet to simulate the problem.
What is the service policy in the queuing systems presented in this chapter that is considered "fair" by the customers?
A) FIFO
B) LIFO
C) FILO
D) Priority
Unlock Deck
Unlock for access to all 97 flashcards in this deck.
Unlock Deck
k this deck
6
Exhibit 12.5
The following questions use the information below.
The owner of Sal's Italian Restaurant wants to study the growth of his business using simulation. He is interested in simulating the number of customers and the amount ordered by customers each month. He currently serves 1000 customers per month and feels this can vary uniformly between a decrease of as much as 5% and an increase of up to 9%. The bill for each customer is a normally distributed random variable with a mean of $20 and a standard deviation of $5. The average order has been increasing steadily over the years and the owner expects the mean order will increase by 2% per month. You have created the following spreadsheet to simulate the problem.
-If the number of arrivals in a given period of time follows a Poisson distribution with mean, the interarrival times follow an exponential probability distribution with mean 1/λ
The following questions use the information below.
The owner of Sal's Italian Restaurant wants to study the growth of his business using simulation. He is interested in simulating the number of customers and the amount ordered by customers each month. He currently serves 1000 customers per month and feels this can vary uniformly between a decrease of as much as 5% and an increase of up to 9%. The bill for each customer is a normally distributed random variable with a mean of $20 and a standard deviation of $5. The average order has been increasing steadily over the years and the owner expects the mean order will increase by 2% per month. You have created the following spreadsheet to simulate the problem.
-If the number of arrivals in a given period of time follows a Poisson distribution with mean
, the interarrival times follow an exponential probability distribution with mean 1/λ Unlock Deck
Unlock for access to all 97 flashcards in this deck.
Unlock Deck
k this deck
7
Exhibit 12.5
The following questions use the information below.
The owner of Sal's Italian Restaurant wants to study the growth of his business using simulation. He is interested in simulating the number of customers and the amount ordered by customers each month. He currently serves 1000 customers per month and feels this can vary uniformly between a decrease of as much as 5% and an increase of up to 9%. The bill for each customer is a normally distributed random variable with a mean of $20 and a standard deviation of $5. The average order has been increasing steadily over the years and the owner expects the mean order will increase by 2% per month. You have created the following spreadsheet to simulate the problem.
Which of the following best describes queuing theory?
A) The study of arrival rates.
B) The study of service times.
C) The study of waiting lines.
D) The evaluation of service time costs.
Unlock Deck
Unlock for access to all 97 flashcards in this deck.
Unlock Deck
k this deck
8
Exhibit 12.5
The following questions use the information below.
The owner of Sal's Italian Restaurant wants to study the growth of his business using simulation. He is interested in simulating the number of customers and the amount ordered by customers each month. He currently serves 1000 customers per month and feels this can vary uniformly between a decrease of as much as 5% and an increase of up to 9%. The bill for each customer is a normally distributed random variable with a mean of $20 and a standard deviation of $5. The average order has been increasing steadily over the years and the owner expects the mean order will increase by 2% per month. You have created the following spreadsheet to simulate the problem.
If the arrival process is modeled as a Poisson random variable with arrival rate λ, then the average time between arrivals is
A) 1/μ
B) 1/λ
C) 1/λ2
D) σ
Unlock Deck
Unlock for access to all 97 flashcards in this deck.
Unlock Deck
k this deck
9
Exhibit 12.5
The following questions use the information below.
The owner of Sal's Italian Restaurant wants to study the growth of his business using simulation. He is interested in simulating the number of customers and the amount ordered by customers each month. He currently serves 1000 customers per month and feels this can vary uniformly between a decrease of as much as 5% and an increase of up to 9%. The bill for each customer is a normally distributed random variable with a mean of $20 and a standard deviation of $5. The average order has been increasing steadily over the years and the owner expects the mean order will increase by 2% per month. You have created the following spreadsheet to simulate the problem.
The term queuing theory refers to the body of knowledge dealing with waiting lines.
Unlock Deck
Unlock for access to all 97 flashcards in this deck.
Unlock Deck
k this deck
10
Exhibit 12.5
The following questions use the information below.
The owner of Sal's Italian Restaurant wants to study the growth of his business using simulation. He is interested in simulating the number of customers and the amount ordered by customers each month. He currently serves 1000 customers per month and feels this can vary uniformly between a decrease of as much as 5% and an increase of up to 9%. The bill for each customer is a normally distributed random variable with a mean of $20 and a standard deviation of $5. The average order has been increasing steadily over the years and the owner expects the mean order will increase by 2% per month. You have created the following spreadsheet to simulate the problem.
The M in M/G/1 stands for
A) Markovian inter-arrival times.
B) Mendelian inter-arrival times.
C) Mean inter-arrival times.
D) Mathematical inter-arrival times.
Unlock Deck
Unlock for access to all 97 flashcards in this deck.
Unlock Deck
k this deck
11
Exhibit 12.5
The following questions use the information below.
The owner of Sal's Italian Restaurant wants to study the growth of his business using simulation. He is interested in simulating the number of customers and the amount ordered by customers each month. He currently serves 1000 customers per month and feels this can vary uniformly between a decrease of as much as 5% and an increase of up to 9%. The bill for each customer is a normally distributed random variable with a mean of $20 and a standard deviation of $5. The average order has been increasing steadily over the years and the owner expects the mean order will increase by 2% per month. You have created the following spreadsheet to simulate the problem.
In a queuing problem, Wq > W.
Unlock Deck
Unlock for access to all 97 flashcards in this deck.
Unlock Deck
k this deck
12
Exhibit 12.5
The following questions use the information below.
The owner of Sal's Italian Restaurant wants to study the growth of his business using simulation. He is interested in simulating the number of customers and the amount ordered by customers each month. He currently serves 1000 customers per month and feels this can vary uniformly between a decrease of as much as 5% and an increase of up to 9%. The bill for each customer is a normally distributed random variable with a mean of $20 and a standard deviation of $5. The average order has been increasing steadily over the years and the owner expects the mean order will increase by 2% per month. You have created the following spreadsheet to simulate the problem.
If the service rate decreases as the arrival rate remains constant, then, in general
A) customer waiting time increases.
B) customer waiting time decreases.
C) service costs increase.
D) customer dissatisfaction decreases.
Unlock Deck
Unlock for access to all 97 flashcards in this deck.
Unlock Deck
k this deck
13
Exhibit 12.5
The following questions use the information below.
The owner of Sal's Italian Restaurant wants to study the growth of his business using simulation. He is interested in simulating the number of customers and the amount ordered by customers each month. He currently serves 1000 customers per month and feels this can vary uniformly between a decrease of as much as 5% and an increase of up to 9%. The bill for each customer is a normally distributed random variable with a mean of $20 and a standard deviation of $5. The average order has been increasing steadily over the years and the owner expects the mean order will increase by 2% per month. You have created the following spreadsheet to simulate the problem.
Joe's Copy Center has 10 copiers. They break down and require service quite often. Time between breakdowns follows an exponential distribution for each copier. The repair person services machines as quickly as possible, but the service time follows an exponential distribution. What type of system is it?
A) M/M/1 with Finite Population
B) M/M/1 with Finite Queue
C) M/M/1
D) M/M/10
Unlock Deck
Unlock for access to all 97 flashcards in this deck.
Unlock Deck
k this deck
14
Exhibit 12.5
The following questions use the information below.
The owner of Sal's Italian Restaurant wants to study the growth of his business using simulation. He is interested in simulating the number of customers and the amount ordered by customers each month. He currently serves 1000 customers per month and feels this can vary uniformly between a decrease of as much as 5% and an increase of up to 9%. The bill for each customer is a normally distributed random variable with a mean of $20 and a standard deviation of $5. The average order has been increasing steadily over the years and the owner expects the mean order will increase by 2% per month. You have created the following spreadsheet to simulate the problem.
What is the formula for P(t ≤ T) under the exponential distribution with rate μ?
A) 1 − eμT
B) eμT
C) 1 − e−μT
D) 1 − eT
Unlock Deck
Unlock for access to all 97 flashcards in this deck.
Unlock Deck
k this deck
15
Exhibit 12.5
The following questions use the information below.
The owner of Sal's Italian Restaurant wants to study the growth of his business using simulation. He is interested in simulating the number of customers and the amount ordered by customers each month. He currently serves 1000 customers per month and feels this can vary uniformly between a decrease of as much as 5% and an increase of up to 9%. The bill for each customer is a normally distributed random variable with a mean of $20 and a standard deviation of $5. The average order has been increasing steadily over the years and the owner expects the mean order will increase by 2% per month. You have created the following spreadsheet to simulate the problem.
An arrival process is memoryless if the time until the next arrival occurs is inversely proportional to the time elapsed since the last arrival.
Unlock Deck
Unlock for access to all 97 flashcards in this deck.
Unlock Deck
k this deck
16
Exhibit 12.5
The following questions use the information below.
The owner of Sal's Italian Restaurant wants to study the growth of his business using simulation. He is interested in simulating the number of customers and the amount ordered by customers each month. He currently serves 1000 customers per month and feels this can vary uniformly between a decrease of as much as 5% and an increase of up to 9%. The bill for each customer is a normally distributed random variable with a mean of $20 and a standard deviation of $5. The average order has been increasing steadily over the years and the owner expects the mean order will increase by 2% per month. You have created the following spreadsheet to simulate the problem.
The number of arrivals that occurs in a given time period represents a random variable in a queuing system.
Unlock Deck
Unlock for access to all 97 flashcards in this deck.
Unlock Deck
k this deck
17
Exhibit 12.5
The following questions use the information below.
The owner of Sal's Italian Restaurant wants to study the growth of his business using simulation. He is interested in simulating the number of customers and the amount ordered by customers each month. He currently serves 1000 customers per month and feels this can vary uniformly between a decrease of as much as 5% and an increase of up to 9%. The bill for each customer is a normally distributed random variable with a mean of $20 and a standard deviation of $5. The average order has been increasing steadily over the years and the owner expects the mean order will increase by 2% per month. You have created the following spreadsheet to simulate the problem.
A barber shop has one barber, a Poisson arrival rate and exponentially distributed service times. What is the Kendall notation for this system?
A) M/M/E
B) M/M/1
C) M/E/1
D) P/M/1
Unlock Deck
Unlock for access to all 97 flashcards in this deck.
Unlock Deck
k this deck
18
Exhibit 12.5
The following questions use the information below.
The owner of Sal's Italian Restaurant wants to study the growth of his business using simulation. He is interested in simulating the number of customers and the amount ordered by customers each month. He currently serves 1000 customers per month and feels this can vary uniformly between a decrease of as much as 5% and an increase of up to 9%. The bill for each customer is a normally distributed random variable with a mean of $20 and a standard deviation of $5. The average order has been increasing steadily over the years and the owner expects the mean order will increase by 2% per month. You have created the following spreadsheet to simulate the problem.
The memoryless property is also referred to as the ____ property.
A) Markov
B) Erlang
C) Poisson
D) Normal
Unlock Deck
Unlock for access to all 97 flashcards in this deck.
Unlock Deck
k this deck
19
Exhibit 12.5
The following questions use the information below.
The owner of Sal's Italian Restaurant wants to study the growth of his business using simulation. He is interested in simulating the number of customers and the amount ordered by customers each month. He currently serves 1000 customers per month and feels this can vary uniformly between a decrease of as much as 5% and an increase of up to 9%. The bill for each customer is a normally distributed random variable with a mean of $20 and a standard deviation of $5. The average order has been increasing steadily over the years and the owner expects the mean order will increase by 2% per month. You have created the following spreadsheet to simulate the problem.
A balk refers to
A) a customer who refuses to join the queue.
B) a customer who refuses service by a specific server.
C) a customer who joins the queue but leaves before service is complete.
D) a customer who requires extra service time.
Unlock Deck
Unlock for access to all 97 flashcards in this deck.
Unlock Deck
k this deck
20
Exhibit 12.5
The following questions use the information below.
The owner of Sal's Italian Restaurant wants to study the growth of his business using simulation. He is interested in simulating the number of customers and the amount ordered by customers each month. He currently serves 1000 customers per month and feels this can vary uniformly between a decrease of as much as 5% and an increase of up to 9%. The bill for each customer is a normally distributed random variable with a mean of $20 and a standard deviation of $5. The average order has been increasing steadily over the years and the owner expects the mean order will increase by 2% per month. You have created the following spreadsheet to simulate the problem.
In the Kendall notation M/D/4, D stands for
A) memoryless arrival distribution
B) deterministic departure distribution
C) memoryless arrival and departure distributions
D) none of the above
Unlock Deck
Unlock for access to all 97 flashcards in this deck.
Unlock Deck
k this deck
21
Exhibit 13.1
The following questions are based on the output below.
A store currently operates its service system with 1 operator. Arrivals follow a Poisson distribution and service times are exponentially distributed. The following spreadsheet has been developed for the system.
In the Kendall notation M/G/4, G stands for
A) memoryless arrival distribution
B) general departure distribution
C) memoryless arrival and departure distributions
D) none of the above
Unlock Deck
Unlock for access to all 97 flashcards in this deck.
Unlock Deck
k this deck
22
Exhibit 13.1
The following questions are based on the output below.
A store currently operates its service system with 1 operator. Arrivals follow a Poisson distribution and service times are exponentially distributed. The following spreadsheet has been developed for the system.
In the Kendall notation M/G/4, the number 4 indicates
A) the number of servers
B) deterministic departure distribution
C) memoryless arrival and departure distributions
D) queue capacity
Unlock Deck
Unlock for access to all 97 flashcards in this deck.
Unlock Deck
k this deck
23
Exhibit 13.1
The following questions are based on the output below.
A store currently operates its service system with 1 operator. Arrivals follow a Poisson distribution and service times are exponentially distributed. The following spreadsheet has been developed for the system.
The Kendall notation for a queuing system with Poisson arrivals, exponential service and 3 service providers is
A) M/M/3
B) M/G/1
C) G/G/3
D) G/G/1
Unlock Deck
Unlock for access to all 97 flashcards in this deck.
Unlock Deck
k this deck
24
Exhibit 13.1
The following questions are based on the output below.
A store currently operates its service system with 1 operator. Arrivals follow a Poisson distribution and service times are exponentially distributed. The following spreadsheet has been developed for the system.
What is the mean arrival rate based on the following 8 arrival rate observations?
Number of arrivals per hour: 6, 5, 3, 4, 7, 6, 4, 5
A) 3
B) 4
C) 5
D) 6
Unlock Deck
Unlock for access to all 97 flashcards in this deck.
Unlock Deck
k this deck
25
Exhibit 12.5
The following questions use the information below.
The owner of Sal's Italian Restaurant wants to study the growth of his business using simulation. He is interested in simulating the number of customers and the amount ordered by customers each month. He currently serves 1000 customers per month and feels this can vary uniformly between a decrease of as much as 5% and an increase of up to 9%. The bill for each customer is a normally distributed random variable with a mean of $20 and a standard deviation of $5. The average order has been increasing steadily over the years and the owner expects the mean order will increase by 2% per month. You have created the following spreadsheet to simulate the problem.
A Poisson distribution shape can be described as
A) slightly skewed to the left.
B) symmetric around the parameter λ.
C) skewed to the right.
D) discrete so it lacks any definable shape.
Unlock Deck
Unlock for access to all 97 flashcards in this deck.
Unlock Deck
k this deck
26
Exhibit 13.1
The following questions are based on the output below.
A store currently operates its service system with 1 operator. Arrivals follow a Poisson distribution and service times are exponentially distributed. The following spreadsheet has been developed for the system.
If a company adds an additional identical server to its M/M/1 system, making an M/M/2 system, what happens to a customer's average service time?
A) increases
B) decreases
C) it is unchanged
D) depends on the arrival rate
Unlock Deck
Unlock for access to all 97 flashcards in this deck.
Unlock Deck
k this deck
27
Exhibit 13.1
The following questions are based on the output below.
A store currently operates its service system with 1 operator. Arrivals follow a Poisson distribution and service times are exponentially distributed. The following spreadsheet has been developed for the system.
An arrival process is memoryless if
A) the time until the next arrival depends on the time elapsed since the last arrival.
B) the time until the next arrival is based on the time elapsed since the last arrival.
C) the time until the next arrival does not depend on the time elapsed since the last arrival.
D) the time until the next arrival is based on the arrival rate.
Unlock Deck
Unlock for access to all 97 flashcards in this deck.
Unlock Deck
k this deck
28
Exhibit 12.5
The following questions use the information below.
The owner of Sal's Italian Restaurant wants to study the growth of his business using simulation. He is interested in simulating the number of customers and the amount ordered by customers each month. He currently serves 1000 customers per month and feels this can vary uniformly between a decrease of as much as 5% and an increase of up to 9%. The bill for each customer is a normally distributed random variable with a mean of $20 and a standard deviation of $5. The average order has been increasing steadily over the years and the owner expects the mean order will increase by 2% per month. You have created the following spreadsheet to simulate the problem.
The standardized queuing system notation such as M/M/1 or M/G/2 is referred to as
A) Kendall notation.
B) Erlang notation.
C) Poisson notation.
D) Queuing notation.
Unlock Deck
Unlock for access to all 97 flashcards in this deck.
Unlock Deck
k this deck
29
Exhibit 13.1
The following questions are based on the output below.
A store currently operates its service system with 1 operator. Arrivals follow a Poisson distribution and service times are exponentially distributed. The following spreadsheet has been developed for the system.
The service times for a grocery store with one checkout line have a mean of 3 minutes and a standard deviation of 20 seconds. Customer arrivals at the checkout stand follow a Poisson distribution. What type of system is it?
A) M/G/1
B) M/D/1
C) G/M/1
D) M/M/1
Unlock Deck
Unlock for access to all 97 flashcards in this deck.
Unlock Deck
k this deck
30
Exhibit 12.5
The following questions use the information below.
The owner of Sal's Italian Restaurant wants to study the growth of his business using simulation. He is interested in simulating the number of customers and the amount ordered by customers each month. He currently serves 1000 customers per month and feels this can vary uniformly between a decrease of as much as 5% and an increase of up to 9%. The bill for each customer is a normally distributed random variable with a mean of $20 and a standard deviation of $5. The average order has been increasing steadily over the years and the owner expects the mean order will increase by 2% per month. You have created the following spreadsheet to simulate the problem.
For a Poisson random variable, λ represents the ____ number of arrivals per time period
A) maximum
B) minimum
C) average
D) standard deviation of
Unlock Deck
Unlock for access to all 97 flashcards in this deck.
Unlock Deck
k this deck
31
Exhibit 13.1
The following questions are based on the output below.
A store currently operates its service system with 1 operator. Arrivals follow a Poisson distribution and service times are exponentially distributed. The following spreadsheet has been developed for the system.
If cell B2 contains the value for μ and cell A5 contains the value for T, what formula should go in cell B5 to compute the P(Service time) ≤ T for this exponential distribution?
A) =1-EXP($B$2*A5)
B) =EXP(-$B$2*A5)
C) =1-EXP(-$B$2)
D) =1-EXP(-$B$2*A5)
Unlock Deck
Unlock for access to all 97 flashcards in this deck.
Unlock Deck
k this deck
32
Exhibit 13.1
The following questions are based on the output below.
A store currently operates its service system with 1 operator. Arrivals follow a Poisson distribution and service times are exponentially distributed. The following spreadsheet has been developed for the system.
A store is considering adding a second clerk. The customer arrival rate at this new server will be
A) twice the old rate.
B) half the old rate.
C) the same as the old rate.
D) unpredictable.
Unlock Deck
Unlock for access to all 97 flashcards in this deck.
Unlock Deck
k this deck
33
Exhibit 12.5
The following questions use the information below.
The owner of Sal's Italian Restaurant wants to study the growth of his business using simulation. He is interested in simulating the number of customers and the amount ordered by customers each month. He currently serves 1000 customers per month and feels this can vary uniformly between a decrease of as much as 5% and an increase of up to 9%. The bill for each customer is a normally distributed random variable with a mean of $20 and a standard deviation of $5. The average order has been increasing steadily over the years and the owner expects the mean order will increase by 2% per month. You have created the following spreadsheet to simulate the problem.
One reason to use queuing models in business is
A) to trade-off the cost of providing service and the cost of customer dissatisfaction
B) to maximize the number of service providers
C) to minimize the cost of providing service
D) all of the above
Unlock Deck
Unlock for access to all 97 flashcards in this deck.
Unlock Deck
k this deck
34
Exhibit 13.1
The following questions are based on the output below.
A store currently operates its service system with 1 operator. Arrivals follow a Poisson distribution and service times are exponentially distributed. The following spreadsheet has been developed for the system.
Refer to Exhibit 13.1. What is the probability that a customer must wait in queue before being served?
A) 0.00
B) 0.25
C) 0.75
D) 1.00
Unlock Deck
Unlock for access to all 97 flashcards in this deck.
Unlock Deck
k this deck
35
Exhibit 13.1
The following questions are based on the output below.
A store currently operates its service system with 1 operator. Arrivals follow a Poisson distribution and service times are exponentially distributed. The following spreadsheet has been developed for the system.
What is the formula for the probability of x arrivals, p(x), under a Poisson distribution with arrival rate λ?
A)
B)
C)
D)
Unlock Deck
Unlock for access to all 97 flashcards in this deck.
Unlock Deck
k this deck
36
Exhibit 12.5
The following questions use the information below.
The owner of Sal's Italian Restaurant wants to study the growth of his business using simulation. He is interested in simulating the number of customers and the amount ordered by customers each month. He currently serves 1000 customers per month and feels this can vary uniformly between a decrease of as much as 5% and an increase of up to 9%. The bill for each customer is a normally distributed random variable with a mean of $20 and a standard deviation of $5. The average order has been increasing steadily over the years and the owner expects the mean order will increase by 2% per month. You have created the following spreadsheet to simulate the problem.
Which of the following is a reason to employ queuing theory?
A) To reduce customer wait time in line.
B) To reduce service times.
C) To generate more arrivals to the system.
D) To reduce worker idle time in line.
Unlock Deck
Unlock for access to all 97 flashcards in this deck.
Unlock Deck
k this deck
37
Exhibit 13.1
The following questions are based on the output below.
A store currently operates its service system with 1 operator. Arrivals follow a Poisson distribution and service times are exponentially distributed. The following spreadsheet has been developed for the system.
Which type of queuing system are you likely to encounter at a Wendy's restaurant?
A) Single waiting line, single service station.
B) Multiple waiting lines, single service station.
C) Single waiting line, multiple service stations.
D) Multiple waiting lines, multiple service stations.
Unlock Deck
Unlock for access to all 97 flashcards in this deck.
Unlock Deck
k this deck
38
Exhibit 13.1
The following questions are based on the output below.
A store currently operates its service system with 1 operator. Arrivals follow a Poisson distribution and service times are exponentially distributed. The following spreadsheet has been developed for the system.
Which type of queuing system are you likely to encounter at an ATM?
A) Single waiting line, single service station.
B) Multiple waiting lines, single service station.
C) Single waiting line, multiple service stations.
D) Multiple waiting lines, multiple service stations.
Unlock Deck
Unlock for access to all 97 flashcards in this deck.
Unlock Deck
k this deck
39
Exhibit 12.5
The following questions use the information below.
The owner of Sal's Italian Restaurant wants to study the growth of his business using simulation. He is interested in simulating the number of customers and the amount ordered by customers each month. He currently serves 1000 customers per month and feels this can vary uniformly between a decrease of as much as 5% and an increase of up to 9%. The bill for each customer is a normally distributed random variable with a mean of $20 and a standard deviation of $5. The average order has been increasing steadily over the years and the owner expects the mean order will increase by 2% per month. You have created the following spreadsheet to simulate the problem.
The number of arrivals to a store follows a Poisson distribution with mean λ = 10/hour. What is the mean inter-arrival time?
A) 6 seconds
B) 6 minutes
C) 10 minutes
D) 10 hours
Unlock Deck
Unlock for access to all 97 flashcards in this deck.
Unlock Deck
k this deck
40
Exhibit 13.1
The following questions are based on the output below.
A store currently operates its service system with 1 operator. Arrivals follow a Poisson distribution and service times are exponentially distributed. The following spreadsheet has been developed for the system.
A jockey refers to
A) a customer who refuses to join the queue.
B) a customer who refuses service by a specific server.
C) a customer who joins the queue but leaves before service is complete.
D) a customer who switches between queues in the system.
Unlock Deck
Unlock for access to all 97 flashcards in this deck.
Unlock Deck
k this deck
41
Exhibit 13.1
The following questions are based on the output below.
A store currently operates its service system with 1 operator. Arrivals follow a Poisson distribution and service times are exponentially distributed. The following spreadsheet has been developed for the system.
A doctor's office only has 8 chairs. The doctor's service times and customer inter-arrival times are exponentially distributed. What type of system is it?
A) M/M/1
B) M/M/8
C) M/M/1 with Finite Queue
D) M/M/1 with Finite Population
Unlock Deck
Unlock for access to all 97 flashcards in this deck.
Unlock Deck
k this deck
42
Exhibit 13.1
The following questions are based on the output below.
A store currently operates its service system with 1 operator. Arrivals follow a Poisson distribution and service times are exponentially distributed. The following spreadsheet has been developed for the system.
The M/M/s model with finite capacity queue can be used to model
A) a machine breakdown process in a shop with 10 identical machines
B) traffic in a dentist's office
C) a process of patient departure from a dentist's office
D) a process of installing new machines in a shop
Unlock Deck
Unlock for access to all 97 flashcards in this deck.
Unlock Deck
k this deck
43
Exhibit 13.1
The following questions are based on the output below.
A store currently operates its service system with 1 operator. Arrivals follow a Poisson distribution and service times are exponentially distributed. The following spreadsheet has been developed for the system.
Which type of queuing system are you likely to encounter at a grocery store?
A) Single waiting line, single service station.
B) Multiple waiting lines, single service station.
C) Single waiting line, multiple service stations.
D) Multiple waiting lines, multiple service stations.
Unlock Deck
Unlock for access to all 97 flashcards in this deck.
Unlock Deck
k this deck
44
Exhibit 13.1
The following questions are based on the output below.
A store currently operates its service system with 1 operator. Arrivals follow a Poisson distribution and service times are exponentially distributed. The following spreadsheet has been developed for the system.
In the Kendall notation M/G/4, M stands for
A) memoryless arrival distribution
B) memoryless departure distribution
C) memoryless arrival and departure distributions
D) none of the above
Unlock Deck
Unlock for access to all 97 flashcards in this deck.
Unlock Deck
k this deck
45
Exhibit 13.1
The following questions are based on the output below.
A store currently operates its service system with 1 operator. Arrivals follow a Poisson distribution and service times are exponentially distributed. The following spreadsheet has been developed for the system.
A renege refers to
A) a customer who refuses to join the queue.
B) a customer who refuses service by a specific server.
C) a customer who joins the queue but leaves before service is complete.
D) a customer who requires extra service time.
Unlock Deck
Unlock for access to all 97 flashcards in this deck.
Unlock Deck
k this deck
46
Exhibit 13.1
The following questions are based on the output below.
A store currently operates its service system with 1 operator. Arrivals follow a Poisson distribution and service times are exponentially distributed. The following spreadsheet has been developed for the system.
Refer to Exhibit 13.1. What is the probability that a customer can go directly into service without waiting in line?
A) 0.00
B) 0.25
C) 0.75
D) 1.00
Unlock Deck
Unlock for access to all 97 flashcards in this deck.
Unlock Deck
k this deck
47
Exhibit 13.1
The following questions are based on the output below.
A store currently operates its service system with 1 operator. Arrivals follow a Poisson distribution and service times are exponentially distributed. The following spreadsheet has been developed for the system.
If a service system has a constant service time, Poisson arrival rates and 2 servers its Kendall notation is
A) P/D/2
B) M/D/2
C) M/D/1
D) G/D/2
Unlock Deck
Unlock for access to all 97 flashcards in this deck.
Unlock Deck
k this deck
48
Exhibit 13.1
The following questions are based on the output below.
A store currently operates its service system with 1 operator. Arrivals follow a Poisson distribution and service times are exponentially distributed. The following spreadsheet has been developed for the system.
Joe's Copy Center has 10 copiers. They break down at a rate of 0.02 copiers per hour and are sent to the service facility. What is the average arrival rate of broken copiers to the service facility?
A) 0.02
B) 0.2
C) 10
D) It cannot be determined from the information provided.
Unlock Deck
Unlock for access to all 97 flashcards in this deck.
Unlock Deck
k this deck
49
Exhibit 13.1
The following questions are based on the output below.
A store currently operates its service system with 1 operator. Arrivals follow a Poisson distribution and service times are exponentially distributed. The following spreadsheet has been developed for the system.
A common queue discipline used in practice is
A) first-in-first-out
B) random
C) last-in-first-out
D) group arrival
Unlock Deck
Unlock for access to all 97 flashcards in this deck.
Unlock Deck
k this deck
50
Exhibit 13.1
The following questions are based on the output below.
A store currently operates its service system with 1 operator. Arrivals follow a Poisson distribution and service times are exponentially distributed. The following spreadsheet has been developed for the system.
Which of the following is the typical operating characteristic for the probability an arriving unit has to wait for service?
A) Wp
B) P0
C) Pw
D) Pn
Unlock Deck
Unlock for access to all 97 flashcards in this deck.
Unlock Deck
k this deck
51
Exhibit 13.1
The following questions are based on the output below.
A store currently operates its service system with 1 operator. Arrivals follow a Poisson distribution and service times are exponentially distributed. The following spreadsheet has been developed for the system.
Refer to Exhibit 13.1. How many customers will be in the store on average at any one time?
A) 0.375
B) 0.50
C) 2.25
D) 3.00
Unlock Deck
Unlock for access to all 97 flashcards in this deck.
Unlock Deck
k this deck
52
Exhibit 13.1
The following questions are based on the output below.
A store currently operates its service system with 1 operator. Arrivals follow a Poisson distribution and service times are exponentially distributed. The following spreadsheet has been developed for the system.
If the number of arrivals in a time period follow a Poisson distribution with mean λ then the inter-arrival times follow a(n) ____ distribution with mean ____.
A) normal; μ
B) constant; λ
C) exponential; λ
D) exponential; 1/λ
Unlock Deck
Unlock for access to all 97 flashcards in this deck.
Unlock Deck
k this deck
53
Exhibit 13.1
The following questions are based on the output below.
A store currently operates its service system with 1 operator. Arrivals follow a Poisson distribution and service times are exponentially distributed. The following spreadsheet has been developed for the system.
A company has recorded the following list of service rates (customers/hour) for one of its servers. What is the mean service time for this server?
Customers / hour: 4, 4, 5, 6, 5, 4, 3, 4, 3, 5, 5, 6
A) 0.22 min
B) 1.11 min
C) 4.5 min
D) 13.3 min
Unlock Deck
Unlock for access to all 97 flashcards in this deck.
Unlock Deck
k this deck
54
Exhibit 13.1
The following questions are based on the output below.
A store currently operates its service system with 1 operator. Arrivals follow a Poisson distribution and service times are exponentially distributed. The following spreadsheet has been developed for the system.
The M/M/s model with finite population can be used to model
A) a machine breakdown process in a shop with 10 identical machines
B) a process of patient arrival to a dentist's office
C) a process of patient departure from a dentist's office
D) a process of installing new machines in a shop
Unlock Deck
Unlock for access to all 97 flashcards in this deck.
Unlock Deck
k this deck
55
Exhibit 13.1
The following questions are based on the output below.
A store currently operates its service system with 1 operator. Arrivals follow a Poisson distribution and service times are exponentially distributed. The following spreadsheet has been developed for the system.
The M/D/1 model results can be derived from which of the following systems?
A) M/M/1 with λ = 0
B) M/G/1 with μ = 0
C) M/G/1 with σ = 0
D) M/M/2 with finite queue length.
Unlock Deck
Unlock for access to all 97 flashcards in this deck.
Unlock Deck
k this deck
56
Exhibit 13.1
The following questions are based on the output below.
A store currently operates its service system with 1 operator. Arrivals follow a Poisson distribution and service times are exponentially distributed. The following spreadsheet has been developed for the system.
What is the probability that it will take less than or equal to 0.25 hours to service any call based on the following exponential probability distribution with rate μ = 5?
A) 0.00
B) 0.71
C) 0.92
D) 1.00
Unlock Deck
Unlock for access to all 97 flashcards in this deck.
Unlock Deck
k this deck
57
Exhibit 13.1
The following questions are based on the output below.
A store currently operates its service system with 1 operator. Arrivals follow a Poisson distribution and service times are exponentially distributed. The following spreadsheet has been developed for the system.
Refer to Exhibit 13.1. What is the average amount of time spent waiting in line?
A) 0.375
B) 0.50
C) 2.25
D) 3.00
Unlock Deck
Unlock for access to all 97 flashcards in this deck.
Unlock Deck
k this deck
58
Exhibit 13.1
The following questions are based on the output below.
A store currently operates its service system with 1 operator. Arrivals follow a Poisson distribution and service times are exponentially distributed. The following spreadsheet has been developed for the system.
To find steady-state values for the M/M/S queuing system, which of the following statements must be true about the arrival rate?
A) λ < s μ
B) λ − s = μ
C) λ > s μ
D) λ = s μ
Unlock Deck
Unlock for access to all 97 flashcards in this deck.
Unlock Deck
k this deck
59
Exhibit 13.1
The following questions are based on the output below.
A store currently operates its service system with 1 operator. Arrivals follow a Poisson distribution and service times are exponentially distributed. The following spreadsheet has been developed for the system.
Which of the following is the typical operating characteristic for average number of units in a queue?
A) W
B) Wq
C) L
D) Lq
Unlock Deck
Unlock for access to all 97 flashcards in this deck.
Unlock Deck
k this deck
60
Exhibit 13.1
The following questions are based on the output below.
A store currently operates its service system with 1 operator. Arrivals follow a Poisson distribution and service times are exponentially distributed. The following spreadsheet has been developed for the system.
Which of the following is the typical operating characteristic for average time a unit spends waiting for service?
A) W
B) Wq
C) L
D) Lq
Unlock Deck
Unlock for access to all 97 flashcards in this deck.
Unlock Deck
k this deck
61
Exhibit 13.6
The following questions refer to the information and output below.
The university computer lab has 10 computers which are constantly being used by students. Users need help from the one lab assistant fairly often. Students ask for help at a Poisson rate of with an average of 4 requests per hour for any one computer. The assistant answers questions as quickly as possible and the service time follows an exponential distribution with mean of 1 minute per help session. The following queuing analysis spreadsheet was developed from this information.
Refer to Exhibit 13.6. What is the Kendall notation for this system?
Unlock Deck
Unlock for access to all 97 flashcards in this deck.
Unlock Deck
k this deck
62
Exhibit 13.6
The following questions refer to the information and output below.
The university computer lab has 10 computers which are constantly being used by students. Users need help from the one lab assistant fairly often. Students ask for help at a Poisson rate of with an average of 4 requests per hour for any one computer. The assistant answers questions as quickly as possible and the service time follows an exponential distribution with mean of 1 minute per help session. The following queuing analysis spreadsheet was developed from this information.
Refer to Exhibit 13.6. Based on this report what is the average number of students waiting to be helped?
Unlock Deck
Unlock for access to all 97 flashcards in this deck.
Unlock Deck
k this deck
63
Exhibit 13.6
The following questions refer to the information and output below.
The university computer lab has 10 computers which are constantly being used by students. Users need help from the one lab assistant fairly often. Students ask for help at a Poisson rate of with an average of 4 requests per hour for any one computer. The assistant answers questions as quickly as possible and the service time follows an exponential distribution with mean of 1 minute per help session. The following queuing analysis spreadsheet was developed from this information.
The customer service desk at Joe's Discount Electronics store receives 5 customers per hour on average. On average, each customer requires 10 minutes for service. The customer service desk is staffed by a single person. What is the average time a customer spends in the customer service area if modeled as an M/M/1 queuing system?
Unlock Deck
Unlock for access to all 97 flashcards in this deck.
Unlock Deck
k this deck
64
Exhibit 13.3
The following questions refer to the information below.
A company has recorded the following customer inter-arrival times and service times for 10 customers at one of its single teller service lines. Assume the data are exponentially distributed and the 10 data points represent a reasonable sample.
Refer to Exhibit 13.3. What is the average number of customers in the system?
Unlock Deck
Unlock for access to all 97 flashcards in this deck.
Unlock Deck
k this deck
65
Exhibit 13.5
The following questions refer to the information and output below.
A computer printer in a large administrative office has a printer buffer (memory to store printing jobs) capacity of 3 jobs. If the buffer is full when a user wants to print a file the user is told that the job cannot be printed and to try again later. There are so many users in this office that we can assume that there is an infinite calling population. Jobs arrive at the printer at a Poisson rate of 55 jobs per hour and take an average of 1 minute to print. Printing times are exponentially distributed. The following queuing analysis spreadsheet was developed from this information.
Refer to Exhibit 13.5. Based on this report what is the probability that a computer user will be told to resubmit a print job at a later time?
Unlock Deck
Unlock for access to all 97 flashcards in this deck.
Unlock Deck
k this deck
66
Exhibit 13.4
The following questions refer to the information and output below.
A grocery store can serve an average of 360 customers per hour. The service times are exponentially distributed. The store has 4 checkout lines each of which serves 90 customers per hour. Customers arrive at the store at a Poisson rate of 240 customers per hour. The following queuing analysis spreadsheet was developed from this information.
Refer to Exhibit 13.4. What is the Kendall notation for this system?
Unlock Deck
Unlock for access to all 97 flashcards in this deck.
Unlock Deck
k this deck
67
A company has recorded the following list of service rates (customers/hour) for one of its servers. What is the mean service time for this server?
Unlock Deck
Unlock for access to all 97 flashcards in this deck.
Unlock Deck
k this deck
68
Exhibit 13.7
The following questions refer to the information and output below.
A tax accountant has found that the time to serve a customer has a mean of 30 minutes (or 0.5 hours) and a standard deviation of 6 minutes (or 0.1 hours). Customer arrivals follow a Poisson distribution with an average of 60 minutes between arrivals. The following queuing analysis spreadsheet was developed from this information.
Refer to Exhibit 13.7. Based on this report how long does a customer spend at the tax accountant's office?
Unlock Deck
Unlock for access to all 97 flashcards in this deck.
Unlock Deck
k this deck
69
Exhibit 13.4
The following questions refer to the information and output below.
A grocery store can serve an average of 360 customers per hour. The service times are exponentially distributed. The store has 4 checkout lines each of which serves 90 customers per hour. Customers arrive at the store at a Poisson rate of 240 customers per hour. The following queuing analysis spreadsheet was developed from this information.
Refer to Exhibit 13.4. Based on this report what percent of the time is a grocery clerk busy serving a customer?
Unlock Deck
Unlock for access to all 97 flashcards in this deck.
Unlock Deck
k this deck
70
Exhibit 13.1
The following questions are based on the output below.
A store currently operates its service system with 1 operator. Arrivals follow a Poisson distribution and service times are exponentially distributed. The following spreadsheet has been developed for the system.
The M/D/1 model with infinite capacity queue can be used to model
A) a machine breakdown process in a shop with 10 identical machines
B) a process of washing a car in an automatic car wash
C) a process of patient departure from a dentist's office
D) a process of installing new machines in a shop
Unlock Deck
Unlock for access to all 97 flashcards in this deck.
Unlock Deck
k this deck
71
Exhibit 13.2
The following questions refer to the information and output below.
A barber shop has one barber who can give 12 haircuts per hour. Customers arrive at a rate of 8 customers per hour. Customer inter-arrival times and service times are exponentially distributed. The following queuing analysis spreadsheet was developed from this information.
Refer to Exhibit 13.2. Based on this report what is the average number of customers waiting for a haircut?
Unlock Deck
Unlock for access to all 97 flashcards in this deck.
Unlock Deck
k this deck
72
The customer service desk at Joe's Discount Electronics store receives 5 customers per hour on average. On average, each customer requires 10 minutes for service. The customer service desk is staffed by a single person. What is the average number of customers in the customer service area, if modeled as an M/M/1 queuing system?
Unlock Deck
Unlock for access to all 97 flashcards in this deck.
Unlock Deck
k this deck
73
A grocery clerk can serve 20 customers per hour on average and the service time follows an exponential distribution. What is the probability that a customer's service time is less than 2 minutes?
Unlock Deck
Unlock for access to all 97 flashcards in this deck.
Unlock Deck
k this deck
74
Exhibit 13.6
The following questions refer to the information and output below.
The university computer lab has 10 computers which are constantly being used by students. Users need help from the one lab assistant fairly often. Students ask for help at a Poisson rate of with an average of 4 requests per hour for any one computer. The assistant answers questions as quickly as possible and the service time follows an exponential distribution with mean of 1 minute per help session. The following queuing analysis spreadsheet was developed from this information.
Customers arrive at a store randomly, following a Poisson distribution at an average rate of 20 per hour. What is the probability of exactly 0, 1 2, and 3 arrivals in a 15 minute period?
Unlock Deck
Unlock for access to all 97 flashcards in this deck.
Unlock Deck
k this deck
75
Exhibit 13.7
The following questions refer to the information and output below.
A tax accountant has found that the time to serve a customer has a mean of 30 minutes (or 0.5 hours) and a standard deviation of 6 minutes (or 0.1 hours). Customer arrivals follow a Poisson distribution with an average of 60 minutes between arrivals. The following queuing analysis spreadsheet was developed from this information.
Refer to Exhibit 13.7. What is the Kendall notation for this system?
Unlock Deck
Unlock for access to all 97 flashcards in this deck.
Unlock Deck
k this deck
76
Exhibit 13.6
The following questions refer to the information and output below.
The university computer lab has 10 computers which are constantly being used by students. Users need help from the one lab assistant fairly often. Students ask for help at a Poisson rate of with an average of 4 requests per hour for any one computer. The assistant answers questions as quickly as possible and the service time follows an exponential distribution with mean of 1 minute per help session. The following queuing analysis spreadsheet was developed from this information.
Refer to Exhibit 13.6. Based on this report how much time do students spend getting help before they can resume work on their computers?
Unlock Deck
Unlock for access to all 97 flashcards in this deck.
Unlock Deck
k this deck
77
Exhibit 13.2
The following questions refer to the information and output below.
A barber shop has one barber who can give 12 haircuts per hour. Customers arrive at a rate of 8 customers per hour. Customer inter-arrival times and service times are exponentially distributed. The following queuing analysis spreadsheet was developed from this information.
Customers arrive at a store randomly, following a Poisson distribution at an average rate of 90 per hour. How many customers arrive per minute, on average?
Unlock Deck
Unlock for access to all 97 flashcards in this deck.
Unlock Deck
k this deck
78
Exhibit 13.5
The following questions refer to the information and output below.
A computer printer in a large administrative office has a printer buffer (memory to store printing jobs) capacity of 3 jobs. If the buffer is full when a user wants to print a file the user is told that the job cannot be printed and to try again later. There are so many users in this office that we can assume that there is an infinite calling population. Jobs arrive at the printer at a Poisson rate of 55 jobs per hour and take an average of 1 minute to print. Printing times are exponentially distributed. The following queuing analysis spreadsheet was developed from this information.
Refer to Exhibit 13.5. What is the Kendall notation for this system?
Unlock Deck
Unlock for access to all 97 flashcards in this deck.
Unlock Deck
k this deck
79
Exhibit 13.4
The following questions refer to the information and output below.
A grocery store can serve an average of 360 customers per hour. The service times are exponentially distributed. The store has 4 checkout lines each of which serves 90 customers per hour. Customers arrive at the store at a Poisson rate of 240 customers per hour. The following queuing analysis spreadsheet was developed from this information.
Refer to Exhibit 13.4. Based on this report what is the average number of customers waiting for a checker?
Unlock Deck
Unlock for access to all 97 flashcards in this deck.
Unlock Deck
k this deck
80
Exhibit 13.3
The following questions refer to the information below.
A company has recorded the following customer inter-arrival times and service times for 10 customers at one of its single teller service lines. Assume the data are exponentially distributed and the 10 data points represent a reasonable sample.
Refer to Exhibit 13.3. What is the mean service rate per hour?
Unlock Deck
Unlock for access to all 97 flashcards in this deck.
Unlock Deck
k this deck
Unlock Deck
Unlock for access to all 97 flashcards in this deck.


