Deck 3: Where Prices Come From: the Interaction of Demand and Supply
Full screen (f)
Question
Question
Question
Question
Question
Question
Question
Question
Question
Question
Question
Question
Question
Question
Question
Question
Question
Question
Question
Question
Question
Figure 3-1 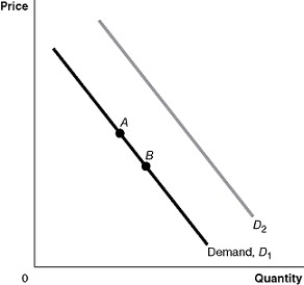
Refer to Figure 3-1.A decrease population would be represented by a movement from
A)A to B.
B)B to A.
C)D1 to D2.
D)D2 to D1.
Refer to Figure 3-1.A decrease population would be represented by a movement from
A)A to B.
B)B to A.
C)D1 to D2.
D)D2 to D1.
Question
Figure 3-1
Refer to Figure 3-1.If the product represented is an inferior good,an increase in income would be represented by a movement from
A)A to B.
B)B to A.
C)D1 to D2.
D)D2 to D1.
Refer to Figure 3-1.If the product represented is an inferior good,an increase in income would be represented by a movement from
A)A to B.
B)B to A.
C)D1 to D2.
D)D2 to D1.
Question
Figure 3-1
Refer to Figure 3-1.An increase in the expected future price of the product would be represented by a movement from
A)A to B.
B)B to A.
C)D1 to D2.
D)D2 to D1.
Refer to Figure 3-1.An increase in the expected future price of the product would be represented by a movement from
A)A to B.
B)B to A.
C)D1 to D2.
D)D2 to D1.
Question
Figure 3-1
Refer to Figure 3-1.If the product represented is an inferior good,a decrease in income would be represented by a movement from
A)A to B.
B)B to A.
C)D1 to D2.
D)D2 to D1.
Refer to Figure 3-1.If the product represented is an inferior good,a decrease in income would be represented by a movement from
A)A to B.
B)B to A.
C)D1 to D2.
D)D2 to D1.
Question
Figure 3-1
Refer to Figure 3-1.A decrease in the price of a complementary good would be represented by a movement from
A)A to B.
B)B to A.
C)D1 to D2.
D)D2 to D1.
Refer to Figure 3-1.A decrease in the price of a complementary good would be represented by a movement from
A)A to B.
B)B to A.
C)D1 to D2.
D)D2 to D1.
Question
Figure 3-1
Refer to Figure 3-1.An increase in the price of a complement would be represented by a movement from
A)A to B.
B)B to A.
C)D1 to D2.
D)D2 to D1.
Refer to Figure 3-1.An increase in the price of a complement would be represented by a movement from
A)A to B.
B)B to A.
C)D1 to D2.
D)D2 to D1.
Question
Figure 3-1
Refer to Figure 3-1.A decrease in taste or preference would be represented by a movement from
A)A to B.
B)B to A.
C)D1 to D2.
D)D2 to D1.
Refer to Figure 3-1.A decrease in taste or preference would be represented by a movement from
A)A to B.
B)B to A.
C)D1 to D2.
D)D2 to D1.
Question
Figure 3-1
Refer to Figure 3-1.A decrease in the price of a substitute good would be represented by a movement from
A)A to B.
B)B to A.
C)D1 to D2.
D)D2 to D1.
Refer to Figure 3-1.A decrease in the price of a substitute good would be represented by a movement from
A)A to B.
B)B to A.
C)D1 to D2.
D)D2 to D1.
Question
Question
Figure 3-1
Refer to Figure 3-1.An increase in population would be represented by a movement from
A)A to B.
B)B to A.
C)D1 to D2.
D)D2 to D1.
Refer to Figure 3-1.An increase in population would be represented by a movement from
A)A to B.
B)B to A.
C)D1 to D2.
D)D2 to D1.
Question
Question
Question
Figure 3-1
Refer to Figure 3-1.If the product represented is a normal good,an increase in income would be represented by a movement from
A)A to B.
B)B to A.
C)D1 to D2.
D)D2 to D1.
Refer to Figure 3-1.If the product represented is a normal good,an increase in income would be represented by a movement from
A)A to B.
B)B to A.
C)D1 to D2.
D)D2 to D1.
Question
Figure 3-1
Refer to Figure 3-1.An increase in taste or preference would be represented by a movement from
A)A to B.
B)B to A.
C)D1 to D2.
D)D2 to D1.
Refer to Figure 3-1.An increase in taste or preference would be represented by a movement from
A)A to B.
B)B to A.
C)D1 to D2.
D)D2 to D1.
Question
Figure 3-1
Refer to Figure 3-1.If the product represented is a normal good,a decrease in income would be represented by a movement from
A)A to B.
B)B to A.
C)D1 to D2.
D)D2 to D1.
Refer to Figure 3-1.If the product represented is a normal good,a decrease in income would be represented by a movement from
A)A to B.
B)B to A.
C)D1 to D2.
D)D2 to D1.
Question
Question
Figure 3-1
Refer to Figure 3-1.An increase in the price of the product would be represented by a movement from
A)A to B.
B)B to A.
C)D1 to D2.
D)D2 to D1.
Refer to Figure 3-1.An increase in the price of the product would be represented by a movement from
A)A to B.
B)B to A.
C)D1 to D2.
D)D2 to D1.
Question
Figure 3-1
Refer to Figure 3-1.An increase in the price of a substitute would be represented by a movement from
A)A to B.
B)B to A.
C)D1 to D2.
D)D2 to D1.
Refer to Figure 3-1.An increase in the price of a substitute would be represented by a movement from
A)A to B.
B)B to A.
C)D1 to D2.
D)D2 to D1.
Question
Figure 3-1
Refer to Figure 3-1.A decrease in the price of the product would be represented by a movement from
A)A to B.
B)B to A.
C)D1 to D2.
D)D2 to D1.
Refer to Figure 3-1.A decrease in the price of the product would be represented by a movement from
A)A to B.
B)B to A.
C)D1 to D2.
D)D2 to D1.
Question
Figure 3-1
Refer to Figure 3-1.A decrease in the expected future price of the product would be represented by a movement from
A)A to B.
B)B to A.
C)D1 to D2.
D)D2 to D1.
Refer to Figure 3-1.A decrease in the expected future price of the product would be represented by a movement from
A)A to B.
B)B to A.
C)D1 to D2.
D)D2 to D1.
Question
Question
Question
Question
Question
Question
Question
Question
Question
Question
Question
Question
Question
Question
Question
Question
Question
Question
Question
Question
Question
Question
Question
Question
Question
Question
Question
Question
Question
Question
Question
Question
Question
Question
Question
Question
Question
Question
Question
Question

Unlock Deck
Sign up to unlock the cards in this deck!
Unlock Deck
Unlock Deck
1/476
Play
Full screen (f)
Deck 3: Where Prices Come From: the Interaction of Demand and Supply
1
Table 3-1
-Refer to Table 3-1.The table above shows the demand schedules for loose-leaf tea of two individuals (Sunil and Mia)and the rest of the market.If the price of loose-leaf tea rises from $3 to $4,the market quantity demanded would
A)decrease by 32 lbs.
B)increase by 64 lbs.
C)increase by 32 lbs.
D)decrease by 64 lbs.
decrease by 32 lbs.
2
Holding everything else constant,an increase in the price of MP3 players will result in
A)a decrease in the quantity of MP3 players supplied.
B)a decrease in the demand for MP3 players.
C)an increase in the supply of MP3 players.
D)a decrease in the quantity of MP3 players demanded.
A)a decrease in the quantity of MP3 players supplied.
B)a decrease in the demand for MP3 players.
C)an increase in the supply of MP3 players.
D)a decrease in the quantity of MP3 players demanded.
D
3
A change in all of the following variables will change the market demand for a product except
A)the price of the product.
B)population and demographics.
C)income.
D)tastes.
A)the price of the product.
B)population and demographics.
C)income.
D)tastes.
A
4
Table 3-1
-Refer to Table 3-1.The table above shows the demand schedules for loose-leaf tea of two individuals (Sunil and Mia)and the rest of the market.At a price of $5,the quantity demanded in the market would be
A)51 lbs.
B)63 lbs.
C)76 lbs
D)146 lbs.
-Refer to Table 3-1.The table above shows the demand schedules for loose-leaf tea of two individuals (Sunil and Mia)and the rest of the market.At a price of $5,the quantity demanded in the market would be
A)51 lbs.
B)63 lbs.
C)76 lbs
D)146 lbs.
Unlock Deck
Unlock for access to all 476 flashcards in this deck.
Unlock Deck
k this deck
5
If the price of orchids falls,the substitution effect due to the price change will cause
A)an increase in the demand for orchids.
B)an increase in the demand for roses,a substitute for orchids.
C)an increase in the quantity of orchids demanded.
D)an increase in the quantity of orchids supplied.
A)an increase in the demand for orchids.
B)an increase in the demand for roses,a substitute for orchids.
C)an increase in the quantity of orchids demanded.
D)an increase in the quantity of orchids supplied.
Unlock Deck
Unlock for access to all 476 flashcards in this deck.
Unlock Deck
k this deck
6
A movement along the demand curve for toothpaste would be caused by
A)a change in the price of toothbrushes.
B)a change in consumer income.
C)a change in the price of toothpaste.
D)a change in population.
A)a change in the price of toothbrushes.
B)a change in consumer income.
C)a change in the price of toothpaste.
D)a change in population.
Unlock Deck
Unlock for access to all 476 flashcards in this deck.
Unlock Deck
k this deck
7
By drawing a demand curve with ________ on the vertical axis and ________ on the horizontal axis,economists assume that the most important determinant of the demand for a good is the ________ of the good.
A)quantity;price;quantity
B)price;quantity;quantity
C)price;quantity;price
D)quantity;price;price
A)quantity;price;quantity
B)price;quantity;quantity
C)price;quantity;price
D)quantity;price;price
Unlock Deck
Unlock for access to all 476 flashcards in this deck.
Unlock Deck
k this deck
8
What is the difference between an "increase in demand" and an "increase in quantity demanded"?
A)There is no difference between the two terms;they both refer to a shift of the demand curve.
B)An "increase in demand" is represented by a rightward shift of the demand curve while an "increase in quantity demanded" is represented by a movement along a given demand curve.
C)There is no difference between the two terms;they both refer to a movement downward along a given demand curve.
D)An "increase in demand" is represented by a movement along a given demand curve,while an "increase in quantity demanded" is represented by a rightward shift of the demand curve.
Unlock Deck
Unlock for access to all 476 flashcards in this deck.
Unlock Deck
k this deck
9
Which of the following will shift the demand curve for a good?
A)a change in the technology used to produce the good
B)an increase in the price of the good
C)a decrease in the price of a complementary good
D)a decrease in the price of the good
A)a change in the technology used to produce the good
B)an increase in the price of the good
C)a decrease in the price of a complementary good
D)a decrease in the price of the good
Unlock Deck
Unlock for access to all 476 flashcards in this deck.
Unlock Deck
k this deck
10
The income effect of a price change refers to the impact of a change in
A)income on the price of a good.
B)demand when income changes.
C)the quantity demanded when income changes.
D)the price of a good on a consumer's purchasing power.
A)income on the price of a good.
B)demand when income changes.
C)the quantity demanded when income changes.
D)the price of a good on a consumer's purchasing power.
Unlock Deck
Unlock for access to all 476 flashcards in this deck.
Unlock Deck
k this deck
11
The market for smartwatches has begun to grow,due in part to the success of the Apple Watch.Following the successful launch of the Apple Watch in 2015,companies such as Samsung,Sony,and LG have all developed products to compete with the Apple Watch.The smartwatches introduced to compete with the Apple Watch would be considered
A)complements to the Apple Watch.
B)substitutes for the Apple Watch.
C)inferior goods compared to the Apple Watch.
D)normal goods compared to the Apple Watch.
A)complements to the Apple Watch.
B)substitutes for the Apple Watch.
C)inferior goods compared to the Apple Watch.
D)normal goods compared to the Apple Watch.
Unlock Deck
Unlock for access to all 476 flashcards in this deck.
Unlock Deck
k this deck
12
The law of demand implies,holding everything else constant,that as the price of bagels increases
A)the quantity of bagels demanded will decrease.
B)the demand for bagels will decrease.
C)the quantity of bagels demanded will increase.
D)the demand for bagels will increase.
A)the quantity of bagels demanded will decrease.
B)the demand for bagels will decrease.
C)the quantity of bagels demanded will increase.
D)the demand for bagels will increase.
Unlock Deck
Unlock for access to all 476 flashcards in this deck.
Unlock Deck
k this deck
13
If the Apple Watch and the Samsung Gear S2 are considered substitutes,then,other things equal,an increase in the price of the Apple Watch will
A)decrease the demand for the Apple Watch.
B)increase the demand for the Gear S2.
C)increase the quantity demanded for the Gear S2.
D)increase the quantity demanded for the Apple Watch.
A)decrease the demand for the Apple Watch.
B)increase the demand for the Gear S2.
C)increase the quantity demanded for the Gear S2.
D)increase the quantity demanded for the Apple Watch.
Unlock Deck
Unlock for access to all 476 flashcards in this deck.
Unlock Deck
k this deck
14
If a demand curve shifts to the left,then
A)demand has increased.
B)quantity demanded has increased.
C)demand has decreased.
D)quantity demanded has decreased.
A)demand has increased.
B)quantity demanded has increased.
C)demand has decreased.
D)quantity demanded has decreased.
Unlock Deck
Unlock for access to all 476 flashcards in this deck.
Unlock Deck
k this deck
15
When the price of a good falls,consumers buy a larger quantity because of the ________ effect and the ________ effect.
A)substitution;income
B)normal;inferior
C)substitute;complement
D)supply;demand
A)substitution;income
B)normal;inferior
C)substitute;complement
D)supply;demand
Unlock Deck
Unlock for access to all 476 flashcards in this deck.
Unlock Deck
k this deck
16
The demand by all the consumers of a given good or service is the ________ for the good or service.
A)market demand
B)quantity demanded
C)law of demand
D)scheduled demand
A)market demand
B)quantity demanded
C)law of demand
D)scheduled demand
Unlock Deck
Unlock for access to all 476 flashcards in this deck.
Unlock Deck
k this deck
17
The ________ effect refers to the change in quantity demanded for a good that results from the effect of a change in the good's price on consumer's purchasing power.
A)ceteris paribus
B)population
C)substitution
D)income
A)ceteris paribus
B)population
C)substitution
D)income
Unlock Deck
Unlock for access to all 476 flashcards in this deck.
Unlock Deck
k this deck
18
If a demand curve shifts to the right,then
A)demand has increased.
B)quantity demanded has increased.
C)demand has decreased.
D)quantity demanded has decreased.
A)demand has increased.
B)quantity demanded has increased.
C)demand has decreased.
D)quantity demanded has decreased.
Unlock Deck
Unlock for access to all 476 flashcards in this deck.
Unlock Deck
k this deck
19
If,in response to an increase in the price of chocolate the quantity of chocolate demanded decreases,economists would describe this as
A)a decrease in demand.
B)a decrease in quantity demanded.
C)a change in consumer income.
D)a decrease in consumers' taste for chocolate.
A)a decrease in demand.
B)a decrease in quantity demanded.
C)a change in consumer income.
D)a decrease in consumers' taste for chocolate.
Unlock Deck
Unlock for access to all 476 flashcards in this deck.
Unlock Deck
k this deck
20
If the price of grapefruit rises,the substitution effect due to the price change will cause
A)a decrease in the demand for grapefruit.
B)a decrease in the demand for oranges,a substitute for grapefruit.
C)a decrease in the quantity of grapefruit demanded.
D)a decrease in the quantity of grapefruit supplied.
A)a decrease in the demand for grapefruit.
B)a decrease in the demand for oranges,a substitute for grapefruit.
C)a decrease in the quantity of grapefruit demanded.
D)a decrease in the quantity of grapefruit supplied.
Unlock Deck
Unlock for access to all 476 flashcards in this deck.
Unlock Deck
k this deck
21
Figure 3-1
Refer to Figure 3-1.A decrease population would be represented by a movement from
A)A to B.
B)B to A.
C)D1 to D2.
D)D2 to D1.
Refer to Figure 3-1.A decrease population would be represented by a movement from
A)A to B.
B)B to A.
C)D1 to D2.
D)D2 to D1.
Unlock Deck
Unlock for access to all 476 flashcards in this deck.
Unlock Deck
k this deck
22
Figure 3-1
Refer to Figure 3-1.If the product represented is an inferior good,an increase in income would be represented by a movement from
A)A to B.
B)B to A.
C)D1 to D2.
D)D2 to D1.
Refer to Figure 3-1.If the product represented is an inferior good,an increase in income would be represented by a movement from
A)A to B.
B)B to A.
C)D1 to D2.
D)D2 to D1.
Unlock Deck
Unlock for access to all 476 flashcards in this deck.
Unlock Deck
k this deck
23
Figure 3-1
Refer to Figure 3-1.An increase in the expected future price of the product would be represented by a movement from
A)A to B.
B)B to A.
C)D1 to D2.
D)D2 to D1.
Refer to Figure 3-1.An increase in the expected future price of the product would be represented by a movement from
A)A to B.
B)B to A.
C)D1 to D2.
D)D2 to D1.
Unlock Deck
Unlock for access to all 476 flashcards in this deck.
Unlock Deck
k this deck
24
Figure 3-1
Refer to Figure 3-1.If the product represented is an inferior good,a decrease in income would be represented by a movement from
A)A to B.
B)B to A.
C)D1 to D2.
D)D2 to D1.
Refer to Figure 3-1.If the product represented is an inferior good,a decrease in income would be represented by a movement from
A)A to B.
B)B to A.
C)D1 to D2.
D)D2 to D1.
Unlock Deck
Unlock for access to all 476 flashcards in this deck.
Unlock Deck
k this deck
25
Figure 3-1
Refer to Figure 3-1.A decrease in the price of a complementary good would be represented by a movement from
A)A to B.
B)B to A.
C)D1 to D2.
D)D2 to D1.
Refer to Figure 3-1.A decrease in the price of a complementary good would be represented by a movement from
A)A to B.
B)B to A.
C)D1 to D2.
D)D2 to D1.
Unlock Deck
Unlock for access to all 476 flashcards in this deck.
Unlock Deck
k this deck
26
Figure 3-1
Refer to Figure 3-1.An increase in the price of a complement would be represented by a movement from
A)A to B.
B)B to A.
C)D1 to D2.
D)D2 to D1.
Refer to Figure 3-1.An increase in the price of a complement would be represented by a movement from
A)A to B.
B)B to A.
C)D1 to D2.
D)D2 to D1.
Unlock Deck
Unlock for access to all 476 flashcards in this deck.
Unlock Deck
k this deck
27
Figure 3-1
Refer to Figure 3-1.A decrease in taste or preference would be represented by a movement from
A)A to B.
B)B to A.
C)D1 to D2.
D)D2 to D1.
Refer to Figure 3-1.A decrease in taste or preference would be represented by a movement from
A)A to B.
B)B to A.
C)D1 to D2.
D)D2 to D1.
Unlock Deck
Unlock for access to all 476 flashcards in this deck.
Unlock Deck
k this deck
28
Figure 3-1
Refer to Figure 3-1.A decrease in the price of a substitute good would be represented by a movement from
A)A to B.
B)B to A.
C)D1 to D2.
D)D2 to D1.
Refer to Figure 3-1.A decrease in the price of a substitute good would be represented by a movement from
A)A to B.
B)B to A.
C)D1 to D2.
D)D2 to D1.
Unlock Deck
Unlock for access to all 476 flashcards in this deck.
Unlock Deck
k this deck
29
Elvira decreased her consumption of bananas when the price of peanut butter increased.For Elvira,peanut butter and bananas are
A)substitutes in consumption.
B)both inferior goods.
C)complements in consumption.
D)both luxury goods.
A)substitutes in consumption.
B)both inferior goods.
C)complements in consumption.
D)both luxury goods.
Unlock Deck
Unlock for access to all 476 flashcards in this deck.
Unlock Deck
k this deck
30
Figure 3-1
Refer to Figure 3-1.An increase in population would be represented by a movement from
A)A to B.
B)B to A.
C)D1 to D2.
D)D2 to D1.
Refer to Figure 3-1.An increase in population would be represented by a movement from
A)A to B.
B)B to A.
C)D1 to D2.
D)D2 to D1.
Unlock Deck
Unlock for access to all 476 flashcards in this deck.
Unlock Deck
k this deck
31
The Internet has created a new category in the book selling market,namely,the "barely used" book.How does the availability of barely used books affect the market for new books?
A)The demand curve for new books shifts to the right.
B)The demand curve for new books shifts to the left.
C)The supply curve for new books shifts to the right.
D)The supply curve for new books shifts to the left.
A)The demand curve for new books shifts to the right.
B)The demand curve for new books shifts to the left.
C)The supply curve for new books shifts to the right.
D)The supply curve for new books shifts to the left.
Unlock Deck
Unlock for access to all 476 flashcards in this deck.
Unlock Deck
k this deck
32
If an increase in income leads to a decrease in the demand for popcorn,then popcorn is
A)an inferior good.
B)a neutral good.
C)a necessity.
D)a normal good.
A)an inferior good.
B)a neutral good.
C)a necessity.
D)a normal good.
Unlock Deck
Unlock for access to all 476 flashcards in this deck.
Unlock Deck
k this deck
33
Figure 3-1
Refer to Figure 3-1.If the product represented is a normal good,an increase in income would be represented by a movement from
A)A to B.
B)B to A.
C)D1 to D2.
D)D2 to D1.
Refer to Figure 3-1.If the product represented is a normal good,an increase in income would be represented by a movement from
A)A to B.
B)B to A.
C)D1 to D2.
D)D2 to D1.
Unlock Deck
Unlock for access to all 476 flashcards in this deck.
Unlock Deck
k this deck
34
Figure 3-1
Refer to Figure 3-1.An increase in taste or preference would be represented by a movement from
A)A to B.
B)B to A.
C)D1 to D2.
D)D2 to D1.
Refer to Figure 3-1.An increase in taste or preference would be represented by a movement from
A)A to B.
B)B to A.
C)D1 to D2.
D)D2 to D1.
Unlock Deck
Unlock for access to all 476 flashcards in this deck.
Unlock Deck
k this deck
35
Figure 3-1
Refer to Figure 3-1.If the product represented is a normal good,a decrease in income would be represented by a movement from
A)A to B.
B)B to A.
C)D1 to D2.
D)D2 to D1.
Refer to Figure 3-1.If the product represented is a normal good,a decrease in income would be represented by a movement from
A)A to B.
B)B to A.
C)D1 to D2.
D)D2 to D1.
Unlock Deck
Unlock for access to all 476 flashcards in this deck.
Unlock Deck
k this deck
36
If an increase in income leads to in an increase in the demand for peanut butter,then peanut butter is
A)a neutral good.
B)a normal good.
C)a necessity.
D)a complement.
A)a neutral good.
B)a normal good.
C)a necessity.
D)a complement.
Unlock Deck
Unlock for access to all 476 flashcards in this deck.
Unlock Deck
k this deck
37
Figure 3-1
Refer to Figure 3-1.An increase in the price of the product would be represented by a movement from
A)A to B.
B)B to A.
C)D1 to D2.
D)D2 to D1.
Refer to Figure 3-1.An increase in the price of the product would be represented by a movement from
A)A to B.
B)B to A.
C)D1 to D2.
D)D2 to D1.
Unlock Deck
Unlock for access to all 476 flashcards in this deck.
Unlock Deck
k this deck
38
Figure 3-1
Refer to Figure 3-1.An increase in the price of a substitute would be represented by a movement from
A)A to B.
B)B to A.
C)D1 to D2.
D)D2 to D1.
Refer to Figure 3-1.An increase in the price of a substitute would be represented by a movement from
A)A to B.
B)B to A.
C)D1 to D2.
D)D2 to D1.
Unlock Deck
Unlock for access to all 476 flashcards in this deck.
Unlock Deck
k this deck
39
Figure 3-1
Refer to Figure 3-1.A decrease in the price of the product would be represented by a movement from
A)A to B.
B)B to A.
C)D1 to D2.
D)D2 to D1.
Refer to Figure 3-1.A decrease in the price of the product would be represented by a movement from
A)A to B.
B)B to A.
C)D1 to D2.
D)D2 to D1.
Unlock Deck
Unlock for access to all 476 flashcards in this deck.
Unlock Deck
k this deck
40
Figure 3-1
Refer to Figure 3-1.A decrease in the expected future price of the product would be represented by a movement from
A)A to B.
B)B to A.
C)D1 to D2.
D)D2 to D1.
Refer to Figure 3-1.A decrease in the expected future price of the product would be represented by a movement from
A)A to B.
B)B to A.
C)D1 to D2.
D)D2 to D1.
Unlock Deck
Unlock for access to all 476 flashcards in this deck.
Unlock Deck
k this deck
41
Which of the following generation categories has the largest population in the United States in 2015?
A)the millennials
B)generation X
C)the baby boomers
D)the centenarians
A)the millennials
B)generation X
C)the baby boomers
D)the centenarians
Unlock Deck
Unlock for access to all 476 flashcards in this deck.
Unlock Deck
k this deck
42
In January,buyers of gold expect that the price of gold will rise in February.What happens in the gold market in January,holding all else constant?
A)The supply curve shifts to the right.
B)The demand curve shifts to the left.
C)The demand curve shifts to the right.
D)The quantity demanded increases.
A)The supply curve shifts to the right.
B)The demand curve shifts to the left.
C)The demand curve shifts to the right.
D)The quantity demanded increases.
Unlock Deck
Unlock for access to all 476 flashcards in this deck.
Unlock Deck
k this deck
43
How does the increasing use of MP3 players affect the market for compact discs?
A)The demand curve for compact discs shifts to the right.
B)The supply curve for compact discs shifts to the left.
C)The supply curve for compact discs shifts to the right.
D)The demand curve for compact discs shifts to the left.
A)The demand curve for compact discs shifts to the right.
B)The supply curve for compact discs shifts to the left.
C)The supply curve for compact discs shifts to the right.
D)The demand curve for compact discs shifts to the left.
Unlock Deck
Unlock for access to all 476 flashcards in this deck.
Unlock Deck
k this deck
44
If smartwatches are considered substitutes for smartphones,then the decline in the price of smartwatches would,all else equal
A)increase the demand for smartphones.
B)decrease the demand for smartphones.
C)increase the quantity of smartphones demanded.
D)decrease the quantity of smartphones demanded.
A)increase the demand for smartphones.
B)decrease the demand for smartphones.
C)increase the quantity of smartphones demanded.
D)decrease the quantity of smartphones demanded.
Unlock Deck
Unlock for access to all 476 flashcards in this deck.
Unlock Deck
k this deck
45
If the price of music downloads was to decrease,then
A)the demand for MP3 players would decrease.
B)the demand for MP3 players would increase.
C)the supply of MP3 players would increase.
D)the quantity of MP3 players demanded would decrease.
A)the demand for MP3 players would decrease.
B)the demand for MP3 players would increase.
C)the supply of MP3 players would increase.
D)the quantity of MP3 players demanded would decrease.
Unlock Deck
Unlock for access to all 476 flashcards in this deck.
Unlock Deck
k this deck
46
In June,buyers of titanium expect that the price of titanium will fall in July.What happens in the titanium market in June,holding everything else constant?
A)The demand curve shifts to the right.
B)The quantity demanded increases.
C)The quantity demanded decreases.
D)The demand curve shifts to the left.
A)The demand curve shifts to the right.
B)The quantity demanded increases.
C)The quantity demanded decreases.
D)The demand curve shifts to the left.
Unlock Deck
Unlock for access to all 476 flashcards in this deck.
Unlock Deck
k this deck
47
Buyers rush to purchase stocks in California vineyards following a forecast of a 30 percent decline in this year's grape harvest.What happens in the California wine market as a result of this announcement?
A)The demand curve for California wine shifts to the left in anticipation of higher prices in the future.
B)The demand curve for California wine shifts to the right in anticipation of higher prices in the future.
C)The supply curve for California wine shifts to the right in anticipation of higher prices in the future.
D)The supply curve for California wine shifts to the left in anticipation of lower quantities in the future.
Unlock Deck
Unlock for access to all 476 flashcards in this deck.
Unlock Deck
k this deck
48
Tomas increased his consumption of potato chips when the price of pistachios increased.For Tomas,potato chips and pistachios are
A)substitutes in consumption.
B)both inferior goods.
C)complements in consumption.
D)both luxury goods.
A)substitutes in consumption.
B)both inferior goods.
C)complements in consumption.
D)both luxury goods.
Unlock Deck
Unlock for access to all 476 flashcards in this deck.
Unlock Deck
k this deck
49
Studies have shown links between calcium consumption and a reduction in osteoporosis.How does this affect the market for calcium?
A)The calcium supply curve shifts to the right because of a change in tastes in favor of calcium.
B)The calcium demand curve shifts to the right because of a change in tastes in favor of calcium.
C)The calcium demand curve shifts to the left because this new information will increase the price of calcium.
D)The calcium supply curve shifts to the left because this new information will increase the price of calcium.
Unlock Deck
Unlock for access to all 476 flashcards in this deck.
Unlock Deck
k this deck
50
A firm must devote people,time,and money to designing a new product.Because any firm has only limited resources,it
A)should wait until its competitors develop a similar product before deciding on devoting resources to its own product development.
B)is not able to develop more than one new product at a time.
C)must be certain that the product it chooses to develop will be successful or it will not be able to stay in business.
D)faces a trade-off,because resources used to develop one product will not be available to develop another product.
Unlock Deck
Unlock for access to all 476 flashcards in this deck.
Unlock Deck
k this deck
51
Tom Searchinger,a senior attorney at the Environmental Defense Fund,observed that generous farm subsidies have encouraged farmers to produce more corn and more wheat.How does this affect the market for fertilizer?
A)The supply of fertilizer increases.
B)The supply of fertilizer decreases.
C)The demand for fertilizer increases.
D)The demand for fertilizer decreases.
A)The supply of fertilizer increases.
B)The supply of fertilizer decreases.
C)The demand for fertilizer increases.
D)The demand for fertilizer decreases.
Unlock Deck
Unlock for access to all 476 flashcards in this deck.
Unlock Deck
k this deck
52
If,in response to a decrease in the price of grapes,the quantity of grapes demanded increases,economists would describe this as
A)an increase in demand.
B)an increase in quantity demanded.
C)a change in consumer income.
D)an increase in consumers' taste for grapes.
A)an increase in demand.
B)an increase in quantity demanded.
C)a change in consumer income.
D)an increase in consumers' taste for grapes.
Unlock Deck
Unlock for access to all 476 flashcards in this deck.
Unlock Deck
k this deck
53
A(n)________ is represented by a leftward shift of the demand curve while a(n)________ is represented by a movement along a given demand curve.
A)decrease in demand;increase in demand
B)decrease in demand;increase in quantity demanded
C)increase in demand;decrease in quantity demanded
D)decrease in quantity demanded;decrease in demand
A)decrease in demand;increase in demand
B)decrease in demand;increase in quantity demanded
C)increase in demand;decrease in quantity demanded
D)decrease in quantity demanded;decrease in demand
Unlock Deck
Unlock for access to all 476 flashcards in this deck.
Unlock Deck
k this deck
54
Suppose that when the price of raspberries increases,Lonnie increases his purchases of papayas.To Lonnie
A)raspberries and papayas are complements.
B)raspberries and papayas are inferior goods.
C)raspberries and papayas are normal goods.
D)raspberries and papayas are substitutes.
A)raspberries and papayas are complements.
B)raspberries and papayas are inferior goods.
C)raspberries and papayas are normal goods.
D)raspberries and papayas are substitutes.
Unlock Deck
Unlock for access to all 476 flashcards in this deck.
Unlock Deck
k this deck
55
If the price of automobiles was to increase,then
A)the demand for gasoline would decrease.
B)the demand for gasoline would increase.
C)the supply of gasoline would increase.
D)the quantity of gasoline demanded would decrease.
A)the demand for gasoline would decrease.
B)the demand for gasoline would increase.
C)the supply of gasoline would increase.
D)the quantity of gasoline demanded would decrease.
Unlock Deck
Unlock for access to all 476 flashcards in this deck.
Unlock Deck
k this deck
56
The law of demand implies,holding everything else constant,that as the price of gelato
A)increases,the demand for gelato will increase.
B)increases,the quantity of gelato demanded will increase.
C)decreases,the quantity of gelato demanded will increase.
D)decreases,the demand for gelato will increase.
A)increases,the demand for gelato will increase.
B)increases,the quantity of gelato demanded will increase.
C)decreases,the quantity of gelato demanded will increase.
D)decreases,the demand for gelato will increase.
Unlock Deck
Unlock for access to all 476 flashcards in this deck.
Unlock Deck
k this deck
57
Technological advances have resulted in lower prices for digital cameras.What is the impact of this on the market for traditional (non-digital)cameras?
A)The demand curve for traditional cameras shifts to the right.
B)The supply curve for traditional cameras shifts to the right.
C)The demand curve for traditional cameras shifts to the left.
D)The supply curve for traditional cameras shifts to the left.
A)The demand curve for traditional cameras shifts to the right.
B)The supply curve for traditional cameras shifts to the right.
C)The demand curve for traditional cameras shifts to the left.
D)The supply curve for traditional cameras shifts to the left.
Unlock Deck
Unlock for access to all 476 flashcards in this deck.
Unlock Deck
k this deck
58
Which of the following has occurred as the millennial generation has come of age?
A)The demand for "fast casual" food has decreased in the U.S.market.
B)The demand for golf equipment has decreased in the U.S.market.
C)The demand for traditional fast food has increased in the U.S.market.
D)all of the above
A)The demand for "fast casual" food has decreased in the U.S.market.
B)The demand for golf equipment has decreased in the U.S.market.
C)The demand for traditional fast food has increased in the U.S.market.
D)all of the above
Unlock Deck
Unlock for access to all 476 flashcards in this deck.
Unlock Deck
k this deck
59
Suppose that when the price of hamburgers decreases,the Ruiz family increases their purchases of ketchup.To the Ruiz family
A)hamburgers and ketchup are complements.
B)hamburgers and ketchup and substitutes.
C)hamburgers and ketchup are normal goods.
D)hamburgers are normal goods and ketchup is an inferior good.
A)hamburgers and ketchup are complements.
B)hamburgers and ketchup and substitutes.
C)hamburgers and ketchup are normal goods.
D)hamburgers are normal goods and ketchup is an inferior good.
Unlock Deck
Unlock for access to all 476 flashcards in this deck.
Unlock Deck
k this deck
60
Technological advancements have led to lower prices and an increase in the sale of digital cameras.How does this affect the digital photo printing paper market?
A)The demand curve for digital photo printing paper shifts to the right.
B)The demand curve for digital photo printing paper shifts to the left.
C)The supply curve for digital photo printing paper shifts to the right.
D)The supply curve for digital photo printing paper shifts to the left.
A)The demand curve for digital photo printing paper shifts to the right.
B)The demand curve for digital photo printing paper shifts to the left.
C)The supply curve for digital photo printing paper shifts to the right.
D)The supply curve for digital photo printing paper shifts to the left.
Unlock Deck
Unlock for access to all 476 flashcards in this deck.
Unlock Deck
k this deck
61
How does the decreasing use of traditional cameras affect the market for traditional camera film?
A)The demand curve for traditional camera film shifts to the right.
B)The quantity of traditional camera film demanded decreases.
C)The quantity of traditional camera film demanded increases.
D)The demand curve for traditional camera film shifts to the left.
A)The demand curve for traditional camera film shifts to the right.
B)The quantity of traditional camera film demanded decreases.
C)The quantity of traditional camera film demanded increases.
D)The demand curve for traditional camera film shifts to the left.
Unlock Deck
Unlock for access to all 476 flashcards in this deck.
Unlock Deck
k this deck
62
If the price of refillable butane lighters was to decrease,then
A)the demand for butane would decrease.
B)the demand for butane would increase.
C)the quantity of butane demanded would increase.
D)the quantity of butane demanded would decrease.
A)the demand for butane would decrease.
B)the demand for butane would increase.
C)the quantity of butane demanded would increase.
D)the quantity of butane demanded would decrease.
Unlock Deck
Unlock for access to all 476 flashcards in this deck.
Unlock Deck
k this deck
63
Table 3-2
-Refer to Table 3-2.The table above shows the demand schedules for caviar of two individuals (Ari and Sonia)and the rest of the market.At a price of $55,the quantity demanded in the market would be
A)42 oz.
B)136 oz.
C)178 oz.
D)233 oz.
-Refer to Table 3-2.The table above shows the demand schedules for caviar of two individuals (Ari and Sonia)and the rest of the market.At a price of $55,the quantity demanded in the market would be
A)42 oz.
B)136 oz.
C)178 oz.
D)233 oz.
Unlock Deck
Unlock for access to all 476 flashcards in this deck.
Unlock Deck
k this deck
64
A change in which variable will change the market demand for a product?
A)the price of the product
B)population
C)technology
D)the prices of substitutes in production
A)the price of the product
B)population
C)technology
D)the prices of substitutes in production
Unlock Deck
Unlock for access to all 476 flashcards in this deck.
Unlock Deck
k this deck
65
The market for smartwatches is becoming very competitive.The increase in competition in this market is an example of how the market responds to
A)changes in consumer tastes.
B)increases in income.
C)changes in population.
D)decreases in the price of smartphones (a substitute for the product).
A)changes in consumer tastes.
B)increases in income.
C)changes in population.
D)decreases in the price of smartphones (a substitute for the product).
Unlock Deck
Unlock for access to all 476 flashcards in this deck.
Unlock Deck
k this deck
66
If the price of gasoline decreases,what will be the impact in the market for public transportation?
A)The demand curve for public transportation shifts to the right.
B)The quantity of public transportation demanded increases.
C)The demand curve for public transportation shifts to the left.
D)The quantity of public transportation demanded decreases.
A)The demand curve for public transportation shifts to the right.
B)The quantity of public transportation demanded increases.
C)The demand curve for public transportation shifts to the left.
D)The quantity of public transportation demanded decreases.
Unlock Deck
Unlock for access to all 476 flashcards in this deck.
Unlock Deck
k this deck
67
The phrase "demand has decreased" means that
A)a demand curve has shifted to the left.
B)there has been an upward movement along a demand curve.
C)there has been a downward movement along a demand curve.
D)a demand curve has shifted to the right.
A)a demand curve has shifted to the left.
B)there has been an upward movement along a demand curve.
C)there has been a downward movement along a demand curve.
D)a demand curve has shifted to the right.
Unlock Deck
Unlock for access to all 476 flashcards in this deck.
Unlock Deck
k this deck
68
If,in response to a decrease in the price of coffee,the quantity of coffee demanded increases,economists would describe this as
A)an increase in demand.
B)an increase in quantity demanded.
C)a change in consumer income.
D)an increase in consumers' taste for coffee.
A)an increase in demand.
B)an increase in quantity demanded.
C)a change in consumer income.
D)an increase in consumers' taste for coffee.
Unlock Deck
Unlock for access to all 476 flashcards in this deck.
Unlock Deck
k this deck
69
If a decrease in income leads to an increase in the demand for sardines,then sardines are
A)an inferior good.
B)a neutral good.
C)a necessity.
D)a normal good.
A)an inferior good.
B)a neutral good.
C)a necessity.
D)a normal good.
Unlock Deck
Unlock for access to all 476 flashcards in this deck.
Unlock Deck
k this deck
70
Holding everything else constant,a decrease in the price of bicycles will result in
A)a decrease in the quantity of bicycles demanded.
B)an increase in the demand for bicycles.
C)a decrease in the supply of bicycles.
D)an increase in the quantity of bicycles demanded.
A)a decrease in the quantity of bicycles demanded.
B)an increase in the demand for bicycles.
C)a decrease in the supply of bicycles.
D)an increase in the quantity of bicycles demanded.
Unlock Deck
Unlock for access to all 476 flashcards in this deck.
Unlock Deck
k this deck
71
If a decrease in income leads to a decrease in the demand for mac and cheese,then mac and cheese is
A)a normal good.
B)a neutral good.
C)a complement.
D)a necessity.
A)a normal good.
B)a neutral good.
C)a complement.
D)a necessity.
Unlock Deck
Unlock for access to all 476 flashcards in this deck.
Unlock Deck
k this deck
72
Suppose that when the price of hamburgers decreases,the Landry family decreases their purchases of chicken nuggets.To the Landry family
A)hamburgers and chicken nuggets are complements.
B)hamburgers and chicken nuggets are inferior goods.
C)hamburgers and chicken nuggets are normal goods.
D)hamburgers and chicken nuggets are substitutes.
A)hamburgers and chicken nuggets are complements.
B)hamburgers and chicken nuggets are inferior goods.
C)hamburgers and chicken nuggets are normal goods.
D)hamburgers and chicken nuggets are substitutes.
Unlock Deck
Unlock for access to all 476 flashcards in this deck.
Unlock Deck
k this deck
73
If,in response to an increase in the price of pineapples,the quantity of pineapples demanded decreases,economists would describe this as
A)an decrease in demand.
B)a decrease in quantity demanded.
C)a change in consumer income.
D)a decrease in consumers' taste for pineapples.
A)an decrease in demand.
B)a decrease in quantity demanded.
C)a change in consumer income.
D)a decrease in consumers' taste for pineapples.
Unlock Deck
Unlock for access to all 476 flashcards in this deck.
Unlock Deck
k this deck
74
Table 3-2
-Refer to Table 3-2.The table above shows the demand schedules for caviar of two individuals (Ari and Sonia)and the rest of the market.If the price of caviar rises from $65 to $75,the market quantity demanded would
A)decrease by 36 oz.
B)increase by 52 oz.
C)increase by 36 oz.
D)decrease by 52 oz.
-Refer to Table 3-2.The table above shows the demand schedules for caviar of two individuals (Ari and Sonia)and the rest of the market.If the price of caviar rises from $65 to $75,the market quantity demanded would
A)decrease by 36 oz.
B)increase by 52 oz.
C)increase by 36 oz.
D)decrease by 52 oz.
Unlock Deck
Unlock for access to all 476 flashcards in this deck.
Unlock Deck
k this deck
75
A demand curve shows the relationship between
A)the price of a product and the quantity of the product demanded.
B)the amount of a product sellers are willing to sell at a particular price and the amount consumers are willing to buy at that price.
C)the quantity that consumers are willing and able to buy and the quantity that sellers are willing and able to offer.
D)the price of a produce and the demand for the product.
Unlock Deck
Unlock for access to all 476 flashcards in this deck.
Unlock Deck
k this deck
76
Suppose that when the price of strawberries decreases,Simone increases her purchase of whipped cream.To Simone
A)strawberries and whipped cream are complements.
B)strawberries and whipped cream and substitutes.
C)strawberries and whipped cream are normal goods.
D)strawberries are a normal good and whipped cream is an inferior good.
A)strawberries and whipped cream are complements.
B)strawberries and whipped cream and substitutes.
C)strawberries and whipped cream are normal goods.
D)strawberries are a normal good and whipped cream is an inferior good.
Unlock Deck
Unlock for access to all 476 flashcards in this deck.
Unlock Deck
k this deck
77
A(n)________ is represented by a rightward shift of the demand curve while a(n)________ is represented by a movement along a given demand curve.
A)increase in demand;decrease in demand
B)increase in demand;increase in quantity demanded
C)decrease in demand;decrease in quantity demanded
D)increase in quantity demanded;increase in demand
A)increase in demand;decrease in demand
B)increase in demand;increase in quantity demanded
C)decrease in demand;decrease in quantity demanded
D)increase in quantity demanded;increase in demand
Unlock Deck
Unlock for access to all 476 flashcards in this deck.
Unlock Deck
k this deck
78
If you are considering buying either an Apple Watch or a Samsung Gear S2,and you choose the Samsung only because the price is lower,then you consider
A)the Apple Watch to be a normal good and the Samsung Gear S2 to be an inferior good.
B)the Apple Watch to be an inferior good and Samsung Gear S2 to be a normal good.
C)the Apple Watch and the Samsung Gear S2 to be complements.
D)the Apple Watch and the Samsung Gear S2 to be substitutes.
A)the Apple Watch to be a normal good and the Samsung Gear S2 to be an inferior good.
B)the Apple Watch to be an inferior good and Samsung Gear S2 to be a normal good.
C)the Apple Watch and the Samsung Gear S2 to be complements.
D)the Apple Watch and the Samsung Gear S2 to be substitutes.
Unlock Deck
Unlock for access to all 476 flashcards in this deck.
Unlock Deck
k this deck
79
Table 3-2
-Refer to Table 3-2.The table above shows the demand schedules for caviar of two individuals (Ari and Sonia)and the rest of the market.If the price of caviar falls from $45 to $35,the market quantity demanded would
A)decrease by 50 oz.
B)increase by 70 oz.
C)increase by 50 oz.
D)decrease by 70 oz.
-Refer to Table 3-2.The table above shows the demand schedules for caviar of two individuals (Ari and Sonia)and the rest of the market.If the price of caviar falls from $45 to $35,the market quantity demanded would
A)decrease by 50 oz.
B)increase by 70 oz.
C)increase by 50 oz.
D)decrease by 70 oz.
Unlock Deck
Unlock for access to all 476 flashcards in this deck.
Unlock Deck
k this deck
80
Table 3-2
-Refer to Table 3-2.The table above shows the demand schedules for caviar of two individuals (Ari and Sonia)and the rest of the market.At a price of $75,the quantity demanded in the market would be
A)6 oz.
B)46 oz.
C)52 oz.
D)127 oz.
-Refer to Table 3-2.The table above shows the demand schedules for caviar of two individuals (Ari and Sonia)and the rest of the market.At a price of $75,the quantity demanded in the market would be
A)6 oz.
B)46 oz.
C)52 oz.
D)127 oz.
Unlock Deck
Unlock for access to all 476 flashcards in this deck.
Unlock Deck
k this deck
Unlock Deck
Unlock for access to all 476 flashcards in this deck.


