Deck 21: Multilevel Linear Models
Full screen (f)
Question
What effect does 'centering' have on the data in the following experiment In their study of 'Using individual growth model to analyse the change in quality of life from adolescence to adulthood' (2006), Chen and Cohen conducted interviews on 3 different occasions over a period of time and the following graph demonstrates the physical health changes noted over these 3 periods in 20 of their sample.
 Individual Physical Health Change (raw data, n = 20)
Chen and Cohen Health and Quality of Life Outcomes 2006 4:10 doi:10.1186/1477-7525-4-10
A) It makes the slope more visible.
B) It makes the intercept more interpretable.
C) It makes the variance more evident.
D) None of the above.
Individual Physical Health Change (raw data, n = 20)Chen and Cohen Health and Quality of Life Outcomes 2006 4:10 doi:10.1186/1477-7525-4-10
A) It makes the slope more visible.
B) It makes the intercept more interpretable.
C) It makes the variance more evident.
D) None of the above.
Question
Question
In their study of 'Using individual growth model to analyse the change in quality of life from adolescence to adulthood', Chen and Cohen (2006) conducted interviews on three different occasions over a period of time, and the following graph demonstrates the physical health changes noted over these three periods in 20 of their sample. 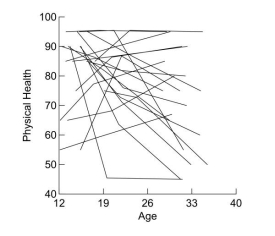 Individual Physical Health Change (raw data, n = 20)
What does the graph illustrate?
A) No evidence of variability in physical health scores.
B) Small inter-individual variability in physical health scores.
C) Large inter-individual variability in physical health scores.
D) None of the above.
Individual Physical Health Change (raw data, n = 20)What does the graph illustrate?
A) No evidence of variability in physical health scores.
B) Small inter-individual variability in physical health scores.
C) Large inter-individual variability in physical health scores.
D) None of the above.
Question
In a study of the analysis of large hierarchical data with multilevel logistic modelling using PROC Glimmix, Li et al. determine the following results in their first approach to the analysis when considering factors associated with death from injury and exposure, gender, race or age  What would you consider to be the findings of this result?
A) No significant association between death from injury and gender.
B) No significant association between death from injury and race.
C) A significant association between death from injury and exposure.
D) No significant association between death from injury and age.
What would you consider to be the findings of this result?A) No significant association between death from injury and gender.
B) No significant association between death from injury and race.
C) A significant association between death from injury and exposure.
D) No significant association between death from injury and age.
Question
In a study of the Analysis of Large Hierarchical Data with Multilevel Logistic modelling using PROC Glimmix, Li et al determine the following results in their first approach to the analysis when considering factors associated with death from injury and exposure, gender, race or age  In their second round of analysis, a range of data outputs were achieved including the following table
 What do the data represent?
A) They tell whether predictors significantly predict the outcome, and in this example the predictor of exposure is not significant.
B) They tell whether predictors significantly predict the outcome, and in this example the predictor of gender is not significant.
C) They tell whether predictors significantly predict the outcome, and in this example the predictor of race is not significant.
D) They tell whether predictors significantly predict the outcome, and in this example the predictor of age is not significant.
In their second round of analysis, a range of data outputs were achieved including the following table What do the data represent?A) They tell whether predictors significantly predict the outcome, and in this example the predictor of exposure is not significant.
B) They tell whether predictors significantly predict the outcome, and in this example the predictor of gender is not significant.
C) They tell whether predictors significantly predict the outcome, and in this example the predictor of race is not significant.
D) They tell whether predictors significantly predict the outcome, and in this example the predictor of age is not significant.
Question
In their study of 'Using individual growth model to analyse the change in quality of life from adolescence to adulthood' (2006), Chen and Cohen conducted interviews on 3 different occasions over a period of time and the following graph demonstrates the physical health changes noted over these 3 periods in 20 of their sample.  Individual Physical Health Change (raw data, n = 20)
Chen and Cohen Health and Quality of Life Outcomes 2006 4:10 doi:10.1186/1477-7525-4-10
With reference to the graph, what can be deduced about the majority of those sampled?
A) Physical health increases with age.
B) Physical health decreases with age.
C) Most of the sample have good physical health.
D) Most of the sample have failing physical health.
Individual Physical Health Change (raw data, n = 20)Chen and Cohen Health and Quality of Life Outcomes 2006 4:10 doi:10.1186/1477-7525-4-10
With reference to the graph, what can be deduced about the majority of those sampled?
A) Physical health increases with age.
B) Physical health decreases with age.
C) Most of the sample have good physical health.
D) Most of the sample have failing physical health.
Question
Which of the following was not a good predictor of physical health in this example? In their study of 'Using individual growth model to analyse the change in quality of life from adolescence to adulthood' (2006), Chen and Cohen conducted interviews on 3 different occasions over a period of time and the following graph demonstrates the physical health changes noted over these 3 periods in 20 of their sample.
 Individual Physical Health Change (raw data, n = 20)
Chen and Cohen Health and Quality of Life Outcomes 2006 4:10 doi:10.1186/1477-7525-4-10
The following results are obtained from fitting the unconditional linear growth model.
Table 1

A) Age
B) Gender
C) Psychiatric disorder
D) None of the above
Individual Physical Health Change (raw data, n = 20)Chen and Cohen Health and Quality of Life Outcomes 2006 4:10 doi:10.1186/1477-7525-4-10
The following results are obtained from fitting the unconditional linear growth model.
Table 1
A) Age
B) Gender
C) Psychiatric disorder
D) None of the above
Question
What does the Estimates of Covariance Parameters table tell you about the data? 
A) Effect size
B) Random effects
C) Variance
D)None of the above
A) Effect size
B) Random effects
C) Variance
D)None of the above
Question

Unlock Deck
Sign up to unlock the cards in this deck!
Unlock Deck
Unlock Deck
1/9
Play
Full screen (f)
Deck 21: Multilevel Linear Models
1
What effect does 'centering' have on the data in the following experiment In their study of 'Using individual growth model to analyse the change in quality of life from adolescence to adulthood' (2006), Chen and Cohen conducted interviews on 3 different occasions over a period of time and the following graph demonstrates the physical health changes noted over these 3 periods in 20 of their sample.
Individual Physical Health Change (raw data, n = 20)
Chen and Cohen Health and Quality of Life Outcomes 2006 4:10 doi:10.1186/1477-7525-4-10
A) It makes the slope more visible.
B) It makes the intercept more interpretable.
C) It makes the variance more evident.
D) None of the above.
Individual Physical Health Change (raw data, n = 20)Chen and Cohen Health and Quality of Life Outcomes 2006 4:10 doi:10.1186/1477-7525-4-10
A) It makes the slope more visible.
B) It makes the intercept more interpretable.
C) It makes the variance more evident.
D) None of the above.
It makes the intercept more interpretable.
2
At age 23, what was the average physical health score of the young adults?
A) 70.95
B) 72.26
C) 74.71
D) 75.19
A) 70.95
B) 72.26
C) 74.71
D) 75.19
74.71
3
In their study of 'Using individual growth model to analyse the change in quality of life from adolescence to adulthood', Chen and Cohen (2006) conducted interviews on three different occasions over a period of time, and the following graph demonstrates the physical health changes noted over these three periods in 20 of their sample. Individual Physical Health Change (raw data, n = 20)
What does the graph illustrate?
A) No evidence of variability in physical health scores.
B) Small inter-individual variability in physical health scores.
C) Large inter-individual variability in physical health scores.
D) None of the above.
Individual Physical Health Change (raw data, n = 20)What does the graph illustrate?
A) No evidence of variability in physical health scores.
B) Small inter-individual variability in physical health scores.
C) Large inter-individual variability in physical health scores.
D) None of the above.
Large inter-individual variability in physical health scores.
4
In a study of the analysis of large hierarchical data with multilevel logistic modelling using PROC Glimmix, Li et al. determine the following results in their first approach to the analysis when considering factors associated with death from injury and exposure, gender, race or age What would you consider to be the findings of this result?
A) No significant association between death from injury and gender.
B) No significant association between death from injury and race.
C) A significant association between death from injury and exposure.
D) No significant association between death from injury and age.
What would you consider to be the findings of this result?A) No significant association between death from injury and gender.
B) No significant association between death from injury and race.
C) A significant association between death from injury and exposure.
D) No significant association between death from injury and age.
Unlock Deck
Unlock for access to all 9 flashcards in this deck.
Unlock Deck
k this deck
5
In a study of the Analysis of Large Hierarchical Data with Multilevel Logistic modelling using PROC Glimmix, Li et al determine the following results in their first approach to the analysis when considering factors associated with death from injury and exposure, gender, race or age In their second round of analysis, a range of data outputs were achieved including the following table
What do the data represent?
A) They tell whether predictors significantly predict the outcome, and in this example the predictor of exposure is not significant.
B) They tell whether predictors significantly predict the outcome, and in this example the predictor of gender is not significant.
C) They tell whether predictors significantly predict the outcome, and in this example the predictor of race is not significant.
D) They tell whether predictors significantly predict the outcome, and in this example the predictor of age is not significant.
In their second round of analysis, a range of data outputs were achieved including the following table What do the data represent?A) They tell whether predictors significantly predict the outcome, and in this example the predictor of exposure is not significant.
B) They tell whether predictors significantly predict the outcome, and in this example the predictor of gender is not significant.
C) They tell whether predictors significantly predict the outcome, and in this example the predictor of race is not significant.
D) They tell whether predictors significantly predict the outcome, and in this example the predictor of age is not significant.
Unlock Deck
Unlock for access to all 9 flashcards in this deck.
Unlock Deck
k this deck
6
In their study of 'Using individual growth model to analyse the change in quality of life from adolescence to adulthood' (2006), Chen and Cohen conducted interviews on 3 different occasions over a period of time and the following graph demonstrates the physical health changes noted over these 3 periods in 20 of their sample. Individual Physical Health Change (raw data, n = 20)
Chen and Cohen Health and Quality of Life Outcomes 2006 4:10 doi:10.1186/1477-7525-4-10
With reference to the graph, what can be deduced about the majority of those sampled?
A) Physical health increases with age.
B) Physical health decreases with age.
C) Most of the sample have good physical health.
D) Most of the sample have failing physical health.
Individual Physical Health Change (raw data, n = 20)Chen and Cohen Health and Quality of Life Outcomes 2006 4:10 doi:10.1186/1477-7525-4-10
With reference to the graph, what can be deduced about the majority of those sampled?
A) Physical health increases with age.
B) Physical health decreases with age.
C) Most of the sample have good physical health.
D) Most of the sample have failing physical health.
Unlock Deck
Unlock for access to all 9 flashcards in this deck.
Unlock Deck
k this deck
7
Which of the following was not a good predictor of physical health in this example? In their study of 'Using individual growth model to analyse the change in quality of life from adolescence to adulthood' (2006), Chen and Cohen conducted interviews on 3 different occasions over a period of time and the following graph demonstrates the physical health changes noted over these 3 periods in 20 of their sample.
Individual Physical Health Change (raw data, n = 20)
Chen and Cohen Health and Quality of Life Outcomes 2006 4:10 doi:10.1186/1477-7525-4-10
The following results are obtained from fitting the unconditional linear growth model.
Table 1
A) Age
B) Gender
C) Psychiatric disorder
D) None of the above
Individual Physical Health Change (raw data, n = 20)Chen and Cohen Health and Quality of Life Outcomes 2006 4:10 doi:10.1186/1477-7525-4-10
The following results are obtained from fitting the unconditional linear growth model.
Table 1
A) Age
B) Gender
C) Psychiatric disorder
D) None of the above
Unlock Deck
Unlock for access to all 9 flashcards in this deck.
Unlock Deck
k this deck
8
What does the Estimates of Covariance Parameters table tell you about the data?
A) Effect size
B) Random effects
C) Variance
D)None of the above
A) Effect size
B) Random effects
C) Variance
D)None of the above
Unlock Deck
Unlock for access to all 9 flashcards in this deck.
Unlock Deck
k this deck
9
Which of the following is not an example of the benefits of multilevel models?
A) No assumptions of homogeneity of regression slope
B) No assumptions of independence
C) No issue with missing data
D) No assumption of interaction
A) No assumptions of homogeneity of regression slope
B) No assumptions of independence
C) No issue with missing data
D) No assumption of interaction
Unlock Deck
Unlock for access to all 9 flashcards in this deck.
Unlock Deck
k this deck
Unlock Deck
Unlock for access to all 9 flashcards in this deck.


