Deck 9: The Linear Model Regression
Full screen (f)
Question
Question
Question
A researcher had a categorical variable that they wanted to include as a predictor in a regression equation. The researcher was trying to predict the success of a back pain intervention, and the categorical variable was the duration of the back pain prior to treatment, with four categories: less than 6 months, 6-12 months, 1-2 years, more than 2 years. They needed to code these variables into dummy variables for the regression using less than 6 months as their control category. Which of the following represents the correct coding scheme?
A)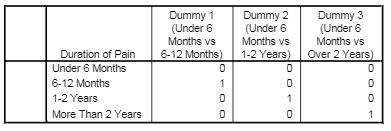
B)
C)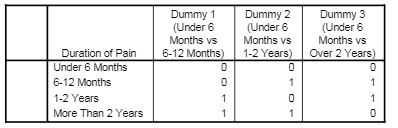
D)
A)
B)
C)
D)
Question
Question
Question
Question
Question
Question
Question
Question
What does the following graph show? 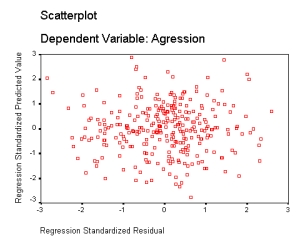
A) Heteroscedasticity
B) Non-linearity
C) Heteroscedasticity and non-linearity
D) Regression assumptions that have been met
A) Heteroscedasticity
B) Non-linearity
C) Heteroscedasticity and non-linearity
D) Regression assumptions that have been met
Question
Question
Question
Question
Question
Question
Question
Question
Question

Unlock Deck
Sign up to unlock the cards in this deck!
Unlock Deck
Unlock Deck
1/20
Play
Full screen (f)
Deck 9: The Linear Model Regression
1
The distance of cases from the model mean is called
A) Leverage values
B) Hat values
C) Standard distances
D) Mahalanobis distances
A) Leverage values
B) Hat values
C) Standard distances
D) Mahalanobis distances
Mahalanobis distances
2
Which of the following statements about the F-ratio is true?
A) The F-ratio is the ratio of variance explained by the model to the error in the model.
B) The F-ratio is the ratio of variance explained by the model to the total variance in the outcome variable.
C) The F-ratio is the ratio of error variance to the total variance.
D) The F-ratio is the proportion of variance explained by the regression model.
The F-ratio is the ratio of variance explained by the model to the error in the model.
3
A researcher had a categorical variable that they wanted to include as a predictor in a regression equation. The researcher was trying to predict the success of a back pain intervention, and the categorical variable was the duration of the back pain prior to treatment, with four categories: less than 6 months, 6-12 months, 1-2 years, more than 2 years. They needed to code these variables into dummy variables for the regression using less than 6 months as their control category. Which of the following represents the correct coding scheme?
A)
B)
C)
D)
A)
B)
C)
D)
4
The difficulty with using one regression equation to predict values in a different set of data is called
A) Shrinkage
B) Contraction
C) Reduction
D) Washing
A) Shrinkage
B) Contraction
C) Reduction
D) Washing
Unlock Deck
Unlock for access to all 20 flashcards in this deck.
Unlock Deck
k this deck
5
Which of the following statements best defines the term 'multicollinearity'?
A) When two predictors have a combined correlation coefficient of 1
B) When there are strong correlations between two or more predictors in a regression model*
C) When one predictor is a perfect linear combination of the other predictors
D) None of the above
A) When two predictors have a combined correlation coefficient of 1
B) When there are strong correlations between two or more predictors in a regression model*
C) When one predictor is a perfect linear combination of the other predictors
D) None of the above
Unlock Deck
Unlock for access to all 20 flashcards in this deck.
Unlock Deck
k this deck
6
What is R2?
A) The percentage of variance in the predictor accounted for by the outcome variable
B) The proportion of variance in the outcome accounted for by the predictor variable or variables
C) The proportion of variance in the predictor accounted for by the outcome variable
D) The percentage of variance in the outcome accounted for by the predictor variable or variables
Unlock Deck
Unlock for access to all 20 flashcards in this deck.
Unlock Deck
k this deck
7
Which of these statements is not true?
A) If the average variance inflation factor is greater than 1 then the regression model might be biased.
B) Tolerance values above 0.2 may indicate multicollinearity in the data.*
C) Multicollinearity in the data is shown by a variance inflation factor (VIF) greater than 10.
D) The tolerance is 1 divided by the VIF.
Unlock Deck
Unlock for access to all 20 flashcards in this deck.
Unlock Deck
k this deck
8
What does the t-statistic test?
A) The null hypothesis that the value of b (correlation coefficient) is negative
B) The null hypothesis that the value of b (correlation coefficient) is equal to 0
C) The null hypothesis that the value of b (correlation coefficient) is equal to 1
D) The null hypothesis that the value of b (correlation coefficient) is positive
Unlock Deck
Unlock for access to all 20 flashcards in this deck.
Unlock Deck
k this deck
9
The method of least squares is used to find out which of the following?
A) The relationship of the gradient of the line
B) The intercept of the line
C) The gradient of the line
D) The line of best fit
A) The relationship of the gradient of the line
B) The intercept of the line
C) The gradient of the line
D) The line of best fit
Unlock Deck
Unlock for access to all 20 flashcards in this deck.
Unlock Deck
k this deck
10
A way of representing discrete variables in multiple regression is by constructing
A) Stupid variables
B) Dummy variables
C) Imitation variables
D) Faking variables
A) Stupid variables
B) Dummy variables
C) Imitation variables
D) Faking variables
Unlock Deck
Unlock for access to all 20 flashcards in this deck.
Unlock Deck
k this deck
11
What does the following graph show?
A) Heteroscedasticity
B) Non-linearity
C) Heteroscedasticity and non-linearity
D) Regression assumptions that have been met
A) Heteroscedasticity
B) Non-linearity
C) Heteroscedasticity and non-linearity
D) Regression assumptions that have been met
Unlock Deck
Unlock for access to all 20 flashcards in this deck.
Unlock Deck
k this deck
12
Which of the following statements about the t-statistic in regression is not true?
A) The t-statistic tests whether the regression coefficient, b, is equal to 0.
B) The t-statistic provides some idea of how well a predictor predicts the outcome variable.
C) The t-statistic can be used to see whether a predictor variable makes a statistically significant contribution to the regression model.
D) The t-statistic is equal to the regression coefficient divided by its standard deviation.
Unlock Deck
Unlock for access to all 20 flashcards in this deck.
Unlock Deck
k this deck
13
What does the F-test measure?
A) How much the model has improved the prediction of the outcome compared to the level of inaccuracy of the model
B) How much the model is influenced by the predictors compared to the numbers of residuals
C) How much the model relies on residual mean squares compared to the inaccuracies of the predictors
D) None of the above
Unlock Deck
Unlock for access to all 20 flashcards in this deck.
Unlock Deck
k this deck
14
For which regression assumption does the Durbin-Watson statistic test?
A) Linearity
B) Independence of errors
C) Homoscedasticity
D) Multicollinearity
A) Linearity
B) Independence of errors
C) Homoscedasticity
D) Multicollinearity
Unlock Deck
Unlock for access to all 20 flashcards in this deck.
Unlock Deck
k this deck
15
Which of the following is not a reason why multicollinearity a problem in regression?
A) It limits the size of R.
B) It makes it difficult to assess the importance of individual predictors.
C) It leads to unstable regression coefficients.
D) It creates heteroscedasticity in the data.
A) It limits the size of R.
B) It makes it difficult to assess the importance of individual predictors.
C) It leads to unstable regression coefficients.
D) It creates heteroscedasticity in the data.
Unlock Deck
Unlock for access to all 20 flashcards in this deck.
Unlock Deck
k this deck
16
When making assumptions about regression analysis, which of the following is not considered to be true?
A) Homoscedasticity
B) Independent errors
C) Perfect multicollinearity
D) Categorical or quantitative variable type
A) Homoscedasticity
B) Independent errors
C) Perfect multicollinearity
D) Categorical or quantitative variable type
Unlock Deck
Unlock for access to all 20 flashcards in this deck.
Unlock Deck
k this deck
17
A researcher summarizes her results of research into the use of a specific type of inhaler for asthma sufferers as follows: 'predictors significantly favoured inhaler use (adjusted R2= .38; p = .015). Inhaler A was the strongest predictor of improved breathing (β = .39; p = .001) followed by inhaler B (β = .28; p = .0015)'. Which of the following would be the best interpretation of the variables in relation to these results?
A) 39% of the variation in inhalers
B) 28% of the variation in inhalers
C) 38% of the variation in inhalers
D) None of the above
A) 39% of the variation in inhalers
B) 28% of the variation in inhalers
C) 38% of the variation in inhalers
D) None of the above
Unlock Deck
Unlock for access to all 20 flashcards in this deck.
Unlock Deck
k this deck
18
What is multicollinearity?
A) When predictor variables correlate very highly with each other.
B) When predictor variables have a linear relationship with the outcome variable.
C) When predictor variables are correlated with variables not in the regression model.
D) When predictor variables are independent.
A) When predictor variables correlate very highly with each other.
B) When predictor variables have a linear relationship with the outcome variable.
C) When predictor variables are correlated with variables not in the regression model.
D) When predictor variables are independent.
Unlock Deck
Unlock for access to all 20 flashcards in this deck.
Unlock Deck
k this deck
19
Which of the following statements about outliers is not true?
A) Outliers are values very different from the rest of the data.
B) Outliers bias the mean.
C) Outliers bias regression parameters.
D) Outliers are influential cases.
A) Outliers are values very different from the rest of the data.
B) Outliers bias the mean.
C) Outliers bias regression parameters.
D) Outliers are influential cases.
Unlock Deck
Unlock for access to all 20 flashcards in this deck.
Unlock Deck
k this deck
20
In a research experiment that looks at the levels of anxiety in relation to recordings of blood pressure, what factors would cause your data to be biased due to the effect on the estimated regression coefficients?
A) Residuals
B) Outliers
C) Residual sum of squares
D) None of the above
A) Residuals
B) Outliers
C) Residual sum of squares
D) None of the above
Unlock Deck
Unlock for access to all 20 flashcards in this deck.
Unlock Deck
k this deck
Unlock Deck
Unlock for access to all 20 flashcards in this deck.


