Deck 4: Measures of Central Tendency;the Mean, median, and Mode
Full screen (f)
Question
Question
Adding numbers is an important procedure in statistics.Instead of saying "add up all of the scores," we use the symbol
A)K.
B)X.
C) .
.
D)Y.
A)K.
B)X.
C)
.D)Y.
Question
Question
Question
Question
Question
Question
Question
Question
Question
Question
Question
Question
Question
Question
Question
Question
Question
Find the mode of the scores in the following frequency distribution. 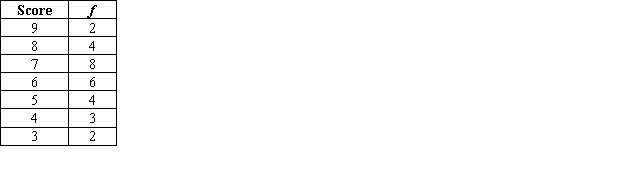
A)8
B)6
C)7
D)6.21
A)8
B)6
C)7
D)6.21
Question
Question
Find the median (middle)score in the following frequency distribution. 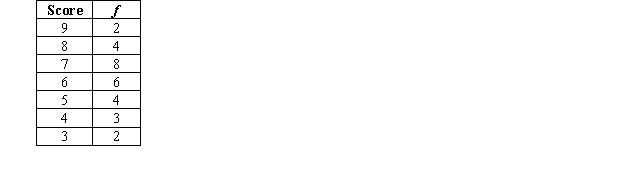
A)8
B)7
C)6.21
D)6
A)8
B)7
C)6.21
D)6
Question
Question
Question
Find the mean of the scores in the following frequency distribution.Remember the f column indicates the number of times each score occurred in the original data set. 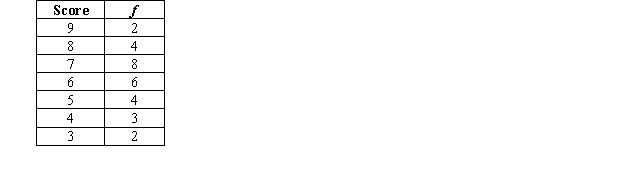
A)8
B)7
C)6.21
D)6
A)8
B)7
C)6.21
D)6
Question
Question
Question
Question
Question
Question
Question
Question
Question
Question
Question
For the following order of the measures of centrality,what shape best describes the associated distribution? 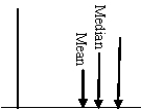
A)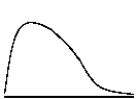
B)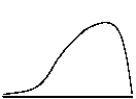
C)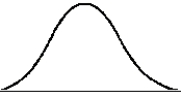
D)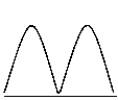
A)
B)
C)
D)
Question
Question
Question
Question
Question
Question
Question
Question
Question
Question
Question
Question
For the following set of scores,what is (are)  ?
?
7,8,10,10,11,12,13,13,15
A)4,3,2,1,0,1,-1,-2,-2,-4
B)-4,-3,-1,-1,0,1,2,2,4
C)4,3,1,1,0,1,2,2,4
D)0
?7,8,10,10,11,12,13,13,15
A)4,3,2,1,0,1,-1,-2,-2,-4
B)-4,-3,-1,-1,0,1,2,2,4
C)4,3,1,1,0,1,2,2,4
D)0
Question
Question
Question
When the mean is used to predict scores,a deviation  indicates
A)the sample is representative of the population.
B)the difference between the we predict and the score an individual actually gets.
C)the sum of all the deviations.
D)the individual's observed score.
indicatesA)the sample is representative of the population.
B)the difference between the
we predict and the score an individual actually gets.C)the sum of all the deviations.
D)the individual's observed score.
Question
Question
Question
Question
Question
Question
Based on the following results of an experiment,how many errors would a person who drank 4 oz.of alcohol make? 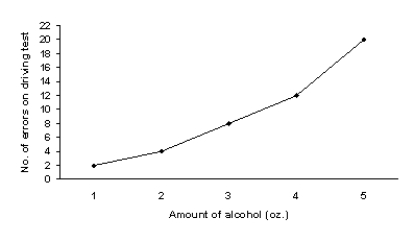
A)4
B)9.2
C)about 10
D)12
A)4
B)9.2
C)about 10
D)12
Question
Which of the following graphs does not indicate the presence of a relationship?
A)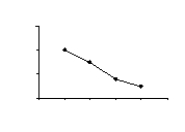
B)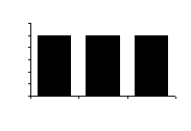
C)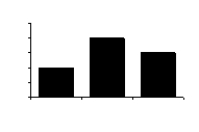
D)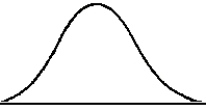
A)
B)
C)
D)
Question
Question
Question
Question
Question
A researcher conducts a study to investigate the influence of the amount of noise in the environment on the number of errors a person makes.The following means were obtained.What conclusion should be drawn from this experiment? 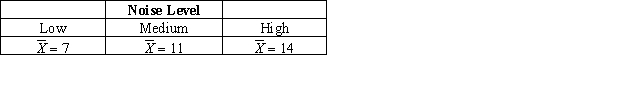
A)Apparently,there is no relationship between noise level and number of errors.
B)Apparently,there is a relationship: As the number of errors increases,the noise level also increases from around 7 to around 11 to around 14.
C)Apparently,there is a relationship: As the number of errors increases,the noise level also increases from low to medium to high.
D)Apparently there is a relationship: As the noise level increases,the number of errors also increases from around 7 to around 11 to around 14.

Unlock Deck
Sign up to unlock the cards in this deck!
Unlock Deck
Unlock Deck
1/62
Play
Full screen (f)
Deck 4: Measures of Central Tendency;the Mean, median, and Mode
1
Why is the median unaffected by extreme scores occurring in only one tail of the distribution?
A)Because the median ignores the mathematical values of the scores.
B)Because the median takes into account the actual values of all the scores.
C)Because the median is only one point in the whole distribution.
D)Because the median is based only on how frequently the median score occurs.
A)Because the median ignores the mathematical values of the scores.
B)Because the median takes into account the actual values of all the scores.
C)Because the median is only one point in the whole distribution.
D)Because the median is based only on how frequently the median score occurs.
Because the median ignores the mathematical values of the scores.
2
Adding numbers is an important procedure in statistics.Instead of saying "add up all of the scores," we use the symbol
A)K.
B)X.
C) .
D)Y.
A)K.
B)X.
C)
.D)Y.
. 3
Which measure of central tendency is appropriate if the shape of the distribution is severely skewed?
A)the mode
B)the median
C)the mean
D)the deviation
A)the mode
B)the median
C)the mean
D)the deviation
the median
4
In order to decide which measure of central tendency is appropriate,you must first determine
A)the appropriate graph to use and the independent variable.
B)the independent and the dependent variables.
C)how the data will be collected.
D)the scale of measurement being used and the shape of the distribution.
A)the appropriate graph to use and the independent variable.
B)the independent and the dependent variables.
C)how the data will be collected.
D)the scale of measurement being used and the shape of the distribution.
Unlock Deck
Unlock for access to all 62 flashcards in this deck.
Unlock Deck
k this deck
5
To obtain the mean,we would
A)count all the scores and divide by the total number of scores.
B)add all the scores and divide by the sum of all the scores.
C)divide the total number of scores by the sum of all the scores.
D)add all the scores and divide by the total number of scores.
A)count all the scores and divide by the total number of scores.
B)add all the scores and divide by the sum of all the scores.
C)divide the total number of scores by the sum of all the scores.
D)add all the scores and divide by the total number of scores.
Unlock Deck
Unlock for access to all 62 flashcards in this deck.
Unlock Deck
k this deck
6
In which of the following sets of data would the mode be inappropriate?
A)3,4,5,5,5,6,7
B)3,4,5,6,7
C)3,4,4,4,5,5,6,7
D)3,4,5,5,6,7
A)3,4,5,5,5,6,7
B)3,4,5,6,7
C)3,4,4,4,5,5,6,7
D)3,4,5,5,6,7
Unlock Deck
Unlock for access to all 62 flashcards in this deck.
Unlock Deck
k this deck
7
How would you describe the following set of scores? 2,2,3,3,3,3,4,4,5,6,7,7,8,8,8,8,9,9
A)negatively skewed
B)normally distributed
C)positively skewed
D)bimodal
A)negatively skewed
B)normally distributed
C)positively skewed
D)bimodal
Unlock Deck
Unlock for access to all 62 flashcards in this deck.
Unlock Deck
k this deck
8
With respect to other scores in a distribution,measures of central tendency
A)are around all the other scores.
B)are the points around which most of the scores are located.
C)usually fall in the tails or extremes of the distribution.
D)are never actually equal to one of the scores in the distribution.
A)are around all the other scores.
B)are the points around which most of the scores are located.
C)usually fall in the tails or extremes of the distribution.
D)are never actually equal to one of the scores in the distribution.
Unlock Deck
Unlock for access to all 62 flashcards in this deck.
Unlock Deck
k this deck
9
Which measure of central tendency should a researcher use to describe the sex of participants in a study?
A)the mean
B)the median
C)the mode
D)the deviation
A)the mean
B)the median
C)the mode
D)the deviation
Unlock Deck
Unlock for access to all 62 flashcards in this deck.
Unlock Deck
k this deck
10
The median is the preferred measure of central tendency when
A)the scale of measurement is nominal.
B)the scale of measurement is ordinal.
C)the scale of measurement is ratio.
D)the distribution is symmetrical and the scale of measurement is interval or ratio.
A)the scale of measurement is nominal.
B)the scale of measurement is ordinal.
C)the scale of measurement is ratio.
D)the distribution is symmetrical and the scale of measurement is interval or ratio.
Unlock Deck
Unlock for access to all 62 flashcards in this deck.
Unlock Deck
k this deck
11
Which measure of central tendency should an academic counselor use to describe a student's rank order in his/her classes?
A)the mean
B)the median
C)the mode
D)the deviation
A)the mean
B)the median
C)the mode
D)the deviation
Unlock Deck
Unlock for access to all 62 flashcards in this deck.
Unlock Deck
k this deck
12
Measures of central tendency are measures of
A)distance.
B)location.
C)deviation.
D)extremes.
A)distance.
B)location.
C)deviation.
D)extremes.
Unlock Deck
Unlock for access to all 62 flashcards in this deck.
Unlock Deck
k this deck
13
The median is defined as
A)the most frequently occurring score.
B)the mathematical center of the distribution.
C)the smallest deviation from the mean.
D)the score at the 50th percentile.
A)the most frequently occurring score.
B)the mathematical center of the distribution.
C)the smallest deviation from the mean.
D)the score at the 50th percentile.
Unlock Deck
Unlock for access to all 62 flashcards in this deck.
Unlock Deck
k this deck
14
The mode is defined as
A)the most frequently occurring score.
B)the mathematical center of the distribution.
C)the smallest deviation from the mean.
D)the point at or below which 50% of the scores fall.
A)the most frequently occurring score.
B)the mathematical center of the distribution.
C)the smallest deviation from the mean.
D)the point at or below which 50% of the scores fall.
Unlock Deck
Unlock for access to all 62 flashcards in this deck.
Unlock Deck
k this deck
15
In an effort to quit smoking,Pat began eating butterscotch hard candies.For the month of September,if Pat ate a total of 720 pieces of candy,what was the daily average of butterscotch candies consumed?
A)25.71
B)24
C)23.23
D)7.20
A)25.71
B)24
C)23.23
D)7.20
Unlock Deck
Unlock for access to all 62 flashcards in this deck.
Unlock Deck
k this deck
16
Find the mode of the following data set: 8,7,2,4,4,8,2,4,6,5,7,3,9,4,5,4,7
A)5
B)4
C)5.24
D)7
A)5
B)4
C)5.24
D)7
Unlock Deck
Unlock for access to all 62 flashcards in this deck.
Unlock Deck
k this deck
17
The mean is defined as
A)the most frequently occurring score.
B)the score located at the mathematical center of the distribution.
C)the smallest deviation from the center score.
D)the point at or below which 50% of the scores fall.
A)the most frequently occurring score.
B)the score located at the mathematical center of the distribution.
C)the smallest deviation from the center score.
D)the point at or below which 50% of the scores fall.
Unlock Deck
Unlock for access to all 62 flashcards in this deck.
Unlock Deck
k this deck
18
The mode is the appropriate measure of central tendency when the scale of measurement is
A)nominal.
B)ordinal.
C)interval.
D)ratio.
A)nominal.
B)ordinal.
C)interval.
D)ratio.
Unlock Deck
Unlock for access to all 62 flashcards in this deck.
Unlock Deck
k this deck
19
Find the mode of the scores in the following frequency distribution.
A)8
B)6
C)7
D)6.21
A)8
B)6
C)7
D)6.21
Unlock Deck
Unlock for access to all 62 flashcards in this deck.
Unlock Deck
k this deck
20
Why shouldn't the mode be used with the following set of scores? 2,5,3,3,4,2,4,5,1,1
A)The data are obviously not nominal.
B)There is no mode;all scores occur with the same frequency.
C)The scores are positively skewed.
D)The scores are negatively skewed.
A)The data are obviously not nominal.
B)There is no mode;all scores occur with the same frequency.
C)The scores are positively skewed.
D)The scores are negatively skewed.
Unlock Deck
Unlock for access to all 62 flashcards in this deck.
Unlock Deck
k this deck
21
Find the median (middle)score in the following frequency distribution.
A)8
B)7
C)6.21
D)6
A)8
B)7
C)6.21
D)6
Unlock Deck
Unlock for access to all 62 flashcards in this deck.
Unlock Deck
k this deck
22
An experimenter investigated the ability to concentrate as a function of crowding.Concentration was measured as the amount of time it took the participant to complete a word puzzle.How should the experimenter summarize the scores on the dependent variable?
A)Find the mode for crowding because crowding scores are nominal.
B)Find the mean amount of crowding,if crowding scores are normally distributed.
C)Find the mean amount of time it took to solve the puzzle,if time scores are normally distributed.
D)Find the median amount of time it took to solve the puzzle because time scores are ordinal.
Unlock Deck
Unlock for access to all 62 flashcards in this deck.
Unlock Deck
k this deck
23
Find the median of the following data set (that is,the middle score). 2,2,3,4,4,4,4,4,5,5,6,7,7,7,8,8,9
A)5
B)4
C)5.24
D)7
A)5
B)4
C)5.24
D)7
Unlock Deck
Unlock for access to all 62 flashcards in this deck.
Unlock Deck
k this deck
24
Find the mean of the scores in the following frequency distribution.Remember the f column indicates the number of times each score occurred in the original data set.
A)8
B)7
C)6.21
D)6
A)8
B)7
C)6.21
D)6
Unlock Deck
Unlock for access to all 62 flashcards in this deck.
Unlock Deck
k this deck
25
The mean is an inappropriate measure of central tendency when the distribution is severely skewed because
A)it is not the mathematical center of a skewed distribution.
B)only 50% of the scores in a skewed distribution are near it.
C)it does not accurately describe a skewed distribution.
D)only the mode describes a skewed distribution.
A)it is not the mathematical center of a skewed distribution.
B)only 50% of the scores in a skewed distribution are near it.
C)it does not accurately describe a skewed distribution.
D)only the mode describes a skewed distribution.
Unlock Deck
Unlock for access to all 62 flashcards in this deck.
Unlock Deck
k this deck
26
A deviation score of -3 indicates that the raw score is
A)greater than the mean.
B)greater than the median.
C)equal to the mean.
D)less than the mean.
A)greater than the mean.
B)greater than the median.
C)equal to the mean.
D)less than the mean.
Unlock Deck
Unlock for access to all 62 flashcards in this deck.
Unlock Deck
k this deck
27
The mean is used most often in behavioral research because researchers tend to
A)measure variables that have interval or ratio scores,and the scores form approximately normal distributions.
B)conduct research in which the mathematical center of a distribution is required.
C)conduct research in which only the most frequently occurring score is needed.
D)measure variables that have interval or ratio scores,and the scores usually do not form a normal distribution.
Unlock Deck
Unlock for access to all 62 flashcards in this deck.
Unlock Deck
k this deck
28
A deviation score is more informative than a raw score because it
A)describes the shape of the distribution.
B)has a greater numeric value.
C)is a transformation of the raw score.
D)indicates both the score's distance and direction from the mean.
A)describes the shape of the distribution.
B)has a greater numeric value.
C)is a transformation of the raw score.
D)indicates both the score's distance and direction from the mean.
Unlock Deck
Unlock for access to all 62 flashcards in this deck.
Unlock Deck
k this deck
29
When a distribution's mode = median = mean,it is said to be
A)positively skewed.
B)negatively skewed.
C)symmetrical.
D)bimodal.
A)positively skewed.
B)negatively skewed.
C)symmetrical.
D)bimodal.
Unlock Deck
Unlock for access to all 62 flashcards in this deck.
Unlock Deck
k this deck
30
The mean is the preferred measure of central tendency when
A)the scale of measurement is interval.
B)the scale of measurement is ordinal,interval,or ratio and the distribution is skewed.
C)the scale of measurement is ratio.
D)the distribution is symmetrical and the scale of measurement is interval or ratio.
A)the scale of measurement is interval.
B)the scale of measurement is ordinal,interval,or ratio and the distribution is skewed.
C)the scale of measurement is ratio.
D)the distribution is symmetrical and the scale of measurement is interval or ratio.
Unlock Deck
Unlock for access to all 62 flashcards in this deck.
Unlock Deck
k this deck
31
When we refer to a score's deviation,we are referring to
A)how far it is from other scores.
B)how far it is from the mean.
C)how close it is to the other scores.
D)how much error occurred in measuring it.
A)how far it is from other scores.
B)how far it is from the mean.
C)how close it is to the other scores.
D)how much error occurred in measuring it.
Unlock Deck
Unlock for access to all 62 flashcards in this deck.
Unlock Deck
k this deck
32
Find the mean of the following data set. 8,7,2,4,4,8,2,4,6,5,7,3,9,4,5,4,7
A)5
B)4
C)5.24
D)7
A)5
B)4
C)5.24
D)7
Unlock Deck
Unlock for access to all 62 flashcards in this deck.
Unlock Deck
k this deck
33
The distribution of weights of men in the American population is not symmetrical.Most weights are bunched together at the lower end of the distribution.As weights increase,there are fewer and fewer men with these weights.How would you describe the relationship between the mean,the median,and the mode in this distribution? (Hint: Drawing a picture of the distribution may be helpful. )
A)mode < median < mean
B)mean < median < mode
C)mean = median = mode
D)median < mode < mean
A)mode < median < mean
B)mean < median < mode
C)mean = median = mode
D)median < mode < mean
Unlock Deck
Unlock for access to all 62 flashcards in this deck.
Unlock Deck
k this deck
34
A score's deviation conveys two pieces of information about the score's location: The number indicates _____,and the sign indicates _____.
A)the score's distance from the mean;whether the score is greater or less than the mean
B)whether the score is greater or less than the mean;the score's distance from the mean
C)the size of the score;whether the score is a good score
D)whether the score is a good score;whether the score is positive or negative
Unlock Deck
Unlock for access to all 62 flashcards in this deck.
Unlock Deck
k this deck
35
For the following order of the measures of centrality,what shape best describes the associated distribution?
A)
B)
C)
D)
A)
B)
C)
D)
Unlock Deck
Unlock for access to all 62 flashcards in this deck.
Unlock Deck
k this deck
36
What happens to the mean of a distribution if every score is divided by 10?
A)Its value is divided by 10.
B)Its value is multiplied by 10.
C)Its value is decreased 10 points.
D)Its value is increased 10 points.
A)Its value is divided by 10.
B)Its value is multiplied by 10.
C)Its value is decreased 10 points.
D)Its value is increased 10 points.
Unlock Deck
Unlock for access to all 62 flashcards in this deck.
Unlock Deck
k this deck
37
In a skewed distribution,the mathematical center is
A)the median,which is the point around which most of the scores tend to be located.
B)the mode,which is the point around which most of the scores tend to be located.
C)the mean,which is not the point around which most of the scores tend to be located.
D)impossible to determine.
A)the median,which is the point around which most of the scores tend to be located.
B)the mode,which is the point around which most of the scores tend to be located.
C)the mean,which is not the point around which most of the scores tend to be located.
D)impossible to determine.
Unlock Deck
Unlock for access to all 62 flashcards in this deck.
Unlock Deck
k this deck
38
Which measure of central tendency is appropriate if the shape of the distribution is symmetrical and the measurement scale is interval or ratio?
A)the mode
B)the median
C)the mean
D)the deviation
A)the mode
B)the median
C)the mean
D)the deviation
Unlock Deck
Unlock for access to all 62 flashcards in this deck.
Unlock Deck
k this deck
39
With respect to a graph of a frequency distribution,a positive deviation score
A)will be located to the right of the mean.
B)will be located to the left of the mean.
C)cannot be found.
D)indicates the raw score's location relative to the median.
A)will be located to the right of the mean.
B)will be located to the left of the mean.
C)cannot be found.
D)indicates the raw score's location relative to the median.
Unlock Deck
Unlock for access to all 62 flashcards in this deck.
Unlock Deck
k this deck
40
When a distribution's mode > median > mean,it is said to be
A)positively skewed.
B)negatively skewed.
C)symmetrical.
D)bimodal.
A)positively skewed.
B)negatively skewed.
C)symmetrical.
D)bimodal.
Unlock Deck
Unlock for access to all 62 flashcards in this deck.
Unlock Deck
k this deck
41
When it is impossible to obtain all the scores in a population,the best estimate of the population mean is the
A)population median.
B)sample mean.
C)sample mode.
D)sample median.
A)population median.
B)sample mean.
C)sample mode.
D)sample median.
Unlock Deck
Unlock for access to all 62 flashcards in this deck.
Unlock Deck
k this deck
42
Five students took a personality test.Their deviation scores were -4,+3,+1,-2,+2.Assuming that these scores form a normal distribution,which deviation(s)represent the score(s)having the highest frequency?
A)-4
B)+3
C)-2 and +2
D)+1
A)-4
B)+3
C)-2 and +2
D)+1
Unlock Deck
Unlock for access to all 62 flashcards in this deck.
Unlock Deck
k this deck
43
Five students took a personality test.Their deviation scores were -4,+3,+1,-2,+2.Assuming that these scores form a normal distribution,which deviation represents the highest raw score?
A)-4
B)+3
C)+2
D)+1
A)-4
B)+3
C)+2
D)+1
Unlock Deck
Unlock for access to all 62 flashcards in this deck.
Unlock Deck
k this deck
44
The population mean is estimated by
A)calculating the mean of as many scores as we can get from the population.
B)calculating the mean of a random sample drawn from the population.
C)calculating the mean of a sample and then transforming it to reflect the size of the population.
D)calculating all measures of central tendency for a random sample drawn from the population.
Unlock Deck
Unlock for access to all 62 flashcards in this deck.
Unlock Deck
k this deck
45
When deciding which type of measure of central tendency is appropriate,we consider the scale of measurement used to measure the
A)variability of the distribution.
B)mean.
C)independent variable.
D)dependent variable.
A)variability of the distribution.
B)mean.
C)independent variable.
D)dependent variable.
Unlock Deck
Unlock for access to all 62 flashcards in this deck.
Unlock Deck
k this deck
46
The equipment failed to record the reaction time for one trial in an experiment.The reaction times (in milliseconds)for the other trials were 505,630,490,650,and 560.What is the best guess for the missing value?
A)490.00
B)560
C)567.00
D)568.75
A)490.00
B)560
C)567.00
D)568.75
Unlock Deck
Unlock for access to all 62 flashcards in this deck.
Unlock Deck
k this deck
47
For the following set of scores,what is (are) ?
7,8,10,10,11,12,13,13,15
A)4,3,2,1,0,1,-1,-2,-2,-4
B)-4,-3,-1,-1,0,1,2,2,4
C)4,3,1,1,0,1,2,2,4
D)0
?7,8,10,10,11,12,13,13,15
A)4,3,2,1,0,1,-1,-2,-2,-4
B)-4,-3,-1,-1,0,1,2,2,4
C)4,3,1,1,0,1,2,2,4
D)0
Unlock Deck
Unlock for access to all 62 flashcards in this deck.
Unlock Deck
k this deck
48
When we graph results from an experiment where the independent variable is on a nominal scale,which type of graph is appropriate
A)line graph
B)histogram
C)normal curve
D)bar graph
A)line graph
B)histogram
C)normal curve
D)bar graph
Unlock Deck
Unlock for access to all 62 flashcards in this deck.
Unlock Deck
k this deck
49
µ is the symbol for the
A)population median.
B)population mode.
C)population mean.
D)sample mean.
A)population median.
B)population mode.
C)population mean.
D)sample mean.
Unlock Deck
Unlock for access to all 62 flashcards in this deck.
Unlock Deck
k this deck
50
When the mean is used to predict scores,a deviation indicates
A)the sample is representative of the population.
B)the difference between the we predict and the score an individual actually gets.
C)the sum of all the deviations.
D)the individual's observed score.
indicatesA)the sample is representative of the population.
B)the difference between the
we predict and the score an individual actually gets.C)the sum of all the deviations.
D)the individual's observed score.
Unlock Deck
Unlock for access to all 62 flashcards in this deck.
Unlock Deck
k this deck
51
When we graph the results of an experiment,the Y axis indicates the
A)measure of central tendency we have used for the dependent variable.
B)raw score values for each subject on the dependent variable.
C)raw score values for each subject on the independent variable.
D)levels of the independent variable.
A)measure of central tendency we have used for the dependent variable.
B)raw score values for each subject on the dependent variable.
C)raw score values for each subject on the independent variable.
D)levels of the independent variable.
Unlock Deck
Unlock for access to all 62 flashcards in this deck.
Unlock Deck
k this deck
52
In a graph of the relationship between the level of noise in an environment and the number of errors a person makes,the _____ is on the X axis and the _____ is on the Y axis.
A)mean number of errors;frequency of errors
B)level of noise;mean number of errors
C)level of noise;frequency of noise
D)mean number of errors;level of noise
A)mean number of errors;frequency of errors
B)level of noise;mean number of errors
C)level of noise;frequency of noise
D)mean number of errors;level of noise
Unlock Deck
Unlock for access to all 62 flashcards in this deck.
Unlock Deck
k this deck
53
On any graph,a horizontal line of data points indicates that
A)the Y scores are changing as the X scores change,and there is a relationship present.
B)the Y scores are not changing as the X scores change,and there is no relationship present.
C)the independent and dependent variables have been placed on the wrong axes and should be reversed.
D)every score is occurring with a different frequency.
Unlock Deck
Unlock for access to all 62 flashcards in this deck.
Unlock Deck
k this deck
54
The best predictor of an individual score in a sample of scores is the
A)sum of the deviations of the scores from the mean.
B)score minus the mean.
C)mean of the sample of scores.
D)total error in the sample of scores.
A)sum of the deviations of the scores from the mean.
B)score minus the mean.
C)mean of the sample of scores.
D)total error in the sample of scores.
Unlock Deck
Unlock for access to all 62 flashcards in this deck.
Unlock Deck
k this deck
55
When deciding which type of graph (bar,line,histogram,etc. )is appropriate,we consider the characteristics of the
A)variability of the distribution.
B)mean.
C)independent variable.
D)dependent variable.
A)variability of the distribution.
B)mean.
C)independent variable.
D)dependent variable.
Unlock Deck
Unlock for access to all 62 flashcards in this deck.
Unlock Deck
k this deck
56
Based on the following results of an experiment,how many errors would a person who drank 4 oz.of alcohol make?
A)4
B)9.2
C)about 10
D)12
A)4
B)9.2
C)about 10
D)12
Unlock Deck
Unlock for access to all 62 flashcards in this deck.
Unlock Deck
k this deck
57
Which of the following graphs does not indicate the presence of a relationship?
A)
B)
C)
D)
A)
B)
C)
D)
Unlock Deck
Unlock for access to all 62 flashcards in this deck.
Unlock Deck
k this deck
58
When using the mean to predict scores,error is represented by
A)the deviation of the median from the mean.
B)a statistic obtained from a nonrandom sample.
C)the deviation of a score from the mean.
D)the differences between raw scores in a sample.
A)the deviation of the median from the mean.
B)a statistic obtained from a nonrandom sample.
C)the deviation of a score from the mean.
D)the differences between raw scores in a sample.
Unlock Deck
Unlock for access to all 62 flashcards in this deck.
Unlock Deck
k this deck
59
Five students took a personality test.Their deviation scores were -4,+3,+1,-2,+2.Assuming that these scores form a normal distribution,which of the following orders represents their ranking in terms of frequency,from highest to lowest?
A)+1,+2 and -2,+3,-4
B)-4,+3,+2 and -2,+1
C)-4,-2,+1,+2,+3
D)+3,+2,+1,-2,-4
A)+1,+2 and -2,+3,-4
B)-4,+3,+2 and -2,+1
C)-4,-2,+1,+2,+3
D)+3,+2,+1,-2,-4
Unlock Deck
Unlock for access to all 62 flashcards in this deck.
Unlock Deck
k this deck
60
When we graph results from an experiment,a line graph is appropriate when
A)the independent variable is interval or ratio.
B)the independent variable is nominal or ordinal.
C)the dependent variable is nominal or ordinal.
D)the dependent variable is interval or ratio.
A)the independent variable is interval or ratio.
B)the independent variable is nominal or ordinal.
C)the dependent variable is nominal or ordinal.
D)the dependent variable is interval or ratio.
Unlock Deck
Unlock for access to all 62 flashcards in this deck.
Unlock Deck
k this deck
61
An experimenter investigated the ability to concentrate as a function of eye color.Eye color was classified as having either blue eyes,brown eyes,or other eye color.Which type of graph should the experimenter use to display the results?
A)X and Y
B)histogram
C)bar
D)line
A)X and Y
B)histogram
C)bar
D)line
Unlock Deck
Unlock for access to all 62 flashcards in this deck.
Unlock Deck
k this deck
62
A researcher conducts a study to investigate the influence of the amount of noise in the environment on the number of errors a person makes.The following means were obtained.What conclusion should be drawn from this experiment?
A)Apparently,there is no relationship between noise level and number of errors.
B)Apparently,there is a relationship: As the number of errors increases,the noise level also increases from around 7 to around 11 to around 14.
C)Apparently,there is a relationship: As the number of errors increases,the noise level also increases from low to medium to high.
D)Apparently there is a relationship: As the noise level increases,the number of errors also increases from around 7 to around 11 to around 14.
Unlock Deck
Unlock for access to all 62 flashcards in this deck.
Unlock Deck
k this deck
Unlock Deck
Unlock for access to all 62 flashcards in this deck.


