Deck 3: Frequency Distributions and Percentiles
Full screen (f)
Question
Question
Question
What is the most frequently occurring score in the following frequency distribution? 
A)5
B)11
C)15
D)65
A)5
B)11
C)15
D)65
Question
Question
Using the frequency distribution below,what is the total frequency of the scores 6 and 7? 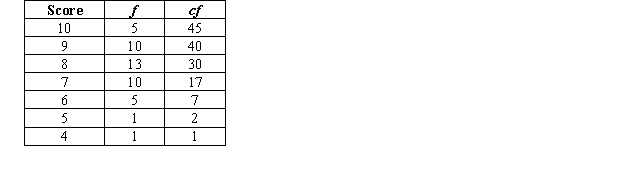
A)0.33
B)13
C)15
D)17
A)0.33
B)13
C)15
D)17
Question
Question
Question
Question
Question
Question
Question
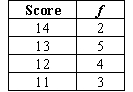
In a frequency polygon constructed from the frequency distribution what two scores would be included with a plotted value of zero?
A) 10 and 11
B) 10.5 and 14.5
C) 10 and 15
D) 15 and 16
A) 10 and 11
B) 10.5 and 14.5
C) 10 and 15
D) 15 and 16
Question
Question
Question
Question
Question
Question
Question
What is the N for the following frequency distribution? 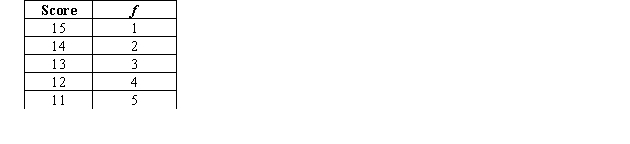
A)5
B)10
C)15
D)65
A)5
B)10
C)15
D)65
Question
Question
In a cumulative frequency distribution created from the following simple frequency distribution,the score "5" would have a cumulative frequency of 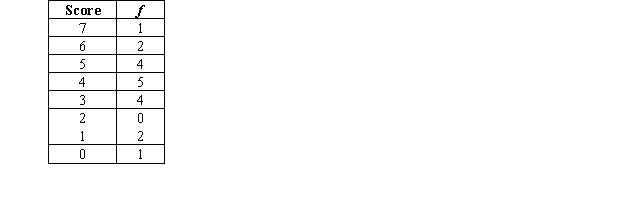
A)4
B)7
C)16
D)20
A)4
B)7
C)16
D)20
Question
Question
What is the relative frequency for the score of 14 in the following simple frequency distribution? 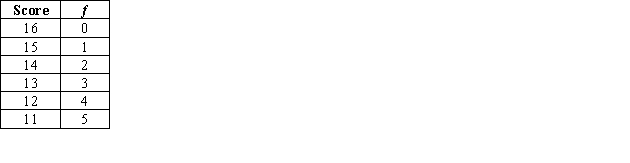
A)0.12
B)0.13
C)0.16
D)0.20
A)0.12
B)0.13
C)0.16
D)0.20
Question
Question
Question
Question
Question
Question
In the following frequency distribution table,what is the error? 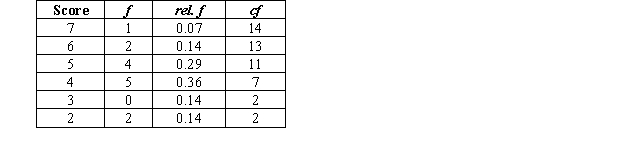
A)The frequency of the score of 3 is incorrect.
B)The rel f for the score of 3 is incorrect.
C)The cf for the score of 3 is incorrect.
D)There are no errors.
A)The frequency of the score of 3 is incorrect.
B)The rel f for the score of 3 is incorrect.
C)The cf for the score of 3 is incorrect.
D)There are no errors.
Question
Question
What is the relative frequency for the score of 12 in the following simple frequency distribution? 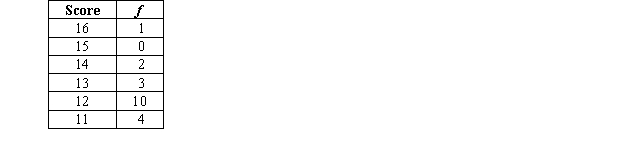
A)0.15
B)0.50
C)0.60
D)0.40
A)0.15
B)0.50
C)0.60
D)0.40
Question
Question
Question
Question
Question
Question
Question
Question
Question
In the following frequency distribution table,what is the error? 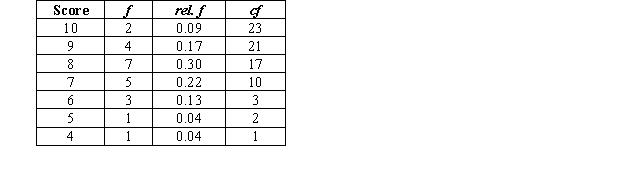
A)The frequency of the score of 8 is incorrect.
B)The rel f for the score of 6 is incorrect.
C)The cf for the score of 6 is incorrect.
D)There are no errors.
A)The frequency of the score of 8 is incorrect.
B)The rel f for the score of 6 is incorrect.
C)The cf for the score of 6 is incorrect.
D)There are no errors.
Question
Question
Question
In a cumulative frequency distribution created from the following simple frequency distribution,the score "7" would have a cumulative frequency equal to 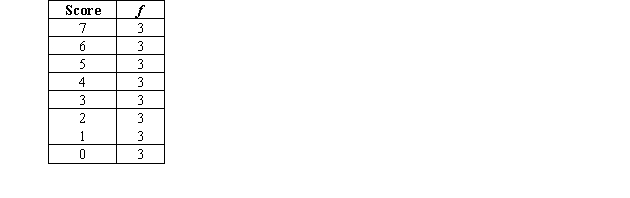
A)3
B)28
C)84
D)N
A)3
B)28
C)84
D)N
Question
Question
Question
Question
What is the cumulative frequency for the score "7" in the following distribution? 
A)5
B)10
C)18
D)0.22
A)5
B)10
C)18
D)0.22
Question

Unlock Deck
Sign up to unlock the cards in this deck!
Unlock Deck
Unlock Deck
1/48
Play
Full screen (f)
Deck 3: Frequency Distributions and Percentiles
1
One benefit to using a frequency distribution table or graph is that it makes it easier to
A)see the raw scores.
B)examine the relationship between scores on two variables.
C)see what scores occurred and how often they occurred.
D)determine the sample size.
A)see the raw scores.
B)examine the relationship between scores on two variables.
C)see what scores occurred and how often they occurred.
D)determine the sample size.
see what scores occurred and how often they occurred.
2
In a normal distribution,the low-frequency,extreme scores located on the far left and far right of the distribution are called the
A)scores.
B)peak.
C)tails.
D)curls.
A)scores.
B)peak.
C)tails.
D)curls.
tails.
3
What is the most frequently occurring score in the following frequency distribution?
A)5
B)11
C)15
D)65
A)5
B)11
C)15
D)65
11
4
In a simple frequency distribution constructed from the data 9,8,8,7,7,7,5,5,4,4,4,4,3,2,2,1,0,0,the score "7" would have an f of
A)1
B)2
C)3
D)4
A)1
B)2
C)3
D)4
Unlock Deck
Unlock for access to all 48 flashcards in this deck.
Unlock Deck
k this deck
5
Using the frequency distribution below,what is the total frequency of the scores 6 and 7?
A)0.33
B)13
C)15
D)17
A)0.33
B)13
C)15
D)17
Unlock Deck
Unlock for access to all 48 flashcards in this deck.
Unlock Deck
k this deck
6
The distinguishing characteristic of the frequency polygon is that
A)the bars are shaded in.
B)the graph is created by connecting the dots with straight lines.
C)the graph does not center the bars over the scores on the X axis.
D)the graph centers the bars over the scores on the X axis.
A)the bars are shaded in.
B)the graph is created by connecting the dots with straight lines.
C)the graph does not center the bars over the scores on the X axis.
D)the graph centers the bars over the scores on the X axis.
Unlock Deck
Unlock for access to all 48 flashcards in this deck.
Unlock Deck
k this deck
7
In statistical notation f stands for the
A)number of times a given score occurs in a sample.
B)total quantity numbers in a set of numbers.
C)relative frequency of a given score.
D)cumulative frequency of a given score.
A)number of times a given score occurs in a sample.
B)total quantity numbers in a set of numbers.
C)relative frequency of a given score.
D)cumulative frequency of a given score.
Unlock Deck
Unlock for access to all 48 flashcards in this deck.
Unlock Deck
k this deck
8
For the following data what values should be in the Score column of the frequency distribution table? 8,8 8,7,5,5,5,5,4,4,3,3,3,2,1,1,1,1,1
A)9,8,7,6,5,4,3,2,1,0
B)8,7,5,4,3,2,1
C)8,7,6,5,4,3,2,1
D)3,1,0,4,2,3,1,5
A)9,8,7,6,5,4,3,2,1,0
B)8,7,5,4,3,2,1
C)8,7,6,5,4,3,2,1
D)3,1,0,4,2,3,1,5
Unlock Deck
Unlock for access to all 48 flashcards in this deck.
Unlock Deck
k this deck
9
Which graphing techniques are appropriate for interval and ratio data?
A)histograms and frequency polygons
B)bar graphs and frequency polygons
C)bar graphs and histograms
D)bar graphs,histograms,and frequency polygons
A)histograms and frequency polygons
B)bar graphs and frequency polygons
C)bar graphs and histograms
D)bar graphs,histograms,and frequency polygons
Unlock Deck
Unlock for access to all 48 flashcards in this deck.
Unlock Deck
k this deck
10
A distribution that is symmetrical,has as its middle score the score with the highest frequency,and has decreasing frequencies as scores are further from the middle score is called a(n)_____ distribution.
A)bimodal
B)overlapping
C)skewed
D)normal
A)bimodal
B)overlapping
C)skewed
D)normal
Unlock Deck
Unlock for access to all 48 flashcards in this deck.
Unlock Deck
k this deck
11
In statistical notation N stands for the
A)number of times a given score occurs in a sample.
B)total number of scores in a set of data.
C)relative frequency of a particular score.
D)cumulative frequency of a particular score.
A)number of times a given score occurs in a sample.
B)total number of scores in a set of data.
C)relative frequency of a particular score.
D)cumulative frequency of a particular score.
Unlock Deck
Unlock for access to all 48 flashcards in this deck.
Unlock Deck
k this deck
12
In a frequency polygon constructed from the frequency distribution what two scores would be included with a plotted value of zero?
A) 10 and 11
B) 10.5 and 14.5
C) 10 and 15
D) 15 and 16
A) 10 and 11
B) 10.5 and 14.5
C) 10 and 15
D) 15 and 16
Unlock Deck
Unlock for access to all 48 flashcards in this deck.
Unlock Deck
k this deck
13
A graph of a frequency distribution shows the frequencies on the
A)X axis.
B)Y axis.
C)top of the graph.
D)bottom of the graph.
A)X axis.
B)Y axis.
C)top of the graph.
D)bottom of the graph.
Unlock Deck
Unlock for access to all 48 flashcards in this deck.
Unlock Deck
k this deck
14
When graphing the frequencies of response times from an experiment,a _____ graph should be used.
A)bar
B)histogram
C)polygon
D)simple
A)bar
B)histogram
C)polygon
D)simple
Unlock Deck
Unlock for access to all 48 flashcards in this deck.
Unlock Deck
k this deck
15
When graphing the frequencies of males and females in the class,a _____ graph should be used.
A)bar
B)histogram
C)polygon
D)simple
A)bar
B)histogram
C)polygon
D)simple
Unlock Deck
Unlock for access to all 48 flashcards in this deck.
Unlock Deck
k this deck
16
In terms of skewness,the normal bell-shaped curve is
A)positively skewed.
B)negatively skewed.
C)not skewed at all.
D)rectangular.
A)positively skewed.
B)negatively skewed.
C)not skewed at all.
D)rectangular.
Unlock Deck
Unlock for access to all 48 flashcards in this deck.
Unlock Deck
k this deck
17
The sum of all the individual frequencies always equals
A)N.
B)ƒ.
C)the total number of all the Ns.
D)the sum of all the scores.
A)N.
B)ƒ.
C)the total number of all the Ns.
D)the sum of all the scores.
Unlock Deck
Unlock for access to all 48 flashcards in this deck.
Unlock Deck
k this deck
18
The _____ of a polygon above any score corresponds to that score's _____.
A)X axis;Y axis
B)height;frequency
C)data;height
D)relative frequency;cumulative frequency
A)X axis;Y axis
B)height;frequency
C)data;height
D)relative frequency;cumulative frequency
Unlock Deck
Unlock for access to all 48 flashcards in this deck.
Unlock Deck
k this deck
19
What is the N for the following frequency distribution?
A)5
B)10
C)15
D)65
A)5
B)10
C)15
D)65
Unlock Deck
Unlock for access to all 48 flashcards in this deck.
Unlock Deck
k this deck
20
A graph of a frequency distribution shows the scores on the
A)X axis.
B)Y axis.
C)top of the graph.
D)side of the graph.
A)X axis.
B)Y axis.
C)top of the graph.
D)side of the graph.
Unlock Deck
Unlock for access to all 48 flashcards in this deck.
Unlock Deck
k this deck
21
In a cumulative frequency distribution created from the following simple frequency distribution,the score "5" would have a cumulative frequency of
A)4
B)7
C)16
D)20
A)4
B)7
C)16
D)20
Unlock Deck
Unlock for access to all 48 flashcards in this deck.
Unlock Deck
k this deck
22
In a normal distribution,if 5% of the scores are greater than 80,what percentage of the scores are between the mean and 80?
A)15%
B)25%
C)35%
D)45%
A)15%
B)25%
C)35%
D)45%
Unlock Deck
Unlock for access to all 48 flashcards in this deck.
Unlock Deck
k this deck
23
What is the relative frequency for the score of 14 in the following simple frequency distribution?
A)0.12
B)0.13
C)0.16
D)0.20
A)0.12
B)0.13
C)0.16
D)0.20
Unlock Deck
Unlock for access to all 48 flashcards in this deck.
Unlock Deck
k this deck
24
The percentile is defined as the _____ of all scores in the data that are at or _____ a certain score.
A)number;below
B)number;above
C)percent;above
D)percent;below
A)number;below
B)number;above
C)percent;above
D)percent;below
Unlock Deck
Unlock for access to all 48 flashcards in this deck.
Unlock Deck
k this deck
25
The cf for the highest score in a distribution should equal
A)N.
B)its percentile rank.
C)ƒ
D)the highest score.
A)N.
B)its percentile rank.
C)ƒ
D)the highest score.
Unlock Deck
Unlock for access to all 48 flashcards in this deck.
Unlock Deck
k this deck
26
If the number of hot lunches sold at school this week was 1,350 and the relative frequency on Friday was 0.22,how many lunches were sold on Friday?
A)297
B)342
C)345
D)388
A)297
B)342
C)345
D)388
Unlock Deck
Unlock for access to all 48 flashcards in this deck.
Unlock Deck
k this deck
27
In a normal distribution with a mean of 30 what percentage of the scores would be above the mean?
A)0%
B)25%
C)50%
D)75%
A)0%
B)25%
C)50%
D)75%
Unlock Deck
Unlock for access to all 48 flashcards in this deck.
Unlock Deck
k this deck
28
An advantage of relative frequency over simple frequency is that
A)simple frequency is more complicated than relative frequency.
B)simple frequency is often easier to interpret than relative frequency.
C)simple frequency provides the proportions of different scores.
D)relative frequency is often easier to interpret than simple frequency.
A)simple frequency is more complicated than relative frequency.
B)simple frequency is often easier to interpret than relative frequency.
C)simple frequency provides the proportions of different scores.
D)relative frequency is often easier to interpret than simple frequency.
Unlock Deck
Unlock for access to all 48 flashcards in this deck.
Unlock Deck
k this deck
29
In the following frequency distribution table,what is the error?
A)The frequency of the score of 3 is incorrect.
B)The rel f for the score of 3 is incorrect.
C)The cf for the score of 3 is incorrect.
D)There are no errors.
A)The frequency of the score of 3 is incorrect.
B)The rel f for the score of 3 is incorrect.
C)The cf for the score of 3 is incorrect.
D)There are no errors.
Unlock Deck
Unlock for access to all 48 flashcards in this deck.
Unlock Deck
k this deck
30
The distribution of weights of newborn infants in the American population is not symmetrical.Most weights are bunched together towards the upper end of the distribution.As weights decrease,there are fewer and fewer newborns with these weights.The shape of the graph produced by this distribution would be (Hint: Drawing a picture of the distribution may be helpful. )
A)a normal bell-shaped curve.
B)negatively skewed.
C)positively skewed.
D)mesokurtic.
A)a normal bell-shaped curve.
B)negatively skewed.
C)positively skewed.
D)mesokurtic.
Unlock Deck
Unlock for access to all 48 flashcards in this deck.
Unlock Deck
k this deck
31
What is the relative frequency for the score of 12 in the following simple frequency distribution?
A)0.15
B)0.50
C)0.60
D)0.40
A)0.15
B)0.50
C)0.60
D)0.40
Unlock Deck
Unlock for access to all 48 flashcards in this deck.
Unlock Deck
k this deck
32
In a normal curve,the proportion of the area under the curve between two scores represents
A)the cumulative frequency of the lower score.
B)the cumulative relative frequency of the lower score.
C)the relative frequency of all scores between the two scores.
D)the relative frequency of all scores below the upper score.
A)the cumulative frequency of the lower score.
B)the cumulative relative frequency of the lower score.
C)the relative frequency of all scores between the two scores.
D)the relative frequency of all scores below the upper score.
Unlock Deck
Unlock for access to all 48 flashcards in this deck.
Unlock Deck
k this deck
33
Relative frequency is defined as the
A)number of times a given score occurs in a sample.
B)proportion of the N that is made up by the score's simple frequency.
C)frequency of all scores at or below a score.
D)total number of scores divided by the frequency of a given score.
A)number of times a given score occurs in a sample.
B)proportion of the N that is made up by the score's simple frequency.
C)frequency of all scores at or below a score.
D)total number of scores divided by the frequency of a given score.
Unlock Deck
Unlock for access to all 48 flashcards in this deck.
Unlock Deck
k this deck
34
The distribution of salaries in the American population is not symmetrical.Most salaries are bunched together at the lower end of the distribution.As salaries increase,there are fewer and fewer people with these salaries.The shape of the graph produced by this distribution would be (Hint: Drawing a picture of the distribution may be helpful. )
A)a normal bell-shaped curve.
B)negatively skewed.
C)positively skewed.
D)mesokurtic.
A)a normal bell-shaped curve.
B)negatively skewed.
C)positively skewed.
D)mesokurtic.
Unlock Deck
Unlock for access to all 48 flashcards in this deck.
Unlock Deck
k this deck
35
In a normal distribution,if 35% of the scores are between the score of 40 and the mean,what percentage of the scores are below 40?
A)15%
B)25%
C)35%
D)45%
A)15%
B)25%
C)35%
D)45%
Unlock Deck
Unlock for access to all 48 flashcards in this deck.
Unlock Deck
k this deck
36
The distinguishing characteristic of an idealized bimodal distribution is that
A)all the scores are the same.
B)all the frequencies are the same.
C)two scores have the same and the highest frequency.
D)it is always symmetrical.
A)all the scores are the same.
B)all the frequencies are the same.
C)two scores have the same and the highest frequency.
D)it is always symmetrical.
Unlock Deck
Unlock for access to all 48 flashcards in this deck.
Unlock Deck
k this deck
37
An advantage of percentiles over cumulative frequencies is that
A)percentiles are often easier to interpret than cumulative frequencies.
B)cumulative frequencies are often easier to interpret than percentiles.
C)percentiles provide the proportion of scores at or below a score,whereas cumulative frequencies provide N.
D)cumulative frequencies are more complicated than relative frequencies.
Unlock Deck
Unlock for access to all 48 flashcards in this deck.
Unlock Deck
k this deck
38
To obtain the relative frequency,we would
A)count the total number of scores.
B)divide the frequency for a score by the total number of scores.
C)divide the total number of scores by the frequency for a score.
D)add the simple frequencies below a score to the score's simple frequency.
A)count the total number of scores.
B)divide the frequency for a score by the total number of scores.
C)divide the total number of scores by the frequency for a score.
D)add the simple frequencies below a score to the score's simple frequency.
Unlock Deck
Unlock for access to all 48 flashcards in this deck.
Unlock Deck
k this deck
39
The distinguishing characteristic of a rectangular distribution is that
A)all the scores are the same.
B)all the frequencies are the same.
C)two scores have the same and the highest frequency.
D)it has a high peak in the middle.
A)all the scores are the same.
B)all the frequencies are the same.
C)two scores have the same and the highest frequency.
D)it has a high peak in the middle.
Unlock Deck
Unlock for access to all 48 flashcards in this deck.
Unlock Deck
k this deck
40
In the following frequency distribution table,what is the error?
A)The frequency of the score of 8 is incorrect.
B)The rel f for the score of 6 is incorrect.
C)The cf for the score of 6 is incorrect.
D)There are no errors.
A)The frequency of the score of 8 is incorrect.
B)The rel f for the score of 6 is incorrect.
C)The cf for the score of 6 is incorrect.
D)There are no errors.
Unlock Deck
Unlock for access to all 48 flashcards in this deck.
Unlock Deck
k this deck
41
A grouped frequency distribution is used when
A)there are too many different scores to produce an efficient simple frequency table.
B)there are too many scores to produce an efficient simple frequency table.
C)one wants more detailed information about frequencies than one can get from a simple frequency table.
D)there are about 10 rows in a simple frequency table.
Unlock Deck
Unlock for access to all 48 flashcards in this deck.
Unlock Deck
k this deck
42
In a simple frequency distribution constructed from the data 16,16,17,14,19,19,20,20,21,21,16,17,14,the score "16" would have a cumulative frequency of
A)3
B)5
C)13
D)48
A)3
B)5
C)13
D)48
Unlock Deck
Unlock for access to all 48 flashcards in this deck.
Unlock Deck
k this deck
43
In a cumulative frequency distribution created from the following simple frequency distribution,the score "7" would have a cumulative frequency equal to
A)3
B)28
C)84
D)N
A)3
B)28
C)84
D)N
Unlock Deck
Unlock for access to all 48 flashcards in this deck.
Unlock Deck
k this deck
44
In a grouped frequency distribution different scores are combined to form small groups
A)according to their frequencies.
B)according to their size.
C)but the f,rel.f,or cf is still reported for each score.
D)and the total f,rel.f,or cf is reported for each group.
A)according to their frequencies.
B)according to their size.
C)but the f,rel.f,or cf is still reported for each score.
D)and the total f,rel.f,or cf is reported for each group.
Unlock Deck
Unlock for access to all 48 flashcards in this deck.
Unlock Deck
k this deck
45
On a national qualifying exam,one student had a raw score of 85,and another student had percentile of 85.Which is better,a raw score of 85 or a percentile of 85?
A)the raw score of 85
B)the percentile of 85
C)they are equally good
D)you can not tell
A)the raw score of 85
B)the percentile of 85
C)they are equally good
D)you can not tell
Unlock Deck
Unlock for access to all 48 flashcards in this deck.
Unlock Deck
k this deck
46
When you begin working with a new data set,you should
A)know exactly which procedures you intend to use.
B)expect that each of the procedures discussed will give you exactly the same information.
C)be willing to explore your data using different procedures.
D)conduct every procedure every time.
A)know exactly which procedures you intend to use.
B)expect that each of the procedures discussed will give you exactly the same information.
C)be willing to explore your data using different procedures.
D)conduct every procedure every time.
Unlock Deck
Unlock for access to all 48 flashcards in this deck.
Unlock Deck
k this deck
47
What is the cumulative frequency for the score "7" in the following distribution?
A)5
B)10
C)18
D)0.22
A)5
B)10
C)18
D)0.22
Unlock Deck
Unlock for access to all 48 flashcards in this deck.
Unlock Deck
k this deck
48
The proportion of area under the normal curve that is directly above a score is the _____ of the score.The percentage of the normal curve to the left of a score is the _____ of the score.
A)relative frequency;percentile
B)percentile;relative frequency
C)simple frequency;cumulative frequency
D)cumulative frequency;relative frequency
A)relative frequency;percentile
B)percentile;relative frequency
C)simple frequency;cumulative frequency
D)cumulative frequency;relative frequency
Unlock Deck
Unlock for access to all 48 flashcards in this deck.
Unlock Deck
k this deck
Unlock Deck
Unlock for access to all 48 flashcards in this deck.


