Deck 15: Chi Square and Other Nonparametric Procedures
Full screen (f)
Question
In the context of  ,expected frequency is the frequency we
A)expect in a category if the sample data represent the distribution of frequencies in the population described by .
.
B)observe in a category of sample data.
C)expect in a category if the sample data represent the distribution of frequencies in the population described by .
.
D)expect in a category of sample data if the experiment is repeated.
,expected frequency is the frequency weA)expect in a category if the sample data represent the distribution of frequencies in the population described by
.B)observe in a category of sample data.
C)expect in a category if the sample data represent the distribution of frequencies in the population described by
.D)expect in a category of sample data if the experiment is repeated.
Question
Which of the following violates the assumptions of the one-way  ?
?
A)The independent variable is a categorical or nominal variable.
B)Subjects may be measured in more than one category.
C)The computations are based on the responses of all subjects in the study.
D)The in any category is equal to 5 or more.
?A)The independent variable is a categorical or nominal variable.
B)Subjects may be measured in more than one category.
C)The computations are based on the responses of all subjects in the study.
D)The
in any category is equal to 5 or more. Question
A soft drink company claims that 3 out of 4 people prefer the taste of their cola (Brand A)over their competitor (Brand B).You conduct a taste test and find that 63 people indicated they preferred Brand A.The remaining 38 people said they preferred Brand B.For a one-way chi-square test,what is  ?
?
A)2.25
B)6.76
C)9.01
D)11.34
?A)2.25
B)6.76
C)9.01
D)11.34
Question
Question
The null hypothesis in the  test for goodness of fit is
A)the data fit the expected frequencies.
B)the data do not fit the expected frequencies.
C)the variables are independent.
D)the variables are dependent.
test for goodness of fit isA)the data fit the expected frequencies.
B)the data do not fit the expected frequencies.
C)the variables are independent.
D)the variables are dependent.
Question
Assume that you have conducted a one-way  in which the
  is that the frequencies in the categories are equal.If the
  was not significant,the appropriate conclusion is
A)other models of need to be tested.
B)we expect that the population of interest is distributed among the categories to the same degree as the sample.
C)there is insufficient evidence one way or the other regarding how the population of interest is distributed among the categories.
D)the population of interest is distributed equally among the categories.
in which the is that the frequencies in the categories are equal.If the was not significant,the appropriate conclusion isA)other models of
need to be tested.B)we expect that the population of interest is distributed among the categories to the same degree as the sample.
C)there is insufficient evidence one way or the other regarding how the population of interest is distributed among the categories.
D)the population of interest is distributed equally among the categories.
Question
The larger the  ,
,
A)the less likely our data represent .
.
B)the larger the differences between the expected frequencies.
C)the less likely our data represent .
.
D)the more likely our data represent .
.
,A)the less likely our data represent
.B)the larger the differences between the expected frequencies.
C)the less likely our data represent
.D)the more likely our data represent
. Question
When  is true,
  should be
A)0.0.
B)1.0.
C)the value of the overall N of the experiment.
D)the value of the overall N of the experiment divided by the number of categories in the experiment.
is true, should beA)0.0.
B)1.0.
C)the value of the overall N of the experiment.
D)the value of the overall N of the experiment divided by the number of categories in the experiment.
Question
The  goodness of fit test is so named because it tests
A)how well the sample data match the distribution of frequencies in the population described by .
.
B)how "good" the "fits" the
 .
.
C)how well the sample data match the distribution of frequencies in the population described by .
.
D)how "good" the "fit" is between the model of the distribution of frequencies and .
.
goodness of fit test is so named because it testsA)how well the sample data match the distribution of frequencies in the population described by
.B)how "good" the
"fits" the .C)how well the sample data match the distribution of frequencies in the population described by
.D)how "good" the "fit" is between the model of the distribution of frequencies and
. Question
Question
Question
Question
Suppose you ask 100 people whether they like the taste of beer.Beer companies would like to claim that 55% of the population likes the taste of beer.In testing whether this sample represents such a population,what would the  values be for this study?
A)YES, = 45;NO,
 = 55
= 55
B)YES, = 55;NO,
 = 45
= 45
C)YES, = 55;NO,
 = 55
= 55
D)YES, = 45;NO,
 = 45
= 45
values be for this study?A)YES,
= 45;NO, = 55B)YES,
= 55;NO, = 45C)YES,
= 55;NO, = 55D)YES,
= 45;NO, = 45 Question
The sum of the observed frequencies from all categories must equal
A)the expected frequencies for each category.
B)the frequencies expected in the population.
C) .
.
D)N.
A)the expected frequencies for each category.
B)the frequencies expected in the population.
C)
.D)N.
Question
Question
A significant one-way  indicates the
A)sample data are likely to represent two variables that are independent in the population.
B)sample data are unlikely to represent two variables that are independent in the population.
C)data fit the expected frequencies generated by a model of the population frequencies.
D)data do not represent equal frequencies in all categories in the population.
indicates theA)sample data are likely to represent two variables that are independent in the population.
B)sample data are unlikely to represent two variables that are independent in the population.
C)data fit the expected frequencies generated by a model of the population frequencies.
D)data do not represent equal frequencies in all categories in the population.
Question
The board of trustees of a small college demanded a more diverse student body.Most of the college's minority students came from a large metropolitan area.The admissions staff asked graduates outside this area and outside the state to help with recruiting.In addition,some money was spent on media advertising.To assess the effect of this campaign,the current year's requests for applications were classified as Large Metropolitan Area (565),Rest of State (410),and Out of State (216).An analysis of addresses over previous years showed Large Metropolitan Area,51%;Rest of State,40%;Out of State,9%.What statistic should be used to analyze these data?
A)The for independence
B)The for goodness of fit
C)The Kruskal-Wallis H
D)The Mann-Whitney U
A)The
for independenceB)The
for goodness of fitC)The Kruskal-Wallis H
D)The Mann-Whitney U
Question
The  sampling distribution contains
A)all possible values of when the null hypothesis is true.
B)all possible values of when the null hypothesis is false.
C)all possible observed frequencies for a given number of categories and a given N.
D)all possible expected frequencies for a given number of categories and a given N.
sampling distribution containsA)all possible values of
when the null hypothesis is true.B)all possible values of
when the null hypothesis is false.C)all possible observed frequencies for a given number of categories and a given N.
D)all possible expected frequencies for a given number of categories and a given N.
Question
What is the consequence of violating one of the necessary assumptions of parametric inferential statistics?
A)The is never rejected.
B)The is never retained.
C)The actual probability of making a Type I error is larger than .
D)The actual probability of making a Type I error is smaller than .
A)The
is never rejected.B)The
is never retained.C)The actual probability of making a Type I error is larger than .
D)The actual probability of making a Type I error is smaller than .
Question
Which  tests whether our sample data are likely to represent the distribution of frequencies in the population when
  is true?
A) for independence
B) for goodness-of-fit
C) for homogeneity of variance
D) for differences between independent means
tests whether our sample data are likely to represent the distribution of frequencies in the population when is true?A)
for independenceB)
for goodness-of-fitC)
for homogeneity of varianceD)
for differences between independent means Question
For the following set of data,what are the associated ranks? 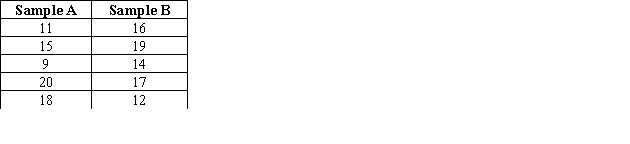
A)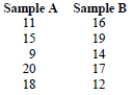
B)
C)
D)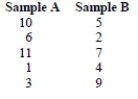
A)
B)
C)
D)
Question
A recent news report indicated that out of 75 people polled,35 men and 10 women had given the president a high approval rating,while 20 men and 10 women had given the president a low approval rating.Using a two-way  test for independence,what is
  ?
?
A)3.00
B)3.33
C)3.58
D)3.72
test for independence,what is ?A)3.00
B)3.33
C)3.58
D)3.72
Question
The null hypothesis in the  test for independence is
A)the data fit the expected frequencies.
B)the data do not fit the expected frequencies.
C)the variables are independent.
D)the variables are dependent.
test for independence isA)the data fit the expected frequencies.
B)the data do not fit the expected frequencies.
C)the variables are independent.
D)the variables are dependent.
Question
A significant two-way  indicates the
A)sample data are likely to represent two variables that are independent in the population.
B)sample data are unlikely to represent two variables that are independent in the population.
C)data fit the expected frequencies generated by a model of the population frequencies.
D)sample data for the two variables show them to be independent.
indicates theA)sample data are likely to represent two variables that are independent in the population.
B)sample data are unlikely to represent two variables that are independent in the population.
C)data fit the expected frequencies generated by a model of the population frequencies.
D)sample data for the two variables show them to be independent.
Question
The TV Design team showed 40 boys and 40 girls prototype shows for two new television programs for children.After they had seen both shows,each child indicated which show he or she liked better.Their choices are shown here.The expected frequencies were 20,20,20,and 20. 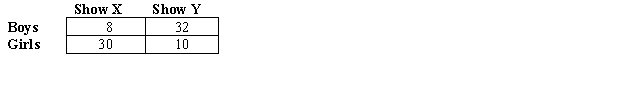
A)
B)
C)
D)
A)
B)
C)
D)
Question
In  procedures,
A)we do not perform post hoc comparisons or compute .
.
B)we perform post hoc comparisons and compute .
.
C)we never have an interaction.
D)all means,not just significant ones,are reported.
procedures,A)we do not perform post hoc comparisons or compute
.B)we perform post hoc comparisons and compute
.C)we never have an interaction.
D)all means,not just significant ones,are reported.
Question
Richard did a study of "Autobiographical Memory of School" for his master's degree thesis.In one part of Richard's study,he had 60 college students write a description of one event from their schooling (any grade,1-12).After obtaining the 60 descriptions,they were classified as shown.The expected frequency was 10 in each cell. 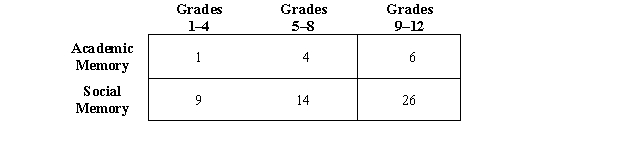
A)
B)
C)
D)
A)
B)
C)
D)
Question
The sum of the observed frequencies for all the rows of a  test for independence must equal
A)the sum of the expected frequencies for all the rows.
B)the total N for the experiment.
C)the sum of the observed frequencies for all the columns.
D)all of the above.
test for independence must equalA)the sum of the expected frequencies for all the rows.
B)the total N for the experiment.
C)the sum of the observed frequencies for all the columns.
D)all of the above.
Question
The two-way  is a test of
A)goodness of fit of observed frequencies to population frequencies.
B)difference between mean ranks in two categories.
C)whether two variables are independent.
D)difference between mean ranks in more than two categories.
is a test ofA)goodness of fit of observed frequencies to population frequencies.
B)difference between mean ranks in two categories.
C)whether two variables are independent.
D)difference between mean ranks in more than two categories.
Question
The alternative hypothesis for the two-way  states
A)the variables are independent.
B)the variables are not correlated.
C)the variables are correlated.
D)using the categories from one variable does not help predict frequencies for the other variable.
statesA)the variables are independent.
B)the variables are not correlated.
C)the variables are correlated.
D)using the categories from one variable does not help predict frequencies for the other variable.
Question
It is legitimate to compute  only when there is a significant
A)2 *3 for independence.
B)2 * 2 for independence.
C)2 * 2 for goodness of fit.
D) for goodness of fit.
only when there is a significantA)2 *3
for independence.B)2 * 2
for independence.C)2 * 2
for goodness of fit.D)
for goodness of fit. Question
The square of the contingency coefficient,  ,is interpreted the same way as
A) .
.
B) .
.
C) .
.
D)all of these.
,is interpreted the same way asA)
.B)
.C)
.D)all of these.
Question
The contingency coefficient,C,is computed when we have a
A)significant 2 * 2 for independence.
B)significant for goodness of fit.
C)significant for independence that is not 2 * 2.
D)nonsignificant for independence that is not 2 * 2.
A)significant 2 * 2
for independence.B)significant
for goodness of fit.C)significant
for independence that is not 2 * 2.D)nonsignificant
for independence that is not 2 * 2. Question
A nonparametric procedure that corresponds to the independent samples t-test is the
A)Mann-Whitney U.
B)Wilcoxon T test.
C)Kruskal-Wallis H.
D)Friedman .
.
A)Mann-Whitney U.
B)Wilcoxon T test.
C)Kruskal-Wallis H.
D)Friedman
. Question
Question
Which of the following is actually a test of whether there is an interaction between two variables?
A) for goodness of fit
B) for independence
C) for homogeneity of variance
D) for differences between independent means
A)
for goodness of fitB)
for independenceC)
for homogeneity of varianceD)
for differences between independent means Question
 is analogous to and can be interpreted in the same way as
A)
 .
.B)
 .
.C)
 .
.D)
 and
and  .
. Question
According to  ,if the observed frequencies do not equal the expected frequencies in each cell of a
  for independence,it is because
A)the variables are not independent.
B)of sampling error.
C)the right variables were not selected for the study.
D)the variables are independent.
,if the observed frequencies do not equal the expected frequencies in each cell of a for independence,it is becauseA)the variables are not independent.
B)of sampling error.
C)the right variables were not selected for the study.
D)the variables are independent.
Question
Suppose you conduct an experiment that has 24 participants who are asked to respond to one of three categories.Your  turns out to be 9.92,which is statistically significant.Which of the following is the correct way to report it?
A) = 9.92;p < 0.05
B) = 9.92;p < 0.05
C) = 9.92;p > 0.05
D) = 9.92;p < 0.05
turns out to be 9.92,which is statistically significant.Which of the following is the correct way to report it?A)
= 9.92;p < 0.05B)
= 9.92;p < 0.05C)
= 9.92;p > 0.05D)
= 9.92;p < 0.05 Question
The phi coefficient, ,is used as a measure of strength of association for a
A)Mann-Whitney U.
B)Kruskal-Wallis H.
C)one-way .
.
D)2 * 2 .
.
A)Mann-Whitney U.
B)Kruskal-Wallis H.
C)one-way
.D)2 * 2
. Question
Patricia has collected data on 30 individuals.She measured the pulse rate of 15 individuals after they had watched a violent film clip.She measured the pulse rate of the other 15 people after they had watched a non-violent film clip.Because she knows her study does not meet the assumptions for a two-tailed t-test,what nonparametric test should she run?
A)Wilcoxon T
B)A two-way
C)A Mann-Whitney U
D)a Friedman
A)Wilcoxon T
B)A two-way
C)A Mann-Whitney U
D)a Friedman
Question
If you wanted to run determine if there is a relationship between participants' commute time to work and their level of hostility and you need to use a nonparametric test,what test should you run?
A)Spearman
B)Wilcoxon T
C)a Friedman
D)Kruskal-Wallis H
A)Spearman
B)Wilcoxon T
C)a Friedman
D)Kruskal-Wallis H
Question
The nonparametric procedure that corresponds to the related samples t-test is the
A)Mann-Whitney U.
B)Wilcoxon T test.
C)Kruskal-Wallis H.
D)Friedman .
.
A)Mann-Whitney U.
B)Wilcoxon T test.
C)Kruskal-Wallis H.
D)Friedman
. Question
James has conducted a study involving a total of 60 participants.These individuals were randomly assigned to one of three different treatment conditions--No Sound,White Noise,or Conversation.Each was then tested on a reading recall task.Because James knows his study does not meet one of the assumptions for a parametric test,what nonparametric test should he run?
A)Mann-Whitney U
B)Spearman
C)a Friedman
D)Kruskal-Wallis H
A)Mann-Whitney U
B)Spearman
C)a Friedman
D)Kruskal-Wallis H
Question
You have treadmill endurance test scores for 14 college students taken just before final exam period and a second set of scores for the same students obtained on the afternoon of the last day of finals.You are pretty sure that the populations these scores are sampled from are highly skewed,and so you plan to test for differences in physical endurance using a nonparametric procedure.Which one should you use?
A)A Wilcoxon T
B)Spearman
C)A Mann-Whitney U
D)A Friedman
A)A Wilcoxon T
B)Spearman
C)A Mann-Whitney U
D)A Friedman
Question
The nonparametric procedure that corresponds to the within-subjects ANOVA is the
A)Mann-Whitney U.
B)Wilcoxon T.
C)Kruskal-Wallis H.
D)Friedman .
.
A)Mann-Whitney U.
B)Wilcoxon T.
C)Kruskal-Wallis H.
D)Friedman
. Question
The nonparametric procedure that corresponds to the between-subjects ANOVA is the
A)Mann-Whitney U.
B)Wilcoxon T.
C)Kruskal-Wallis H.
D)Friedman .
.
A)Mann-Whitney U.
B)Wilcoxon T.
C)Kruskal-Wallis H.
D)Friedman
. Question
In Tanisha's study,each person's respiration rate was tested for baseline (no exercise),after 5 minutes of strenuous exercise,and 5 minutes after strenuous exercise had stopped.Because her study does not meet one of the assumptions for a parametric test,what nonparametric test should she run?
A)Mann-Whitney U
B)Wilcoxon T
C)a Friedman
D)Kruskal-Wallis H
A)Mann-Whitney U
B)Wilcoxon T
C)a Friedman
D)Kruskal-Wallis H
Question

Unlock Deck
Sign up to unlock the cards in this deck!
Unlock Deck
Unlock Deck
1/49
Play
Full screen (f)
Deck 15: Chi Square and Other Nonparametric Procedures
1
In the context of ,expected frequency is the frequency we
A)expect in a category if the sample data represent the distribution of frequencies in the population described by .
B)observe in a category of sample data.
C)expect in a category if the sample data represent the distribution of frequencies in the population described by .
D)expect in a category of sample data if the experiment is repeated.
,expected frequency is the frequency weA)expect in a category if the sample data represent the distribution of frequencies in the population described by
.B)observe in a category of sample data.
C)expect in a category if the sample data represent the distribution of frequencies in the population described by
.D)expect in a category of sample data if the experiment is repeated.
expect in a category if the sample data represent the distribution of frequencies in the population described by .
. 2
Which of the following violates the assumptions of the one-way ?
A)The independent variable is a categorical or nominal variable.
B)Subjects may be measured in more than one category.
C)The computations are based on the responses of all subjects in the study.
D)The in any category is equal to 5 or more.
?A)The independent variable is a categorical or nominal variable.
B)Subjects may be measured in more than one category.
C)The computations are based on the responses of all subjects in the study.
D)The
in any category is equal to 5 or more.Subjects may be measured in more than one category.
3
A soft drink company claims that 3 out of 4 people prefer the taste of their cola (Brand A)over their competitor (Brand B).You conduct a taste test and find that 63 people indicated they preferred Brand A.The remaining 38 people said they preferred Brand B.For a one-way chi-square test,what is ?
A)2.25
B)6.76
C)9.01
D)11.34
?A)2.25
B)6.76
C)9.01
D)11.34
9.01
4
Which of the following statements about nonparametric procedures is false?
A)Nonparametric procedures do not assume that samples come from population distributions.
B)Nonparametric procedures do not assume a normal distribution.
C)Nonparametric procedures do not assume homogeneous variance.
D)The data used with nonparametric procedures may be nominal or ordinal.
A)Nonparametric procedures do not assume that samples come from population distributions.
B)Nonparametric procedures do not assume a normal distribution.
C)Nonparametric procedures do not assume homogeneous variance.
D)The data used with nonparametric procedures may be nominal or ordinal.
Unlock Deck
Unlock for access to all 49 flashcards in this deck.
Unlock Deck
k this deck
5
The null hypothesis in the test for goodness of fit is
A)the data fit the expected frequencies.
B)the data do not fit the expected frequencies.
C)the variables are independent.
D)the variables are dependent.
test for goodness of fit isA)the data fit the expected frequencies.
B)the data do not fit the expected frequencies.
C)the variables are independent.
D)the variables are dependent.
Unlock Deck
Unlock for access to all 49 flashcards in this deck.
Unlock Deck
k this deck
6
Assume that you have conducted a one-way in which the is that the frequencies in the categories are equal.If the was not significant,the appropriate conclusion is
A)other models of need to be tested.
B)we expect that the population of interest is distributed among the categories to the same degree as the sample.
C)there is insufficient evidence one way or the other regarding how the population of interest is distributed among the categories.
D)the population of interest is distributed equally among the categories.
in which the is that the frequencies in the categories are equal.If the was not significant,the appropriate conclusion isA)other models of
need to be tested.B)we expect that the population of interest is distributed among the categories to the same degree as the sample.
C)there is insufficient evidence one way or the other regarding how the population of interest is distributed among the categories.
D)the population of interest is distributed equally among the categories.
Unlock Deck
Unlock for access to all 49 flashcards in this deck.
Unlock Deck
k this deck
7
The larger the ,
A)the less likely our data represent .
B)the larger the differences between the expected frequencies.
C)the less likely our data represent .
D)the more likely our data represent .
,A)the less likely our data represent
.B)the larger the differences between the expected frequencies.
C)the less likely our data represent
.D)the more likely our data represent
. Unlock Deck
Unlock for access to all 49 flashcards in this deck.
Unlock Deck
k this deck
8
When is true, should be
A)0.0.
B)1.0.
C)the value of the overall N of the experiment.
D)the value of the overall N of the experiment divided by the number of categories in the experiment.
is true, should beA)0.0.
B)1.0.
C)the value of the overall N of the experiment.
D)the value of the overall N of the experiment divided by the number of categories in the experiment.
Unlock Deck
Unlock for access to all 49 flashcards in this deck.
Unlock Deck
k this deck
9
The goodness of fit test is so named because it tests
A)how well the sample data match the distribution of frequencies in the population described by .
B)how "good" the "fits" the
.
C)how well the sample data match the distribution of frequencies in the population described by .
D)how "good" the "fit" is between the model of the distribution of frequencies and .
goodness of fit test is so named because it testsA)how well the sample data match the distribution of frequencies in the population described by
.B)how "good" the
"fits" the .C)how well the sample data match the distribution of frequencies in the population described by
.D)how "good" the "fit" is between the model of the distribution of frequencies and
. Unlock Deck
Unlock for access to all 49 flashcards in this deck.
Unlock Deck
k this deck
10
In a one-way chi-square test,the null hypothesis states that if the observed frequencies do not equal the expected frequencies,it is
A)because the data do not meet the assumptions of the test.
B)because the data represent a population distribution other than the expected one.
C)because of design insufficiencies.
D)because of sampling error.
A)because the data do not meet the assumptions of the test.
B)because the data represent a population distribution other than the expected one.
C)because of design insufficiencies.
D)because of sampling error.
Unlock Deck
Unlock for access to all 49 flashcards in this deck.
Unlock Deck
k this deck
11
Nonparametric procedures are usually not our first choice among statistical procedures because
A)the probability of making a Type I error is too high.
B)the probability of making a Type II error is too high.
C)nonparametric procedures are not inferential statistics.
D)they are less powerful than parametric procedures.
A)the probability of making a Type I error is too high.
B)the probability of making a Type II error is too high.
C)nonparametric procedures are not inferential statistics.
D)they are less powerful than parametric procedures.
Unlock Deck
Unlock for access to all 49 flashcards in this deck.
Unlock Deck
k this deck
12
When are nonparametric procedures used instead of parametric procedures?
A)When a more powerful test is needed
B)When our data do not meet the assumptions of parametric procedures
C)When our sample is relatively small
D)When measurement is interval or ratio
A)When a more powerful test is needed
B)When our data do not meet the assumptions of parametric procedures
C)When our sample is relatively small
D)When measurement is interval or ratio
Unlock Deck
Unlock for access to all 49 flashcards in this deck.
Unlock Deck
k this deck
13
Suppose you ask 100 people whether they like the taste of beer.Beer companies would like to claim that 55% of the population likes the taste of beer.In testing whether this sample represents such a population,what would the values be for this study?
A)YES, = 45;NO,
= 55
B)YES, = 55;NO,
= 45
C)YES, = 55;NO,
= 55
D)YES, = 45;NO,
= 45
values be for this study?A)YES,
= 45;NO, = 55B)YES,
= 55;NO, = 45C)YES,
= 55;NO, = 55D)YES,
= 45;NO, = 45 Unlock Deck
Unlock for access to all 49 flashcards in this deck.
Unlock Deck
k this deck
14
The sum of the observed frequencies from all categories must equal
A)the expected frequencies for each category.
B)the frequencies expected in the population.
C) .
D)N.
A)the expected frequencies for each category.
B)the frequencies expected in the population.
C)
.D)N.
Unlock Deck
Unlock for access to all 49 flashcards in this deck.
Unlock Deck
k this deck
15
In a chi-square procedure we test whether,"the frequencies in each category in the sample data
A)change in a consistent fashion."
B)have equal variances."
C)represent specific frequencies in the population."
D)represent the category means in the population."
A)change in a consistent fashion."
B)have equal variances."
C)represent specific frequencies in the population."
D)represent the category means in the population."
Unlock Deck
Unlock for access to all 49 flashcards in this deck.
Unlock Deck
k this deck
16
A significant one-way indicates the
A)sample data are likely to represent two variables that are independent in the population.
B)sample data are unlikely to represent two variables that are independent in the population.
C)data fit the expected frequencies generated by a model of the population frequencies.
D)data do not represent equal frequencies in all categories in the population.
indicates theA)sample data are likely to represent two variables that are independent in the population.
B)sample data are unlikely to represent two variables that are independent in the population.
C)data fit the expected frequencies generated by a model of the population frequencies.
D)data do not represent equal frequencies in all categories in the population.
Unlock Deck
Unlock for access to all 49 flashcards in this deck.
Unlock Deck
k this deck
17
The board of trustees of a small college demanded a more diverse student body.Most of the college's minority students came from a large metropolitan area.The admissions staff asked graduates outside this area and outside the state to help with recruiting.In addition,some money was spent on media advertising.To assess the effect of this campaign,the current year's requests for applications were classified as Large Metropolitan Area (565),Rest of State (410),and Out of State (216).An analysis of addresses over previous years showed Large Metropolitan Area,51%;Rest of State,40%;Out of State,9%.What statistic should be used to analyze these data?
A)The for independence
B)The for goodness of fit
C)The Kruskal-Wallis H
D)The Mann-Whitney U
A)The
for independenceB)The
for goodness of fitC)The Kruskal-Wallis H
D)The Mann-Whitney U
Unlock Deck
Unlock for access to all 49 flashcards in this deck.
Unlock Deck
k this deck
18
The sampling distribution contains
A)all possible values of when the null hypothesis is true.
B)all possible values of when the null hypothesis is false.
C)all possible observed frequencies for a given number of categories and a given N.
D)all possible expected frequencies for a given number of categories and a given N.
sampling distribution containsA)all possible values of
when the null hypothesis is true.B)all possible values of
when the null hypothesis is false.C)all possible observed frequencies for a given number of categories and a given N.
D)all possible expected frequencies for a given number of categories and a given N.
Unlock Deck
Unlock for access to all 49 flashcards in this deck.
Unlock Deck
k this deck
19
What is the consequence of violating one of the necessary assumptions of parametric inferential statistics?
A)The is never rejected.
B)The is never retained.
C)The actual probability of making a Type I error is larger than .
D)The actual probability of making a Type I error is smaller than .
A)The
is never rejected.B)The
is never retained.C)The actual probability of making a Type I error is larger than .
D)The actual probability of making a Type I error is smaller than .
Unlock Deck
Unlock for access to all 49 flashcards in this deck.
Unlock Deck
k this deck
20
Which tests whether our sample data are likely to represent the distribution of frequencies in the population when is true?
A) for independence
B) for goodness-of-fit
C) for homogeneity of variance
D) for differences between independent means
tests whether our sample data are likely to represent the distribution of frequencies in the population when is true?A)
for independenceB)
for goodness-of-fitC)
for homogeneity of varianceD)
for differences between independent means Unlock Deck
Unlock for access to all 49 flashcards in this deck.
Unlock Deck
k this deck
21
For the following set of data,what are the associated ranks?
A)
B)
C)
D)
A)
B)
C)
D)
Unlock Deck
Unlock for access to all 49 flashcards in this deck.
Unlock Deck
k this deck
22
A recent news report indicated that out of 75 people polled,35 men and 10 women had given the president a high approval rating,while 20 men and 10 women had given the president a low approval rating.Using a two-way test for independence,what is ?
A)3.00
B)3.33
C)3.58
D)3.72
test for independence,what is ?A)3.00
B)3.33
C)3.58
D)3.72
Unlock Deck
Unlock for access to all 49 flashcards in this deck.
Unlock Deck
k this deck
23
The null hypothesis in the test for independence is
A)the data fit the expected frequencies.
B)the data do not fit the expected frequencies.
C)the variables are independent.
D)the variables are dependent.
test for independence isA)the data fit the expected frequencies.
B)the data do not fit the expected frequencies.
C)the variables are independent.
D)the variables are dependent.
Unlock Deck
Unlock for access to all 49 flashcards in this deck.
Unlock Deck
k this deck
24
A significant two-way indicates the
A)sample data are likely to represent two variables that are independent in the population.
B)sample data are unlikely to represent two variables that are independent in the population.
C)data fit the expected frequencies generated by a model of the population frequencies.
D)sample data for the two variables show them to be independent.
indicates theA)sample data are likely to represent two variables that are independent in the population.
B)sample data are unlikely to represent two variables that are independent in the population.
C)data fit the expected frequencies generated by a model of the population frequencies.
D)sample data for the two variables show them to be independent.
Unlock Deck
Unlock for access to all 49 flashcards in this deck.
Unlock Deck
k this deck
25
The TV Design team showed 40 boys and 40 girls prototype shows for two new television programs for children.After they had seen both shows,each child indicated which show he or she liked better.Their choices are shown here.The expected frequencies were 20,20,20,and 20.
A)
B)
C)
D)
A)
B)
C)
D)
Unlock Deck
Unlock for access to all 49 flashcards in this deck.
Unlock Deck
k this deck
26
In procedures,
A)we do not perform post hoc comparisons or compute .
B)we perform post hoc comparisons and compute .
C)we never have an interaction.
D)all means,not just significant ones,are reported.
procedures,A)we do not perform post hoc comparisons or compute
.B)we perform post hoc comparisons and compute
.C)we never have an interaction.
D)all means,not just significant ones,are reported.
Unlock Deck
Unlock for access to all 49 flashcards in this deck.
Unlock Deck
k this deck
27
Richard did a study of "Autobiographical Memory of School" for his master's degree thesis.In one part of Richard's study,he had 60 college students write a description of one event from their schooling (any grade,1-12).After obtaining the 60 descriptions,they were classified as shown.The expected frequency was 10 in each cell.
A)
B)
C)
D)
A)
B)
C)
D)
Unlock Deck
Unlock for access to all 49 flashcards in this deck.
Unlock Deck
k this deck
28
The sum of the observed frequencies for all the rows of a test for independence must equal
A)the sum of the expected frequencies for all the rows.
B)the total N for the experiment.
C)the sum of the observed frequencies for all the columns.
D)all of the above.
test for independence must equalA)the sum of the expected frequencies for all the rows.
B)the total N for the experiment.
C)the sum of the observed frequencies for all the columns.
D)all of the above.
Unlock Deck
Unlock for access to all 49 flashcards in this deck.
Unlock Deck
k this deck
29
The two-way is a test of
A)goodness of fit of observed frequencies to population frequencies.
B)difference between mean ranks in two categories.
C)whether two variables are independent.
D)difference between mean ranks in more than two categories.
is a test ofA)goodness of fit of observed frequencies to population frequencies.
B)difference between mean ranks in two categories.
C)whether two variables are independent.
D)difference between mean ranks in more than two categories.
Unlock Deck
Unlock for access to all 49 flashcards in this deck.
Unlock Deck
k this deck
30
The alternative hypothesis for the two-way states
A)the variables are independent.
B)the variables are not correlated.
C)the variables are correlated.
D)using the categories from one variable does not help predict frequencies for the other variable.
statesA)the variables are independent.
B)the variables are not correlated.
C)the variables are correlated.
D)using the categories from one variable does not help predict frequencies for the other variable.
Unlock Deck
Unlock for access to all 49 flashcards in this deck.
Unlock Deck
k this deck
31
It is legitimate to compute only when there is a significant
A)2 *3 for independence.
B)2 * 2 for independence.
C)2 * 2 for goodness of fit.
D) for goodness of fit.
only when there is a significantA)2 *3
for independence.B)2 * 2
for independence.C)2 * 2
for goodness of fit.D)
for goodness of fit. Unlock Deck
Unlock for access to all 49 flashcards in this deck.
Unlock Deck
k this deck
32
The square of the contingency coefficient, ,is interpreted the same way as
A) .
B) .
C) .
D)all of these.
,is interpreted the same way asA)
.B)
.C)
.D)all of these.
Unlock Deck
Unlock for access to all 49 flashcards in this deck.
Unlock Deck
k this deck
33
The contingency coefficient,C,is computed when we have a
A)significant 2 * 2 for independence.
B)significant for goodness of fit.
C)significant for independence that is not 2 * 2.
D)nonsignificant for independence that is not 2 * 2.
A)significant 2 * 2
for independence.B)significant
for goodness of fit.C)significant
for independence that is not 2 * 2.D)nonsignificant
for independence that is not 2 * 2. Unlock Deck
Unlock for access to all 49 flashcards in this deck.
Unlock Deck
k this deck
34
A nonparametric procedure that corresponds to the independent samples t-test is the
A)Mann-Whitney U.
B)Wilcoxon T test.
C)Kruskal-Wallis H.
D)Friedman .
A)Mann-Whitney U.
B)Wilcoxon T test.
C)Kruskal-Wallis H.
D)Friedman
. Unlock Deck
Unlock for access to all 49 flashcards in this deck.
Unlock Deck
k this deck
35
What parametric test is analogous to the two-way chi-square?
A)Two-sample t-test for independent samples
B)Two-sample t-test for related samples
C)Two-way ANOVA
D)There is no analogous parametric test
A)Two-sample t-test for independent samples
B)Two-sample t-test for related samples
C)Two-way ANOVA
D)There is no analogous parametric test
Unlock Deck
Unlock for access to all 49 flashcards in this deck.
Unlock Deck
k this deck
36
Which of the following is actually a test of whether there is an interaction between two variables?
A) for goodness of fit
B) for independence
C) for homogeneity of variance
D) for differences between independent means
A)
for goodness of fitB)
for independenceC)
for homogeneity of varianceD)
for differences between independent means Unlock Deck
Unlock for access to all 49 flashcards in this deck.
Unlock Deck
k this deck
37
is analogous to and can be interpreted in the same way asA)
.B)
.C)
.D)
and . Unlock Deck
Unlock for access to all 49 flashcards in this deck.
Unlock Deck
k this deck
38
According to ,if the observed frequencies do not equal the expected frequencies in each cell of a for independence,it is because
A)the variables are not independent.
B)of sampling error.
C)the right variables were not selected for the study.
D)the variables are independent.
,if the observed frequencies do not equal the expected frequencies in each cell of a for independence,it is becauseA)the variables are not independent.
B)of sampling error.
C)the right variables were not selected for the study.
D)the variables are independent.
Unlock Deck
Unlock for access to all 49 flashcards in this deck.
Unlock Deck
k this deck
39
Suppose you conduct an experiment that has 24 participants who are asked to respond to one of three categories.Your turns out to be 9.92,which is statistically significant.Which of the following is the correct way to report it?
A) = 9.92;p < 0.05
B) = 9.92;p < 0.05
C) = 9.92;p > 0.05
D) = 9.92;p < 0.05
turns out to be 9.92,which is statistically significant.Which of the following is the correct way to report it?A)
= 9.92;p < 0.05B)
= 9.92;p < 0.05C)
= 9.92;p > 0.05D)
= 9.92;p < 0.05 Unlock Deck
Unlock for access to all 49 flashcards in this deck.
Unlock Deck
k this deck
40
The phi coefficient, ,is used as a measure of strength of association for a
A)Mann-Whitney U.
B)Kruskal-Wallis H.
C)one-way .
D)2 * 2 .
A)Mann-Whitney U.
B)Kruskal-Wallis H.
C)one-way
.D)2 * 2
. Unlock Deck
Unlock for access to all 49 flashcards in this deck.
Unlock Deck
k this deck
41
Patricia has collected data on 30 individuals.She measured the pulse rate of 15 individuals after they had watched a violent film clip.She measured the pulse rate of the other 15 people after they had watched a non-violent film clip.Because she knows her study does not meet the assumptions for a two-tailed t-test,what nonparametric test should she run?
A)Wilcoxon T
B)A two-way
C)A Mann-Whitney U
D)a Friedman
A)Wilcoxon T
B)A two-way
C)A Mann-Whitney U
D)a Friedman
Unlock Deck
Unlock for access to all 49 flashcards in this deck.
Unlock Deck
k this deck
42
If you wanted to run determine if there is a relationship between participants' commute time to work and their level of hostility and you need to use a nonparametric test,what test should you run?
A)Spearman
B)Wilcoxon T
C)a Friedman
D)Kruskal-Wallis H
A)Spearman
B)Wilcoxon T
C)a Friedman
D)Kruskal-Wallis H
Unlock Deck
Unlock for access to all 49 flashcards in this deck.
Unlock Deck
k this deck
43
The nonparametric procedure that corresponds to the related samples t-test is the
A)Mann-Whitney U.
B)Wilcoxon T test.
C)Kruskal-Wallis H.
D)Friedman .
A)Mann-Whitney U.
B)Wilcoxon T test.
C)Kruskal-Wallis H.
D)Friedman
. Unlock Deck
Unlock for access to all 49 flashcards in this deck.
Unlock Deck
k this deck
44
James has conducted a study involving a total of 60 participants.These individuals were randomly assigned to one of three different treatment conditions--No Sound,White Noise,or Conversation.Each was then tested on a reading recall task.Because James knows his study does not meet one of the assumptions for a parametric test,what nonparametric test should he run?
A)Mann-Whitney U
B)Spearman
C)a Friedman
D)Kruskal-Wallis H
A)Mann-Whitney U
B)Spearman
C)a Friedman
D)Kruskal-Wallis H
Unlock Deck
Unlock for access to all 49 flashcards in this deck.
Unlock Deck
k this deck
45
You have treadmill endurance test scores for 14 college students taken just before final exam period and a second set of scores for the same students obtained on the afternoon of the last day of finals.You are pretty sure that the populations these scores are sampled from are highly skewed,and so you plan to test for differences in physical endurance using a nonparametric procedure.Which one should you use?
A)A Wilcoxon T
B)Spearman
C)A Mann-Whitney U
D)A Friedman
A)A Wilcoxon T
B)Spearman
C)A Mann-Whitney U
D)A Friedman
Unlock Deck
Unlock for access to all 49 flashcards in this deck.
Unlock Deck
k this deck
46
The nonparametric procedure that corresponds to the within-subjects ANOVA is the
A)Mann-Whitney U.
B)Wilcoxon T.
C)Kruskal-Wallis H.
D)Friedman .
A)Mann-Whitney U.
B)Wilcoxon T.
C)Kruskal-Wallis H.
D)Friedman
. Unlock Deck
Unlock for access to all 49 flashcards in this deck.
Unlock Deck
k this deck
47
The nonparametric procedure that corresponds to the between-subjects ANOVA is the
A)Mann-Whitney U.
B)Wilcoxon T.
C)Kruskal-Wallis H.
D)Friedman .
A)Mann-Whitney U.
B)Wilcoxon T.
C)Kruskal-Wallis H.
D)Friedman
. Unlock Deck
Unlock for access to all 49 flashcards in this deck.
Unlock Deck
k this deck
48
In Tanisha's study,each person's respiration rate was tested for baseline (no exercise),after 5 minutes of strenuous exercise,and 5 minutes after strenuous exercise had stopped.Because her study does not meet one of the assumptions for a parametric test,what nonparametric test should she run?
A)Mann-Whitney U
B)Wilcoxon T
C)a Friedman
D)Kruskal-Wallis H
A)Mann-Whitney U
B)Wilcoxon T
C)a Friedman
D)Kruskal-Wallis H
Unlock Deck
Unlock for access to all 49 flashcards in this deck.
Unlock Deck
k this deck
49
When a Mann-Whitney U test is significant,we accept
A)our samples are independent.
B)our data represent the predicted difference between our conditions in the population.
C)our samples are not independent.
D)our data do not represent the predicted difference between our conditions in the population.
A)our samples are independent.
B)our data represent the predicted difference between our conditions in the population.
C)our samples are not independent.
D)our data do not represent the predicted difference between our conditions in the population.
Unlock Deck
Unlock for access to all 49 flashcards in this deck.
Unlock Deck
k this deck
Unlock Deck
Unlock for access to all 49 flashcards in this deck.


