Deck 18: Understanding Correlation Coefficients in Statistical Analysis
Full screen (f)
Question
Question
A researcher measures the relationship between narcissism and willingness to help.If  = 240,
  = 320,and
  = 410,then what is the value of the correlation coefficient?
A)0.002
B)0.02
C)0.66
D)0.69
= 240, = 320,and = 410,then what is the value of the correlation coefficient?A)0.002
B)0.02
C)0.66
D)0.69
Question
Question
Question
If  = 5.32 and n = 40,then what is the value of the coefficient of determination?
A)0.133
B)0.36
C)0.64
D)There is not enough information to answer this question.
= 5.32 and n = 40,then what is the value of the coefficient of determination?A)0.133
B)0.36
C)0.64
D)There is not enough information to answer this question.
Question
A researcher measures the following correlation between cost of produce and number of units sold.Which description best explains the relationship between these two factors? 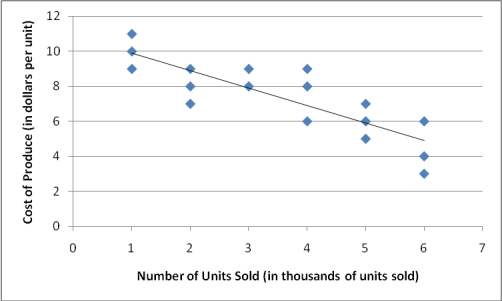
A)As the cost of produce increases,so also do the number of units sold.
B)Less expensive produce is associated with an increased number of units sold.
C)Less expensive produce is associated with a decreased number of units sold.
D)No linear pattern is evident.
A)As the cost of produce increases,so also do the number of units sold.
B)Less expensive produce is associated with an increased number of units sold.
C)Less expensive produce is associated with a decreased number of units sold.
D)No linear pattern is evident.
Question
Question
Question
Question
A researcher measures the following correlation between cups of coffee consumed daily and daily work schedule.Which description best explains the relationship between these two factors? 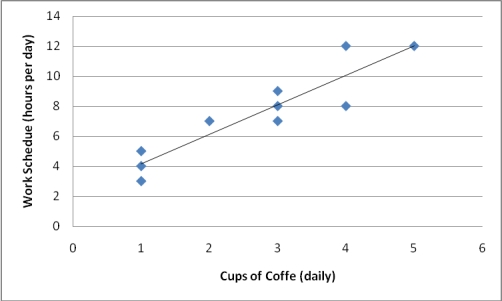
A)The more a person works,the more coffee he or she tends to drink.
B)The less a person works,the more coffee he or she tends to drink.
C)The more a person works,the less coffee he or she tends to drink.
D)No linear pattern is evident.
A)The more a person works,the more coffee he or she tends to drink.
B)The less a person works,the more coffee he or she tends to drink.
C)The more a person works,the less coffee he or she tends to drink.
D)No linear pattern is evident.
Question
Question
Question
Suppose a correlation is computed in each of two samples.If the value of  is the same in each sample,and
  is larger in Sample 1,then in which sample will the value of the correlation coefficient be larger?
A)Sample 1
B)Sample 2
C)None;the correlation coefficient will be the same in both samples.
D)There is not enough information to answer this question.
is the same in each sample,and is larger in Sample 1,then in which sample will the value of the correlation coefficient be larger?A)Sample 1
B)Sample 2
C)None;the correlation coefficient will be the same in both samples.
D)There is not enough information to answer this question.
Question
Question
Question
Question
The following graphs display the data points for two linear correlations.Based on the information provided in these graphs,________ displays a negative correlation and ________ displays a stronger correlation. 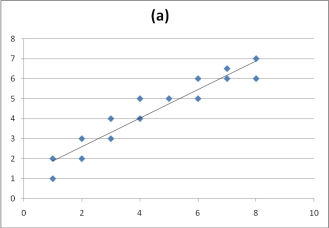
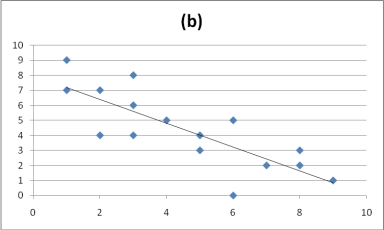
A)Graph A;Graph B
B)Graph B;Graph A
C)Graph A;Graph A
D)Graph B;Graph B
A)Graph A;Graph B
B)Graph B;Graph A
C)Graph A;Graph A
D)Graph B;Graph B
Question
Question
Question
A researcher measures the relationship between two variables,X and Y.If  = 340 and
  = 320,000,then what is the value of the correlation coefficient?
A)0.32
B)0.34
C)0.60
D)almost a zero correlation
= 340 and = 320,000,then what is the value of the correlation coefficient?A)0.32
B)0.34
C)0.60
D)almost a zero correlation
Question
Question
Question
A researcher measures the correlation between self-esteem (high,low)and physical fitness scores among school athletes.In the study,12 participants reported high self-esteem and 12 reported low self-esteem.If  = 9.06 and
  = 11,then what is the value of the correlation coefficient?
A)0.61
B)0.30
C)0.39
D)There is not enough information to answer this question.
= 9.06 and = 11,then what is the value of the correlation coefficient?A)0.61
B)0.30
C)0.39
D)There is not enough information to answer this question.
Question
Question
Question
Question
Question
Question
A researcher measures the correlation in rankings for a sample of restaurants and consumers' rankings of their favorite restaurants.If  = 96 and n = 12,then what is the value of the correlation coefficient?
A)0.07
B)0.34
C)0.66
D)0.94
= 96 and n = 12,then what is the value of the correlation coefficient?A)0.07
B)0.34
C)0.66
D)0.94
Question
Question
Question
A researcher measures the correlation of the time it take participants to complete two tasks purported to measure the same cognitive skill.Participant times are converted to ranks from fastest to slowest.If  = 165 and n = 20,then what is the decision for this correlation test?
A)Retain the null hypothesis.
B)Reject the null hypothesis.
C)There is not enough information to answer this question.
= 165 and n = 20,then what is the decision for this correlation test?A)Retain the null hypothesis.
B)Reject the null hypothesis.
C)There is not enough information to answer this question.
Question
Question
What is the problem with the following data for computing a correlation? 
A)The correlation coefficient will equal 0 because it violates the assumption of normality.
B)The correlation coefficient will equal 1.0 because it violates the assumption of normality.
C)The correlation coefficient will equal 0 because it violates the assumption of linearity.
D)The correlation coefficient will equal 1.0 because it violates the assumption of linearity.
Question
Question
Question
A researcher measures the correlation between gender and student aptitude scores from 0 to 100 among 20 participants.If  = 0.49,then what is the decision for this correlation test?
A)Retain the null hypothesis.
B)Reject the null hypothesis.
C)There is not enough information to answer this question.
= 0.49,then what is the decision for this correlation test?A)Retain the null hypothesis.
B)Reject the null hypothesis.
C)There is not enough information to answer this question.
Question
Question
Question
Question
Question
Question
If r = 0.65 and n = 36,then what is the value of  ?
?
A)3.84
B)5.99
C)15.21
D)23.40
?A)3.84
B)5.99
C)15.21
D)23.40
Question
Question
A researcher determines that  = 3.76 to test for significance for a phi correlation coefficient.What was the decision for this phi correlation test?
A)Retain the null hypothesis.
B)Reject the null hypothesis
C)There is not enough information to answer this question.
= 3.76 to test for significance for a phi correlation coefficient.What was the decision for this phi correlation test?A)Retain the null hypothesis.
B)Reject the null hypothesis
C)There is not enough information to answer this question.
Question
Question
Question
Question
Question
Question
Question
Question
Question
A researcher measures the correlation between the frequency of self-esteem (high,low)and health status (lean/healthy,overweight/obese).Based on the frequencies for each nominal category given below,what is the value of the phi correlation coefficient? 
A)0.08
B)0.28
C)0.52
D)0.56
A)0.08
B)0.28
C)0.52
D)0.56
Question
Question
Question
If  = 3.84 and n = 36,then what is the value of r?
A)0.11
B)0.16
C)0.33
D)0.36
= 3.84 and n = 36,then what is the value of r?A)0.11
B)0.16
C)0.33
D)0.36
Question
Question
A researcher computes the following phi correlation coefficient:  = 0.42.If the sample size was 20,then what is the decision for this correlation test?
A)Retain the null hypothesis.
B)Reject the null hypothesis.
C)There is not enough information to answer this question.
= 0.42.If the sample size was 20,then what is the decision for this correlation test?A)Retain the null hypothesis.
B)Reject the null hypothesis.
C)There is not enough information to answer this question.
Question
Question
Question
Question
Question
Question
Question
Question
Question
Question
Question
Question
Question
Question
Question
Question
Question
Question
Question
Question
Question

Unlock Deck
Sign up to unlock the cards in this deck!
Unlock Deck
Unlock Deck
1/80
Play
Full screen (f)
Deck 18: Understanding Correlation Coefficients in Statistical Analysis
1
The correlation coefficient measures the extent to which changes in one factor are _______ in a second factor.
A)related to changes
B)causing changes
C)causing variability
D)all of the above
A)related to changes
B)causing changes
C)causing variability
D)all of the above
related to changes
2
A researcher measures the relationship between narcissism and willingness to help.If = 240, = 320,and = 410,then what is the value of the correlation coefficient?
A)0.002
B)0.02
C)0.66
D)0.69
= 240, = 320,and = 410,then what is the value of the correlation coefficient?A)0.002
B)0.02
C)0.66
D)0.69
0.66
3
The numerator of the correlation coefficient measures the extent to which two variables
A)vary together
B)vary independently
C)covary
D)both A and C
A)vary together
B)vary independently
C)covary
D)both A and C
both A and C
4
The coefficient of determination is mathematically equivalent to
A)the correlation coefficient
B)omega-squared
C)eta-squared
D)both B and C
A)the correlation coefficient
B)omega-squared
C)eta-squared
D)both B and C
Unlock Deck
Unlock for access to all 80 flashcards in this deck.
Unlock Deck
k this deck
5
If = 5.32 and n = 40,then what is the value of the coefficient of determination?
A)0.133
B)0.36
C)0.64
D)There is not enough information to answer this question.
= 5.32 and n = 40,then what is the value of the coefficient of determination?A)0.133
B)0.36
C)0.64
D)There is not enough information to answer this question.
Unlock Deck
Unlock for access to all 80 flashcards in this deck.
Unlock Deck
k this deck
6
A researcher measures the following correlation between cost of produce and number of units sold.Which description best explains the relationship between these two factors?
A)As the cost of produce increases,so also do the number of units sold.
B)Less expensive produce is associated with an increased number of units sold.
C)Less expensive produce is associated with a decreased number of units sold.
D)No linear pattern is evident.
A)As the cost of produce increases,so also do the number of units sold.
B)Less expensive produce is associated with an increased number of units sold.
C)Less expensive produce is associated with a decreased number of units sold.
D)No linear pattern is evident.
Unlock Deck
Unlock for access to all 80 flashcards in this deck.
Unlock Deck
k this deck
7
Which of the following indicates the strongest correlation?
A)r = -0.57
B)r = +0.78
C)r = -0.90
D)r = +0.88
A)r = -0.57
B)r = +0.78
C)r = -0.90
D)r = +0.88
Unlock Deck
Unlock for access to all 80 flashcards in this deck.
Unlock Deck
k this deck
8
The correlation coefficient is used to measure the ________ and ________ of the linear relationship between two factors.
A)date;time
B)mean;variance
C)significance;effect size
D)strength;direction
A)date;time
B)mean;variance
C)significance;effect size
D)strength;direction
Unlock Deck
Unlock for access to all 80 flashcards in this deck.
Unlock Deck
k this deck
9
A statistical procedure used to describe the strength and direction of the linear relationship between two factors is called
A)effect size
B)power
C)a correlation
D)coincidence
A)effect size
B)power
C)a correlation
D)coincidence
Unlock Deck
Unlock for access to all 80 flashcards in this deck.
Unlock Deck
k this deck
10
A researcher measures the following correlation between cups of coffee consumed daily and daily work schedule.Which description best explains the relationship between these two factors?
A)The more a person works,the more coffee he or she tends to drink.
B)The less a person works,the more coffee he or she tends to drink.
C)The more a person works,the less coffee he or she tends to drink.
D)No linear pattern is evident.
A)The more a person works,the more coffee he or she tends to drink.
B)The less a person works,the more coffee he or she tends to drink.
C)The more a person works,the less coffee he or she tends to drink.
D)No linear pattern is evident.
Unlock Deck
Unlock for access to all 80 flashcards in this deck.
Unlock Deck
k this deck
11
A researcher measures the following correlation: r = -0.21.What is the value of the coefficient of determination?
A)0.04
B)-0.04
C)0.42
D)-0.42
A)0.04
B)-0.04
C)0.42
D)-0.42
Unlock Deck
Unlock for access to all 80 flashcards in this deck.
Unlock Deck
k this deck
12
The coefficient of determination is
A)a measure of effect size
B)mathematically equivalent to eta-squared
C)equal to the correlation coefficient squared
D)all of the above
A)a measure of effect size
B)mathematically equivalent to eta-squared
C)equal to the correlation coefficient squared
D)all of the above
Unlock Deck
Unlock for access to all 80 flashcards in this deck.
Unlock Deck
k this deck
13
Suppose a correlation is computed in each of two samples.If the value of is the same in each sample,and is larger in Sample 1,then in which sample will the value of the correlation coefficient be larger?
A)Sample 1
B)Sample 2
C)None;the correlation coefficient will be the same in both samples.
D)There is not enough information to answer this question.
is the same in each sample,and is larger in Sample 1,then in which sample will the value of the correlation coefficient be larger?A)Sample 1
B)Sample 2
C)None;the correlation coefficient will be the same in both samples.
D)There is not enough information to answer this question.
Unlock Deck
Unlock for access to all 80 flashcards in this deck.
Unlock Deck
k this deck
14
The most common measure of effect size for the correlation coefficient is called
A)the correlation coefficient
B)the coefficient of determination
C)estimated Cohen's d
D)the test statistic
A)the correlation coefficient
B)the coefficient of determination
C)estimated Cohen's d
D)the test statistic
Unlock Deck
Unlock for access to all 80 flashcards in this deck.
Unlock Deck
k this deck
15
The correlation coefficient ranges between ____ and ____.
A)0;+1
B)-1;0
C)-1;+1
D)- ;+
A)0;+1
B)-1;0
C)-1;+1
D)- ;+
Unlock Deck
Unlock for access to all 80 flashcards in this deck.
Unlock Deck
k this deck
16
A researcher measures the following correlation between number of years of education and life satisfaction: r = +0.08.What is the value of the coefficient of determination?
A)0.08
B)0.16
C)0.01
D)0.11
A)0.08
B)0.16
C)0.01
D)0.11
Unlock Deck
Unlock for access to all 80 flashcards in this deck.
Unlock Deck
k this deck
17
The following graphs display the data points for two linear correlations.Based on the information provided in these graphs,________ displays a negative correlation and ________ displays a stronger correlation.
A)Graph A;Graph B
B)Graph B;Graph A
C)Graph A;Graph A
D)Graph B;Graph B
A)Graph A;Graph B
B)Graph B;Graph A
C)Graph A;Graph A
D)Graph B;Graph B
Unlock Deck
Unlock for access to all 80 flashcards in this deck.
Unlock Deck
k this deck
18
The denominator of the correlation coefficient measures the extent to which two variables
A)vary together
B)vary independently
C)covary
D)both A and C
A)vary together
B)vary independently
C)covary
D)both A and C
Unlock Deck
Unlock for access to all 80 flashcards in this deck.
Unlock Deck
k this deck
19
The correlation coefficient ranges from -1.0 to +1.0,with values closer to ±1.0 indicating
A)a more positive relationship between two factors
B)a stronger relationship between two factors
C)that two factors are less likely to be related
D)that the correlation is due to outliers
A)a more positive relationship between two factors
B)a stronger relationship between two factors
C)that two factors are less likely to be related
D)that the correlation is due to outliers
Unlock Deck
Unlock for access to all 80 flashcards in this deck.
Unlock Deck
k this deck
20
A researcher measures the relationship between two variables,X and Y.If = 340 and = 320,000,then what is the value of the correlation coefficient?
A)0.32
B)0.34
C)0.60
D)almost a zero correlation
= 340 and = 320,000,then what is the value of the correlation coefficient?A)0.32
B)0.34
C)0.60
D)almost a zero correlation
Unlock Deck
Unlock for access to all 80 flashcards in this deck.
Unlock Deck
k this deck
21
The assumption that there is an equal variance or scatter of data points dispersed along the regression line is referred to as
A)normality
B)linearity
C)homoscedasticity
D)restriction of range
A)normality
B)linearity
C)homoscedasticity
D)restriction of range
Unlock Deck
Unlock for access to all 80 flashcards in this deck.
Unlock Deck
k this deck
22
Which of the following is a limitation for interpreting a correlation?
A)Correlations do not demonstrate cause-and-effect.
B)Outliers can change the direction and/or strength of the correlation.
C)Conclusions should not be drawn beyond the range of scores measured.
D)all of the above
A)Correlations do not demonstrate cause-and-effect.
B)Outliers can change the direction and/or strength of the correlation.
C)Conclusions should not be drawn beyond the range of scores measured.
D)all of the above
Unlock Deck
Unlock for access to all 80 flashcards in this deck.
Unlock Deck
k this deck
23
A researcher measures the correlation between self-esteem (high,low)and physical fitness scores among school athletes.In the study,12 participants reported high self-esteem and 12 reported low self-esteem.If = 9.06 and = 11,then what is the value of the correlation coefficient?
A)0.61
B)0.30
C)0.39
D)There is not enough information to answer this question.
= 9.06 and = 11,then what is the value of the correlation coefficient?A)0.61
B)0.30
C)0.39
D)There is not enough information to answer this question.
Unlock Deck
Unlock for access to all 80 flashcards in this deck.
Unlock Deck
k this deck
24
The normality assumption states that the population of X and Y scores form a bivariate ("two variable")normal distribution,such that
A)the population of X and Y scores are normally distributed
B)for each X score,the distribution of Y scores is normally distributed
C)for each Y score,the distribution of X scores is normally distributed
D)all of the above
A)the population of X and Y scores are normally distributed
B)for each X score,the distribution of Y scores is normally distributed
C)for each Y score,the distribution of X scores is normally distributed
D)all of the above
Unlock Deck
Unlock for access to all 80 flashcards in this deck.
Unlock Deck
k this deck
25
The point-biserial correlation coefficient is a measure of the direction and strength of the linear relationship between two variables,where
A)one is continuous,and one is dichotomous
B)both variables are on an ordinal scale
C)one is at interval level or higher and one is ordinal
D)both variables are on a nominal scale
A)one is continuous,and one is dichotomous
B)both variables are on an ordinal scale
C)one is at interval level or higher and one is ordinal
D)both variables are on a nominal scale
Unlock Deck
Unlock for access to all 80 flashcards in this deck.
Unlock Deck
k this deck
26
The Spearman rank-order correlation coefficient is a measure of the direction and strength of the linear relationship between two ________ variables.
A)nominal
B)ordinal
C)interval
D)ratio
A)nominal
B)ordinal
C)interval
D)ratio
Unlock Deck
Unlock for access to all 80 flashcards in this deck.
Unlock Deck
k this deck
27
The appropriate correlation coefficient for measuring the direction and strength of the linear relationship between one continuous and one dichotomous variable is
A)the Spearman rank-order correlation coefficient
B)the point-biserial correlation coefficient
C)the phi correlation coefficient
D)none of the above
A)the Spearman rank-order correlation coefficient
B)the point-biserial correlation coefficient
C)the phi correlation coefficient
D)none of the above
Unlock Deck
Unlock for access to all 80 flashcards in this deck.
Unlock Deck
k this deck
28
A researcher observes a correlation of values from 2 to 10 points and draws conclusions about the full range of values in the population from 0 to 21 points.Which limitation for correctly interpreting a correlation coefficient did the researcher violate?
A)reverse causality
B)restriction of range
C)a confound variable
D)homoscedasticity
A)reverse causality
B)restriction of range
C)a confound variable
D)homoscedasticity
Unlock Deck
Unlock for access to all 80 flashcards in this deck.
Unlock Deck
k this deck
29
A researcher measures the correlation in rankings for a sample of restaurants and consumers' rankings of their favorite restaurants.If = 96 and n = 12,then what is the value of the correlation coefficient?
A)0.07
B)0.34
C)0.66
D)0.94
= 96 and n = 12,then what is the value of the correlation coefficient?A)0.07
B)0.34
C)0.66
D)0.94
Unlock Deck
Unlock for access to all 80 flashcards in this deck.
Unlock Deck
k this deck
30
Which of the following is the assumption that the best way to describe the pattern of data is using a straight line?
A)normality
B)linearity
C)homoscedasticity
D)restriction of range
A)normality
B)linearity
C)homoscedasticity
D)restriction of range
Unlock Deck
Unlock for access to all 80 flashcards in this deck.
Unlock Deck
k this deck
31
Outliers can change the _____ of a correlation.
A)direction
B)strength
C)sign (+,-)
D)all of the above
A)direction
B)strength
C)sign (+,-)
D)all of the above
Unlock Deck
Unlock for access to all 80 flashcards in this deck.
Unlock Deck
k this deck
32
A researcher measures the correlation of the time it take participants to complete two tasks purported to measure the same cognitive skill.Participant times are converted to ranks from fastest to slowest.If = 165 and n = 20,then what is the decision for this correlation test?
A)Retain the null hypothesis.
B)Reject the null hypothesis.
C)There is not enough information to answer this question.
= 165 and n = 20,then what is the decision for this correlation test?A)Retain the null hypothesis.
B)Reject the null hypothesis.
C)There is not enough information to answer this question.
Unlock Deck
Unlock for access to all 80 flashcards in this deck.
Unlock Deck
k this deck
33
The appropriate correlation coefficient for measuring for the direction and strength of the linear relationship between two dichotomous variables is
A)the Spearman rank-order correlation coefficient
B)the point-biserial correlation coefficient
C)the phi correlation coefficient
D)none of the above
A)the Spearman rank-order correlation coefficient
B)the point-biserial correlation coefficient
C)the phi correlation coefficient
D)none of the above
Unlock Deck
Unlock for access to all 80 flashcards in this deck.
Unlock Deck
k this deck
34
What is the problem with the following data for computing a correlation?
A)The correlation coefficient will equal 0 because it violates the assumption of normality.
B)The correlation coefficient will equal 1.0 because it violates the assumption of normality.
C)The correlation coefficient will equal 0 because it violates the assumption of linearity.
D)The correlation coefficient will equal 1.0 because it violates the assumption of linearity.
Unlock Deck
Unlock for access to all 80 flashcards in this deck.
Unlock Deck
k this deck
35
An unanticipated variable not accounted for in a research study that could be causing or associated with observed changes in one or more measured variables is called
A)reverse causality
B)restriction of range
C)a confound variable
D)homoscedasticity
A)reverse causality
B)restriction of range
C)a confound variable
D)homoscedasticity
Unlock Deck
Unlock for access to all 80 flashcards in this deck.
Unlock Deck
k this deck
36
The phi correlation coefficient is a measure for the direction and strength of the linear relationship between two ________ variables.
A)dichotomous
B)curvilinear
C)ordinal
D)significant
A)dichotomous
B)curvilinear
C)ordinal
D)significant
Unlock Deck
Unlock for access to all 80 flashcards in this deck.
Unlock Deck
k this deck
37
A researcher measures the correlation between gender and student aptitude scores from 0 to 100 among 20 participants.If = 0.49,then what is the decision for this correlation test?
A)Retain the null hypothesis.
B)Reject the null hypothesis.
C)There is not enough information to answer this question.
= 0.49,then what is the decision for this correlation test?A)Retain the null hypothesis.
B)Reject the null hypothesis.
C)There is not enough information to answer this question.
Unlock Deck
Unlock for access to all 80 flashcards in this deck.
Unlock Deck
k this deck
38
The appropriate correlation coefficient for measuring the direction and strength of the linear relationship between two ranked or ordinal variables is
A)the Spearman correlation coefficient
B)the point-biserial correlation coefficient
C)the phi correlation coefficient
D)none of the above
A)the Spearman correlation coefficient
B)the point-biserial correlation coefficient
C)the phi correlation coefficient
D)none of the above
Unlock Deck
Unlock for access to all 80 flashcards in this deck.
Unlock Deck
k this deck
39
A correlation coefficient can ______ demonstrate cause.
A)always
B)never
C)mostly
D)intermittently
A)always
B)never
C)mostly
D)intermittently
Unlock Deck
Unlock for access to all 80 flashcards in this deck.
Unlock Deck
k this deck
40
Which of the following is the assumption that there is an equal variance of data points dispersed along the regression line?
A)normality
B)linearity
C)homoscedasticity
D)restriction of range
A)normality
B)linearity
C)homoscedasticity
D)restriction of range
Unlock Deck
Unlock for access to all 80 flashcards in this deck.
Unlock Deck
k this deck
41
Select the description below that identifies the following correlation: r = .28,p < .01.
A)the correlation is positive
B)the correlation is statistically significant
C)the coefficient of determination is .08
D)all of the above
A)the correlation is positive
B)the correlation is statistically significant
C)the coefficient of determination is .08
D)all of the above
Unlock Deck
Unlock for access to all 80 flashcards in this deck.
Unlock Deck
k this deck
42
We convert r to a chi-square statistic for which of the following correlation tests?
A)Pearson
B)Spearman
C)point-biserial
D)phi
A)Pearson
B)Spearman
C)point-biserial
D)phi
Unlock Deck
Unlock for access to all 80 flashcards in this deck.
Unlock Deck
k this deck
43
If r = 0.65 and n = 36,then what is the value of ?
A)3.84
B)5.99
C)15.21
D)23.40
?A)3.84
B)5.99
C)15.21
D)23.40
Unlock Deck
Unlock for access to all 80 flashcards in this deck.
Unlock Deck
k this deck
44
A correlation of r = .38 in a sample of 30 participants is statistically significant for a two-tailed test at a .05 level of significance.
Unlock Deck
Unlock for access to all 80 flashcards in this deck.
Unlock Deck
k this deck
45
A researcher determines that = 3.76 to test for significance for a phi correlation coefficient.What was the decision for this phi correlation test?
A)Retain the null hypothesis.
B)Reject the null hypothesis
C)There is not enough information to answer this question.
= 3.76 to test for significance for a phi correlation coefficient.What was the decision for this phi correlation test?A)Retain the null hypothesis.
B)Reject the null hypothesis
C)There is not enough information to answer this question.
Unlock Deck
Unlock for access to all 80 flashcards in this deck.
Unlock Deck
k this deck
46
We convert r to a t statistic for which of the following correlation tests?
A)Pearson
B)Spearman
C)point-biserial
D)phi
A)Pearson
B)Spearman
C)point-biserial
D)phi
Unlock Deck
Unlock for access to all 80 flashcards in this deck.
Unlock Deck
k this deck
47
A positive correlation is always stronger than a negative correlation.
Unlock Deck
Unlock for access to all 80 flashcards in this deck.
Unlock Deck
k this deck
48
The coefficient of determination is a measure of significance.
Unlock Deck
Unlock for access to all 80 flashcards in this deck.
Unlock Deck
k this deck
49
A correlation of r = .50 in a sample of 15 participants is statistically significant for a two-tailed test at a .05 level of significance.
Unlock Deck
Unlock for access to all 80 flashcards in this deck.
Unlock Deck
k this deck
50
To summarize correlations,we report:
A)the strength of the correlation
B)the direction of the correlation
C)the p value
D)all of the above
A)the strength of the correlation
B)the direction of the correlation
C)the p value
D)all of the above
Unlock Deck
Unlock for access to all 80 flashcards in this deck.
Unlock Deck
k this deck
51
The value of the sum of products can be positive or negative.
Unlock Deck
Unlock for access to all 80 flashcards in this deck.
Unlock Deck
k this deck
52
The sign (+ or -)of a correlation coefficient indicates the direction of a relationship between two factors.
Unlock Deck
Unlock for access to all 80 flashcards in this deck.
Unlock Deck
k this deck
53
The correlation coefficient varies between 0 and 1 and can never be negative.
Unlock Deck
Unlock for access to all 80 flashcards in this deck.
Unlock Deck
k this deck
54
A researcher measures the correlation between the frequency of self-esteem (high,low)and health status (lean/healthy,overweight/obese).Based on the frequencies for each nominal category given below,what is the value of the phi correlation coefficient?
A)0.08
B)0.28
C)0.52
D)0.56
A)0.08
B)0.28
C)0.52
D)0.56
Unlock Deck
Unlock for access to all 80 flashcards in this deck.
Unlock Deck
k this deck
55
The coefficient of determination is mathematically equivalent to eta-squared.
Unlock Deck
Unlock for access to all 80 flashcards in this deck.
Unlock Deck
k this deck
56
The denominator of the Pearson correlation coefficient measures the extent to which two factors vary together.
Unlock Deck
Unlock for access to all 80 flashcards in this deck.
Unlock Deck
k this deck
57
If = 3.84 and n = 36,then what is the value of r?
A)0.11
B)0.16
C)0.33
D)0.36
= 3.84 and n = 36,then what is the value of r?A)0.11
B)0.16
C)0.33
D)0.36
Unlock Deck
Unlock for access to all 80 flashcards in this deck.
Unlock Deck
k this deck
58
The closer that data points fall to the regression line,the more closely two factors are related.
Unlock Deck
Unlock for access to all 80 flashcards in this deck.
Unlock Deck
k this deck
59
A researcher computes the following phi correlation coefficient: = 0.42.If the sample size was 20,then what is the decision for this correlation test?
A)Retain the null hypothesis.
B)Reject the null hypothesis.
C)There is not enough information to answer this question.
= 0.42.If the sample size was 20,then what is the decision for this correlation test?A)Retain the null hypothesis.
B)Reject the null hypothesis.
C)There is not enough information to answer this question.
Unlock Deck
Unlock for access to all 80 flashcards in this deck.
Unlock Deck
k this deck
60
Which of the following would not be reported for a correlation?
A)the sample size
B)the coefficient of determination
C)the critical values for each test
D)the strength and direction of the correlation
A)the sample size
B)the coefficient of determination
C)the critical values for each test
D)the strength and direction of the correlation
Unlock Deck
Unlock for access to all 80 flashcards in this deck.
Unlock Deck
k this deck
61
Outliers can change both the direction and strength of a correlation coefficient.
Unlock Deck
Unlock for access to all 80 flashcards in this deck.
Unlock Deck
k this deck
62
Restriction of range occurs when an unanticipated variable not accounted for in a research study that could be causing or associated with observed changes in one or more measured variables.
Unlock Deck
Unlock for access to all 80 flashcards in this deck.
Unlock Deck
k this deck
63
The correlation coefficient can be converted to a t statistic.
Unlock Deck
Unlock for access to all 80 flashcards in this deck.
Unlock Deck
k this deck
64
The formula for the phi correlation coefficient was derived from the formula for the Pearson correlation coefficient.
Unlock Deck
Unlock for access to all 80 flashcards in this deck.
Unlock Deck
k this deck
65
The formula for the Spearman correlation coefficient was derived from the formula for the Pearson correlation coefficient.
Unlock Deck
Unlock for access to all 80 flashcards in this deck.
Unlock Deck
k this deck
66
The correlation coefficient can be converted to a chi-square statistic.
Unlock Deck
Unlock for access to all 80 flashcards in this deck.
Unlock Deck
k this deck
67
If r = .25,then the coefficient of determination is .06.
Unlock Deck
Unlock for access to all 80 flashcards in this deck.
Unlock Deck
k this deck
68
The formula for the point-biserial correlation coefficient was derived from the formula for the Pearson correlation coefficient.
Unlock Deck
Unlock for access to all 80 flashcards in this deck.
Unlock Deck
k this deck
69
Homoscedasticity is the assumption that there is an equal variance of data points dispersed along the regression line.
Unlock Deck
Unlock for access to all 80 flashcards in this deck.
Unlock Deck
k this deck
70
The coefficient of determination is the square root of the correlation coefficient.
Unlock Deck
Unlock for access to all 80 flashcards in this deck.
Unlock Deck
k this deck
71
If r = 0.026 and df = 10,then t = 7.20.
Unlock Deck
Unlock for access to all 80 flashcards in this deck.
Unlock Deck
k this deck
72
Correlation does not show causation.
Unlock Deck
Unlock for access to all 80 flashcards in this deck.
Unlock Deck
k this deck
73
When we compute many correlations in a single study,we report each correlation coefficient in a table called a correlation matrix.
Unlock Deck
Unlock for access to all 80 flashcards in this deck.
Unlock Deck
k this deck
74
The phi correlation coefficient is used to measure the correlation between two ordinal variables.
Unlock Deck
Unlock for access to all 80 flashcards in this deck.
Unlock Deck
k this deck
75
Linearity is the assumption that the best way to describe a pattern of data is using a straight line.
Unlock Deck
Unlock for access to all 80 flashcards in this deck.
Unlock Deck
k this deck
76
The assumption of normality requires that the range of scores observed in a sample is the same of the possible range of scores in the population.
Unlock Deck
Unlock for access to all 80 flashcards in this deck.
Unlock Deck
k this deck
77
To summarize correlations,we report the strength,the direction,and the p value for each correlation coefficient.
Unlock Deck
Unlock for access to all 80 flashcards in this deck.
Unlock Deck
k this deck
78
The Spearman correlation coefficient is used to measure the correlation between two nominal variables.
Unlock Deck
Unlock for access to all 80 flashcards in this deck.
Unlock Deck
k this deck
79
The point-biserial correlation coefficient is used to measure the correlation between two dichotomous variables.
Unlock Deck
Unlock for access to all 80 flashcards in this deck.
Unlock Deck
k this deck
80
Three assumptions for a correlation are homoscedasticity,linearity,and normality.
Unlock Deck
Unlock for access to all 80 flashcards in this deck.
Unlock Deck
k this deck
Unlock Deck
Unlock for access to all 80 flashcards in this deck.


