Deck 16: Statistical Reasoning in Everyday Life
Full screen (f)
Question
Question
Question
Question
Question
Question
Question
Question
Question
Question
Question
Question
Question
Question
Question
Question
Question
Question
Question
Question
Question
Question
Question
Question
Question
Question
Question
Question
Question
Question
Question
Question
Question
Question
Question
Question
Question
Question
Question
Question
Question
Question
Question
Question
Question
Question
Question
Question
Question
Question
Question
Question
Question
Question
Question
Question
Question
Question
Question
Question
Question
Question
Question
Question
Question
Question
Question
Question
Question
Question
The following scatterplot depicts a correlation coefficient that would be close to 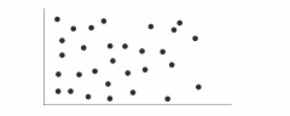
A) +1.0.
B) -1.0.
C) 0.00.
D) 0.50.
A) +1.0.
B) -1.0.
C) 0.00.
D) 0.50.
Question
Question
Question
Question
Question
Question
Question
Question
Question
Question

Unlock Deck
Sign up to unlock the cards in this deck!
Unlock Deck
Unlock Deck
1/162
Play
Full screen (f)
Deck 16: Statistical Reasoning in Everyday Life
1
For which of the following distributions of scores would the median most clearly be a more appropriate measure of central tendency than the mean?
A) 16, 28, 4, 8, 24
B) 9, 6, 9, 12, 9
C) 8, 9, 12, 10, 16
D) 6, 18, 4, 5, 2
A) 16, 28, 4, 8, 24
B) 9, 6, 9, 12, 9
C) 8, 9, 12, 10, 16
D) 6, 18, 4, 5, 2
6, 18, 4, 5, 2
2
In any distribution of scores, an equal number of scores are both greater than and less than
A) the mode.
B) the mean.
C) the median.
D) any of these measures of central tendency.
A) the mode.
B) the mean.
C) the median.
D) any of these measures of central tendency.
the median.
3
To understand the British newspaper headline "Income for 62% Is Below Average," it is necessary to appreciate the distinction between the ________ and the mean.
A) range
B) standard deviation
C) mode
D) median
A) range
B) standard deviation
C) mode
D) median
median
4
The standard deviation is a measure of
A) central tendency.
B) variation.
C) statistical significance.
D) correlation.
A) central tendency.
B) variation.
C) statistical significance.
D) correlation.
Unlock Deck
Unlock for access to all 162 flashcards in this deck.
Unlock Deck
k this deck
5
Variation is to central tendency as ________ is to ________.
A) range; median
B) mode; mean
C) scatterplot; bar graph
D) correlation; scatterplot
A) range; median
B) mode; mean
C) scatterplot; bar graph
D) correlation; scatterplot
Unlock Deck
Unlock for access to all 162 flashcards in this deck.
Unlock Deck
k this deck
6
Two students in an art class are at least 20 years older than the others. Which measure of variation of class members' ages is most affected by the ages of these two students?
A) standard deviation
B) mode
C) median
D) range
A) standard deviation
B) mode
C) median
D) range
Unlock Deck
Unlock for access to all 162 flashcards in this deck.
Unlock Deck
k this deck
7
Which of the following provides a rough indication of the degree of variation among a set of scores?
A) correlation coefficient
B) scatterplot
C) range
D) median
A) correlation coefficient
B) scatterplot
C) range
D) median
Unlock Deck
Unlock for access to all 162 flashcards in this deck.
Unlock Deck
k this deck
8
Seven members of a girls' club reported the following individual earnings from their sale of raffle tickets: $5, $9, $4, $11, $6, $4, and $3. In this distribution of individual earnings, the
A) median is greater than the mean and greater than the mode.
B) median is less than the mean and less than the mode.
C) median is greater than the mean and less than the mode.
D) median is less than the mean and greater than the mode.
A) median is greater than the mean and greater than the mode.
B) median is less than the mean and less than the mode.
C) median is greater than the mean and less than the mode.
D) median is less than the mean and greater than the mode.
Unlock Deck
Unlock for access to all 162 flashcards in this deck.
Unlock Deck
k this deck
9
The most familiar measure of central tendency is the
A) mode.
B) mean.
C) median.
D) standard deviation.
A) mode.
B) mean.
C) median.
D) standard deviation.
Unlock Deck
Unlock for access to all 162 flashcards in this deck.
Unlock Deck
k this deck
10
Seven members of a 4H club reported the following individual earnings from their sale of cakes: $7, $13, $3, $5, $2, $9, and $3. In this distribution of individual earnings, the
A) mean is greater than the mode and greater than the median.
B) mean is equal to the mode and less than the median.
C) mean is greater than the mode and equal to the median.
D) mean is less than the mode and less than the median.
A) mean is greater than the mode and greater than the median.
B) mean is equal to the mode and less than the median.
C) mean is greater than the mode and equal to the median.
D) mean is less than the mode and less than the median.
Unlock Deck
Unlock for access to all 162 flashcards in this deck.
Unlock Deck
k this deck
11
In a distribution of test scores, which measure of central tendency would likely be the most affected by a couple of extremely high scores?
A) median
B) mode
C) standard deviation
D) mean
A) median
B) mode
C) standard deviation
D) mean
Unlock Deck
Unlock for access to all 162 flashcards in this deck.
Unlock Deck
k this deck
12
The range is
A) the difference between the highest and lowest scores in a distribution.
B) the most commonly used measure of variation.
C) the average deviation of scores from the mean.
D) the most frequently occurring score in a distribution of scores.
A) the difference between the highest and lowest scores in a distribution.
B) the most commonly used measure of variation.
C) the average deviation of scores from the mean.
D) the most frequently occurring score in a distribution of scores.
Unlock Deck
Unlock for access to all 162 flashcards in this deck.
Unlock Deck
k this deck
13
Standard deviation is to mean as ________ is to ________.
A) median; mode
B) variation; central tendency
C) scatterplot; bar graph
D) correlation; scatterplot
A) median; mode
B) variation; central tendency
C) scatterplot; bar graph
D) correlation; scatterplot
Unlock Deck
Unlock for access to all 162 flashcards in this deck.
Unlock Deck
k this deck
14
The mode, median, and mean are measures of
A) central tendency.
B) variation.
C) correlation.
D) statistical significance.
A) central tendency.
B) variation.
C) correlation.
D) statistical significance.
Unlock Deck
Unlock for access to all 162 flashcards in this deck.
Unlock Deck
k this deck
15
Measures of central tendency are most useful for
A) random sampling.
B) summarizing data.
C) preventing skewed distributions.
D) constructing scatterplots.
A) random sampling.
B) summarizing data.
C) preventing skewed distributions.
D) constructing scatterplots.
Unlock Deck
Unlock for access to all 162 flashcards in this deck.
Unlock Deck
k this deck
16
Six different high school students spent $10, $13, $2, $12, $13, and $4, respectively, on entertainment. The mode of this group's entertainment expenditures is
A) $9.
B) $11.
C) $12.
D) $13.
A) $9.
B) $11.
C) $12.
D) $13.
Unlock Deck
Unlock for access to all 162 flashcards in this deck.
Unlock Deck
k this deck
17
The mode, median, and mean are most likely to have different values when they
A) describe a skewed distribution.
B) are derived from a limited range of scores.
C) represent the central tendency of a random sample.
D) represent the central tendency of an entire population.
A) describe a skewed distribution.
B) are derived from a limited range of scores.
C) represent the central tendency of a random sample.
D) represent the central tendency of an entire population.
Unlock Deck
Unlock for access to all 162 flashcards in this deck.
Unlock Deck
k this deck
18
The arithmetic average of a distribution of scores is the
A) mode.
B) median.
C) standard deviation.
D) mean.
A) mode.
B) median.
C) standard deviation.
D) mean.
Unlock Deck
Unlock for access to all 162 flashcards in this deck.
Unlock Deck
k this deck
19
The mode of a distribution of scores is the
A) score exceeded by 50 percent of all the scores.
B) most frequently occurring score.
C) arithmetic average of all the scores.
D) difference between the highest and lowest scores.
A) score exceeded by 50 percent of all the scores.
B) most frequently occurring score.
C) arithmetic average of all the scores.
D) difference between the highest and lowest scores.
Unlock Deck
Unlock for access to all 162 flashcards in this deck.
Unlock Deck
k this deck
20
The percentage of college students whose gradepoint averages fall into various performance levels could be represented on a
A) standard deviation.
B) bar graph.
C) scatterplot.
D) correlation coefficient.
A) standard deviation.
B) bar graph.
C) scatterplot.
D) correlation coefficient.
Unlock Deck
Unlock for access to all 162 flashcards in this deck.
Unlock Deck
k this deck
21
Kiska used a scatterplot to display the relationship between college students' self-esteem and their feelings of depression. The points on the scatterplot are most likely clustered in a pattern that
A) resembles a bell-shaped curve.
B) extends from the upper left to the lower right of the plot.
C) resembles a U-shaped curve.
D) extends from the lower left to the upper right of the plot.
A) resembles a bell-shaped curve.
B) extends from the upper left to the lower right of the plot.
C) resembles a U-shaped curve.
D) extends from the lower left to the upper right of the plot.
Unlock Deck
Unlock for access to all 162 flashcards in this deck.
Unlock Deck
k this deck
22
If IQ scores are normally distributed, having a mean of 100 and a standard deviation of 15, approximately what percentage of people have IQ scores between 85 and 115?
A) 34
B) 50
C) 68
D) 95
A) 34
B) 50
C) 68
D) 95
Unlock Deck
Unlock for access to all 162 flashcards in this deck.
Unlock Deck
k this deck
23
Akira dreamed that a handsome young man she had met the previous day asked her for a date. When he actually did call for a date several days later, Akira concluded that dreams accurately predict future events. Her belief best illustrates
A) a normal curve.
B) an illusory correlation.
C) a standard deviation.
D) a scatterplot.
A) a normal curve.
B) an illusory correlation.
C) a standard deviation.
D) a scatterplot.
Unlock Deck
Unlock for access to all 162 flashcards in this deck.
Unlock Deck
k this deck
24
Professor Chang displays the relationship between the height and weight measurements of over 500 randomly selected people using a scatterplot. The points on the scatterplot are most likely clustered in a pattern that
A) resembles a U-shaped curve.
B) extends from the upper left to the lower right of the plot.
C) resembles a bell-shaped curve.
D) extends from the lower left to the upper right of the plot.
A) resembles a U-shaped curve.
B) extends from the upper left to the lower right of the plot.
C) resembles a bell-shaped curve.
D) extends from the lower left to the upper right of the plot.
Unlock Deck
Unlock for access to all 162 flashcards in this deck.
Unlock Deck
k this deck
25
On average, Caryl's school bus arrives on time, although sometimes it is a bit early or late. If the arrival times are distributed on a normal curve, which of the following statistics would enable Caryl to estimate the probability that her bus will arrive within 5 minutes of its scheduled arrival time on any given day?
A) median
B) mean
C) standard deviation
D) correlation coefficient
A) median
B) mean
C) standard deviation
D) correlation coefficient
Unlock Deck
Unlock for access to all 162 flashcards in this deck.
Unlock Deck
k this deck
26
Approximately 68 percent of the cases represented by the normal curve fall within ________ standard deviation(s) from the mean.
A) 1
B) 2
C) 3
D) 34
A) 1
B) 2
C) 3
D) 34
Unlock Deck
Unlock for access to all 162 flashcards in this deck.
Unlock Deck
k this deck
27
Which of the following correlation coefficients expresses the strongest degree of relationship between two variables?
A) +0.10
B) -0.67
C) -0.10
D) +0.59
A) +0.10
B) -0.67
C) -0.10
D) +0.59
Unlock Deck
Unlock for access to all 162 flashcards in this deck.
Unlock Deck
k this deck
28
Professor Woo noticed that the distribution of students' scores on her last biology test had an extremely small standard deviation. This indicates that the
A) test was given to a very small class of students.
B) test was a poor measure of the students' knowledge.
C) students generally performed very well on the test.
D) students' scores tended to be very similar to one another.
A) test was given to a very small class of students.
B) test was a poor measure of the students' knowledge.
C) students generally performed very well on the test.
D) students' scores tended to be very similar to one another.
Unlock Deck
Unlock for access to all 162 flashcards in this deck.
Unlock Deck
k this deck
29
A scatterplot graphically depicts the
A) standard deviation of a distribution of scores.
B) arithmetic average of a distribution of scores.
C) total population from which samples may be drawn.
D) degree of relationship between two variables.
A) standard deviation of a distribution of scores.
B) arithmetic average of a distribution of scores.
C) total population from which samples may be drawn.
D) degree of relationship between two variables.
Unlock Deck
Unlock for access to all 162 flashcards in this deck.
Unlock Deck
k this deck
30
If a set of standardized test scores is normally distributed, having a mean of 75 and a standard deviation of 6, approximately 95 percent of the scores are somewhere between
A) 72 and 78.
B) 75 and 87.
C) 69 and 81.
D) 63 and 87.
A) 72 and 78.
B) 75 and 87.
C) 69 and 81.
D) 63 and 87.
Unlock Deck
Unlock for access to all 162 flashcards in this deck.
Unlock Deck
k this deck
31
Approximately what percentage of the cases represented by the normal curve fall between -2 and +2 standard deviations from the mean?
A) 34
B) 68
C) 95
D) 100
A) 34
B) 68
C) 95
D) 100
Unlock Deck
Unlock for access to all 162 flashcards in this deck.
Unlock Deck
k this deck
32
If IQ scores are normally distributed, having a mean of 100 and a standard deviation of 15, approximately what percentage of people have IQ scores between 55 and 145?
A) 34
B) 68
C) 95
D) 100
A) 34
B) 68
C) 95
D) 100
Unlock Deck
Unlock for access to all 162 flashcards in this deck.
Unlock Deck
k this deck
33
Which of the following statistical measures is most helpful for indicating the extent to which people's happiness predicts the number of friends they have?
A) standard deviation
B) median
C) mean
D) correlation coefficient
A) standard deviation
B) median
C) mean
D) correlation coefficient
Unlock Deck
Unlock for access to all 162 flashcards in this deck.
Unlock Deck
k this deck
34
Which statistical phenomenon refers to the tendency for extraordinary or unusual events to be followed by more ordinary events?
A) the standard deviation
B) the normal curve
C) regression toward the mean
D) illusory correlation
A) the standard deviation
B) the normal curve
C) regression toward the mean
D) illusory correlation
Unlock Deck
Unlock for access to all 162 flashcards in this deck.
Unlock Deck
k this deck
35
If the points on a scatterplot are clustered in a pattern that extends from lower left to upper right, this would suggest that the two variables depicted are
A) normally distributed.
B) positively correlated.
C) negatively correlated.
D) not correlated.
A) normally distributed.
B) positively correlated.
C) negatively correlated.
D) not correlated.
Unlock Deck
Unlock for access to all 162 flashcards in this deck.
Unlock Deck
k this deck
36
A normal curve would be LEAST likely to characterize a large random sample of
A) body weights.
B) intelligence scores.
C) family incomes.
D) professional baseball batting averages.
A) body weights.
B) intelligence scores.
C) family incomes.
D) professional baseball batting averages.
Unlock Deck
Unlock for access to all 162 flashcards in this deck.
Unlock Deck
k this deck
37
Students who score much higher on an exam than they usually do can reasonably anticipate ________ scores when they are retested?
A) very low
B) somewhat lower
C) equally high
D) even higher
A) very low
B) somewhat lower
C) equally high
D) even higher
Unlock Deck
Unlock for access to all 162 flashcards in this deck.
Unlock Deck
k this deck
38
A correlation coefficient is a statistical measure of the
A) difference between the highest and lowest scores in a distribution.
B) extent to which two factors vary together.
C) statistical significance of a difference between two sample means.
D) frequency of scores at each level of some measure.
A) difference between the highest and lowest scores in a distribution.
B) extent to which two factors vary together.
C) statistical significance of a difference between two sample means.
D) frequency of scores at each level of some measure.
Unlock Deck
Unlock for access to all 162 flashcards in this deck.
Unlock Deck
k this deck
39
To calculate the numerical value of the standard deviation, it would be most reasonable to first compute the value of the
A) mean.
B) mode.
C) correlation coefficient.
D) median.
A) mean.
B) mode.
C) correlation coefficient.
D) median.
Unlock Deck
Unlock for access to all 162 flashcards in this deck.
Unlock Deck
k this deck
40
Which of the following correlations between annual income and education level would best enable you to predict annual income on the basis of level of education?
A) +0.05
B) -0.01
C) +0.10
D) +0.50
A) +0.05
B) -0.01
C) +0.10
D) +0.50
Unlock Deck
Unlock for access to all 162 flashcards in this deck.
Unlock Deck
k this deck
41
A random sample of females was observed to exhibit a lower average level of self-esteem than a random sample of males. To assess the likelihood that this observed difference reflects a real difference in the average self-esteem of the total population of males and females, it is necessary to
A) construct a scatterplot.
B) calculate a correlation coefficient.
C) plot the distribution of self-esteem levels among all males and females.
D) conduct a test of statistical significance.
A) construct a scatterplot.
B) calculate a correlation coefficient.
C) plot the distribution of self-esteem levels among all males and females.
D) conduct a test of statistical significance.
Unlock Deck
Unlock for access to all 162 flashcards in this deck.
Unlock Deck
k this deck
42
To compare verbal intelligence at different age levels, researchers tested and retested a group of children from the time they were 2 until they reached the age of 20. The researcher were clearly using a
A) longitudinal study.
B) correlation coefficient.
C) cross-sectional study.
D) regression toward the mean.
A) longitudinal study.
B) correlation coefficient.
C) cross-sectional study.
D) regression toward the mean.
Unlock Deck
Unlock for access to all 162 flashcards in this deck.
Unlock Deck
k this deck
43
The ________ can be a particularly misleading indication of what is average for a ________ distribution of scores.
A) mean; skewed
B) median; skewed
C) mean; normal
D) median; normal
A) mean; skewed
B) median; skewed
C) mean; normal
D) median; normal
Unlock Deck
Unlock for access to all 162 flashcards in this deck.
Unlock Deck
k this deck
44
Research in which the same group is tested and retested over a period of years is a
A) cross-sectional study.
B) scatterplot.
C) longitudinal study.
D) regression toward the mean.
A) cross-sectional study.
B) scatterplot.
C) longitudinal study.
D) regression toward the mean.
Unlock Deck
Unlock for access to all 162 flashcards in this deck.
Unlock Deck
k this deck
45
Ahmed has five sisters who are 3, 3, 5, 9, and 10 years of age. The number "5" represents the ________ of the sisters' ages.
A) mode
B) median
C) mean
D) range
A) mode
B) median
C) mean
D) range
Unlock Deck
Unlock for access to all 162 flashcards in this deck.
Unlock Deck
k this deck
46
To test for age differences in intelligence, at the beginning of the school year a researcher gave the same mathematics test to groups of children who were 8, 10, 12, and 14 years of age. This procedure best illustrates a
A) scatterplot.
B) longitudinal study.
C) standard deviation.
D) cross-sectional study.
A) scatterplot.
B) longitudinal study.
C) standard deviation.
D) cross-sectional study.
Unlock Deck
Unlock for access to all 162 flashcards in this deck.
Unlock Deck
k this deck
47
The maximum height of a normal curve corresponds to the ________ of a normal distribution.
A) range
B) mean
C) standard deviation
D) statistical significance
A) range
B) mean
C) standard deviation
D) statistical significance
Unlock Deck
Unlock for access to all 162 flashcards in this deck.
Unlock Deck
k this deck
48
Statistical significance refers to whether research
A) variables are causally related.
B) participants were randomly assigned to conditions.
C) findings are due to chance variations.
D) results add support to previous findings.
A) variables are causally related.
B) participants were randomly assigned to conditions.
C) findings are due to chance variations.
D) results add support to previous findings.
Unlock Deck
Unlock for access to all 162 flashcards in this deck.
Unlock Deck
k this deck
49
When people's symptoms of emotional distress are at their worst, whatever they do to try to alleviate the condition is likely to be followed by improvement rather than further deterioration. This is best explained in terms of
A) the standard deviation.
B) illusory correlation.
C) the "decline effect."
D) regression toward the mean.
A) the standard deviation.
B) illusory correlation.
C) the "decline effect."
D) regression toward the mean.
Unlock Deck
Unlock for access to all 162 flashcards in this deck.
Unlock Deck
k this deck
50
When interpreting the results of cross-sectional studies, it is especially important to consider the effects of ________ between generations.
A) the standard deviation
B) social-cultural differences
C) scatterplots
D) the normal curve
A) the standard deviation
B) social-cultural differences
C) scatterplots
D) the normal curve
Unlock Deck
Unlock for access to all 162 flashcards in this deck.
Unlock Deck
k this deck
51
After his property was vandalized by a small group of teenagers, Mr. Majka concluded that most teenagers are irresponsible and delinquent. Mr. Majka ought to be reminded that accurate generalizations depend on
A) a realization that random events may not look random.
B) an awareness of regression toward the mean.
C) the observation of representative samples.
D) the selection of samples from a skewed population.
A) a realization that random events may not look random.
B) an awareness of regression toward the mean.
C) the observation of representative samples.
D) the selection of samples from a skewed population.
Unlock Deck
Unlock for access to all 162 flashcards in this deck.
Unlock Deck
k this deck
52
Faustin, a member of his college's golf team, has an opportunity to play against a nationally acclaimed professional golfer. How many holes of golf should Faustin choose to play with the professional in order to maximize his own slim chances of winning?
A) 9
B) 18
C) 27
D) 36
A) 9
B) 18
C) 27
D) 36
Unlock Deck
Unlock for access to all 162 flashcards in this deck.
Unlock Deck
k this deck
53
Although Shien once scored 37 points during a single high school basketball game, he was subsequently unable to beat or match this record no matter how hard he tried. His experience may be at least partially explained in terms of
A) regression toward the mean.
B) the standard deviation.
C) an illusion of control.
D) illusory correlation.
A) regression toward the mean.
B) the standard deviation.
C) an illusion of control.
D) illusory correlation.
Unlock Deck
Unlock for access to all 162 flashcards in this deck.
Unlock Deck
k this deck
54
Unusual ESP subjects who defy chance when first tested nearly always lose their "psychic powers" when retested. This best illustrates
A) illusory correlation.
B) regression toward the mean.
C) the standard deviation.
D) the normal curve.
A) illusory correlation.
B) regression toward the mean.
C) the standard deviation.
D) the normal curve.
Unlock Deck
Unlock for access to all 162 flashcards in this deck.
Unlock Deck
k this deck
55
An observed difference between two sample groups is more likely to be statistically significant if
A) the observed difference is small.
B) the sample groups are small.
C) the standard deviations of the sample groups are small.
D) both samples are drawn from the same population.
A) the observed difference is small.
B) the sample groups are small.
C) the standard deviations of the sample groups are small.
D) both samples are drawn from the same population.
Unlock Deck
Unlock for access to all 162 flashcards in this deck.
Unlock Deck
k this deck
56
If half the students at Quincy College have blue eyes, which of the following events is most probable?
A) In a Quincy College class consisting of 15 students, 80% or more have blue eyes.
B) In a Quincy College class consisting of 30 students, 80% or more have blue eyes.
C) In a Quincy College class consisting of 45 students, 80% or more have blue eyes.
D) All the above are equally probable.
A) In a Quincy College class consisting of 15 students, 80% or more have blue eyes.
B) In a Quincy College class consisting of 30 students, 80% or more have blue eyes.
C) In a Quincy College class consisting of 45 students, 80% or more have blue eyes.
D) All the above are equally probable.
Unlock Deck
Unlock for access to all 162 flashcards in this deck.
Unlock Deck
k this deck
57
As the size of a sample ________, the size of the standard deviation is most likely to ________.
A) increases; increase
B) increases; decrease
C) decreases; remain the same
D) increases or decreases; remain the same
A) increases; increase
B) increases; decrease
C) decreases; remain the same
D) increases or decreases; remain the same
Unlock Deck
Unlock for access to all 162 flashcards in this deck.
Unlock Deck
k this deck
58
One can most accurately estimate a population mean if a sample is
A) large in size and low in variability.
B) small in size and high in variability.
C) large in size and high in variability.
D) small in size and low in variability.
A) large in size and low in variability.
B) small in size and high in variability.
C) large in size and high in variability.
D) small in size and low in variability.
Unlock Deck
Unlock for access to all 162 flashcards in this deck.
Unlock Deck
k this deck
59
The average scores of two samples taken from the same population are most likely to differ if
A) the samples are both small.
B) the standard deviations of the samples are both small.
C) the samples differ from each other in size.
D) the sample means are both similar to the sample medians.
A) the samples are both small.
B) the standard deviations of the samples are both small.
C) the samples differ from each other in size.
D) the sample means are both similar to the sample medians.
Unlock Deck
Unlock for access to all 162 flashcards in this deck.
Unlock Deck
k this deck
60
The ________ is a measure of ________.
A) median; variation
B) range; central tendency
C) standard deviation; variation
D) correlation coefficient; central tendency
A) median; variation
B) range; central tendency
C) standard deviation; variation
D) correlation coefficient; central tendency
Unlock Deck
Unlock for access to all 162 flashcards in this deck.
Unlock Deck
k this deck
61
In which type of study are the same people tested and retested over a period of years?
A) cross-sectional
B) correlational
C) longitudinal
D) scatterplot
A) cross-sectional
B) correlational
C) longitudinal
D) scatterplot
Unlock Deck
Unlock for access to all 162 flashcards in this deck.
Unlock Deck
k this deck
62
The first step in constructing a bar graph is to
A) measure the standard deviation.
B) organize the data.
C) calculate a correlation coefficient.
D) determine the range.
A) measure the standard deviation.
B) organize the data.
C) calculate a correlation coefficient.
D) determine the range.
Unlock Deck
Unlock for access to all 162 flashcards in this deck.
Unlock Deck
k this deck
63
One person in a 10-person group is 10 times older than any of the other members. With respect to age, it is MOST likely that the majority of group members are younger than the group's
A) mode.
B) median.
C) mean.
D) standard deviation.
A) mode.
B) median.
C) mean.
D) standard deviation.
Unlock Deck
Unlock for access to all 162 flashcards in this deck.
Unlock Deck
k this deck
64
In a normal distribution, what percentage of scores fall between -1 and +1 standard deviation units of the mean?
A) 50 percent
B) 68 percent
C) 95 percent
D) 99.7 percent
A) 50 percent
B) 68 percent
C) 95 percent
D) 99.7 percent
Unlock Deck
Unlock for access to all 162 flashcards in this deck.
Unlock Deck
k this deck
65
What is the mean of the following distribution of scores: 2, 5, 8, 10, 11, 4, 6, 9, 1, 4?
A) 2
B) 10
C) 6
D) 15
A) 2
B) 10
C) 6
D) 15
Unlock Deck
Unlock for access to all 162 flashcards in this deck.
Unlock Deck
k this deck
66
Differences between two samples are LEAST likely to be statistically significant if the samples are ________ and the standard deviations of the samples are ________.
A) small; small
B) large; large
C) small; large
D) large; small
A) small; small
B) large; large
C) small; large
D) large; small
Unlock Deck
Unlock for access to all 162 flashcards in this deck.
Unlock Deck
k this deck
67
What is the median of the following distribution: 10, 7, 5, 11, 8, 6, 9?
A) 6
B) 7
C) 8
D) 9
A) 6
B) 7
C) 8
D) 9
Unlock Deck
Unlock for access to all 162 flashcards in this deck.
Unlock Deck
k this deck
68
Which of the following sets of scores would likely be most representative of the population from which it was drawn?
A) a sample with a relatively large standard deviation
B) a sample with a relatively small standard deviation
C) a sample with a relatively large range
D) a sample with a relatively small range.
A) a sample with a relatively large standard deviation
B) a sample with a relatively small standard deviation
C) a sample with a relatively large range
D) a sample with a relatively small range.
Unlock Deck
Unlock for access to all 162 flashcards in this deck.
Unlock Deck
k this deck
69
Why is the median at times a better measure of central tendency than the mean?
A) It is more sensitive to extreme scores.
B) It is less sensitive to extreme scores.
C) It is based on more of the scores in the distribution than the mean.
D) It is the arithmetic average.
A) It is more sensitive to extreme scores.
B) It is less sensitive to extreme scores.
C) It is based on more of the scores in the distribution than the mean.
D) It is the arithmetic average.
Unlock Deck
Unlock for access to all 162 flashcards in this deck.
Unlock Deck
k this deck
70
The following scatterplot depicts a correlation coefficient that would be close to
A) +1.0.
B) -1.0.
C) 0.00.
D) 0.50.
A) +1.0.
B) -1.0.
C) 0.00.
D) 0.50.
Unlock Deck
Unlock for access to all 162 flashcards in this deck.
Unlock Deck
k this deck
71
The value of the correlation coefficient indicates the ________ of relationship between two variables, and the sign (positive or negative) indicates the ________ of the relationship.
A) direction; strength
B) strength; direction
C) direction; reliability
D) reliability; strength
A) direction; strength
B) strength; direction
C) direction; reliability
D) reliability; strength
Unlock Deck
Unlock for access to all 162 flashcards in this deck.
Unlock Deck
k this deck
72
Standard deviation is to mode as ________ is to ________.
A) mean; median
B) variation; central tendency
C) median; mean
D) central tendency; variation
A) mean; median
B) variation; central tendency
C) median; mean
D) central tendency; variation
Unlock Deck
Unlock for access to all 162 flashcards in this deck.
Unlock Deck
k this deck
73
Which statistic is the average amount by which the scores in a distribution vary from the average?
A) standard deviation
B) range
C) median
D) mode
A) standard deviation
B) range
C) median
D) mode
Unlock Deck
Unlock for access to all 162 flashcards in this deck.
Unlock Deck
k this deck
74
What is the mode of the following distribution of scores: 2, 2, 4, 4, 4, 14?
A) 2
B) 4
C) 5
D) 6
A) 2
B) 4
C) 5
D) 6
Unlock Deck
Unlock for access to all 162 flashcards in this deck.
Unlock Deck
k this deck
75
The most frequently occurring score in a distribution is the
A) mean.
B) median.
C) mode.
D) range.
A) mean.
B) median.
C) mode.
D) range.
Unlock Deck
Unlock for access to all 162 flashcards in this deck.
Unlock Deck
k this deck
76
The precision with which sample statistics reflect population parameters is greater when the sample is
A) large.
B) characterized by high variability.
C) small in number but consists of vivid cases.
D) statistically significant.
A) large.
B) characterized by high variability.
C) small in number but consists of vivid cases.
D) statistically significant.
Unlock Deck
Unlock for access to all 162 flashcards in this deck.
Unlock Deck
k this deck
77
If a difference between two samples is NOT statistically significant, which of the following can be concluded?
A) The difference is probably not a true one.
B) The difference is probably not reliable.
C) The difference could be due to sampling variation.
D) All of these statements are true.
A) The difference is probably not a true one.
B) The difference is probably not reliable.
C) The difference could be due to sampling variation.
D) All of these statements are true.
Unlock Deck
Unlock for access to all 162 flashcards in this deck.
Unlock Deck
k this deck
78
Which of the following is true of the cross-sectional method?
A) It compares people of different ages with one another.
B) It studies the same group of people at different times.
C) It tends to paint too favorable a picture of the effects of aging on intelligence.
D) It is more appropriate than the longitudinal method for studying intellectual change over the life span.
Unlock Deck
Unlock for access to all 162 flashcards in this deck.
Unlock Deck
k this deck
79
In the following distribution, the mean is ________ the mode and ________ the median: 4, 6, 1, 4, 5.
A) less than; less than
B) less than; greater than
C) equal to; equal to
D) greater than; equal to
A) less than; less than
B) less than; greater than
C) equal to; equal to
D) greater than; equal to
Unlock Deck
Unlock for access to all 162 flashcards in this deck.
Unlock Deck
k this deck
80
The ________ is a measure of ________.
A) standard deviation; central tendency
B) mean; variation
C) median; central tendency
D) mode; variation
A) standard deviation; central tendency
B) mean; variation
C) median; central tendency
D) mode; variation
Unlock Deck
Unlock for access to all 162 flashcards in this deck.
Unlock Deck
k this deck
Unlock Deck
Unlock for access to all 162 flashcards in this deck.


