Deck 8: Aggregate Expenditure and Equilibrium Output
Full screen (f)
Question
Refer to the information provided in Figure 8.2 below to answer the questions that follow. 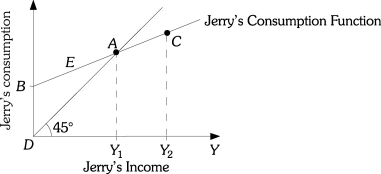 Figure 8.2
Refer to Figure 8.2.The line segment BD represents Jerry's
A)consumption when income equals Y1.
B)saving when income equals zero.
C)saving when income is Y1.
D)consumption when income equals zero.
Figure 8.2Refer to Figure 8.2.The line segment BD represents Jerry's
A)consumption when income equals Y1.
B)saving when income equals zero.
C)saving when income is Y1.
D)consumption when income equals zero.
Question
Refer to the information provided in Figure 8.1 below to answer the questions that follow. 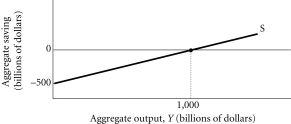 Figure 8.1
Refer to Figure 8.1.The MPS for this household is ________ and the MPC is ________.
A)0.4;0.6
B)0.5;0.5
C)0.2;0.8
D)0.3;0.7
Figure 8.1Refer to Figure 8.1.The MPS for this household is ________ and the MPC is ________.
A)0.4;0.6
B)0.5;0.5
C)0.2;0.8
D)0.3;0.7
Question
Question
Question
Question
Question
Question
Question
Refer to the information provided in Figure 8.1 below to answer the questions that follow. Figure 8.1
Refer to Figure 8.1.The equation for this household's saving function is
A)S = -200 + 0.8Y.
B)S = -300 + 0.25Y.
C)S = -500 + 0.5Y.
D)S = -1,000 + 0.8Y.
Figure 8.1Refer to Figure 8.1.The equation for this household's saving function is
A)S = -200 + 0.8Y.
B)S = -300 + 0.25Y.
C)S = -500 + 0.5Y.
D)S = -1,000 + 0.8Y.
Question
Refer to the information provided in Figure 8.1 below to answer the questions that follow. Figure 8.1
Refer to Figure 8.1.This household consumes $2,000 at an income level of
A)$3,000.
B)$2,275.
C)$2,000.
D)$1,840.
Figure 8.1Refer to Figure 8.1.This household consumes $2,000 at an income level of
A)$3,000.
B)$2,275.
C)$2,000.
D)$1,840.
Question
Refer to the information provided in Figure 8.1 below to answer the questions that follow. Figure 8.1
Refer to Figure 8.1.This household's consumption function is
A)C = 200 + 0.2Y.
B)C = 300 + 0.75Y.
C)C = 500 + 0.5Y.
D)C = 1,000 + 0.2Y.
Figure 8.1Refer to Figure 8.1.This household's consumption function is
A)C = 200 + 0.2Y.
B)C = 300 + 0.75Y.
C)C = 500 + 0.5Y.
D)C = 1,000 + 0.2Y.
Question
Refer to the information provided in Figure 8.1 below to answer the questions that follow. Figure 8.1
Refer to Figure 8.1.At income level $1,500,this household's saving is ________ than (to)zero and this household's consumption is ________ zero.
A)less than;greater than
B)equal to;equal to
C)greater than;less than
D)greater than;greater than
Figure 8.1Refer to Figure 8.1.At income level $1,500,this household's saving is ________ than (to)zero and this household's consumption is ________ zero.
A)less than;greater than
B)equal to;equal to
C)greater than;less than
D)greater than;greater than
Question
Question
Refer to the information provided in Figure 8.1 below to answer the questions that follow. Figure 8.1
Refer to Figure 8.1.An increase in the amount of consumption this household makes when this household's income is zero
A)makes the consumption function steeper.
B)makes the saving function flatter.
C)shifts the consumption function downward.
D)shifts the saving function downward.
Figure 8.1Refer to Figure 8.1.An increase in the amount of consumption this household makes when this household's income is zero
A)makes the consumption function steeper.
B)makes the saving function flatter.
C)shifts the consumption function downward.
D)shifts the saving function downward.
Question
Refer to the information provided in Figure 8.1 below to answer the questions that follow. Figure 8.1
Refer to Figure 8.1.This household saves -$300 at an income level of
A)$400.
B)$300
C)$250.
D)$125.
Figure 8.1Refer to Figure 8.1.This household saves -$300 at an income level of
A)$400.
B)$300
C)$250.
D)$125.
Question
Question
Question
Question
Refer to the information provided in Figure 8.1 below to answer the questions that follow. Figure 8.1
Refer to Figure 8.1.An increase in the MPC
A)makes the consumption function flatter.
B)makes the saving function flatter.
C)shifts the consumption function upward.
D)shifts the saving function downward.
Figure 8.1Refer to Figure 8.1.An increase in the MPC
A)makes the consumption function flatter.
B)makes the saving function flatter.
C)shifts the consumption function upward.
D)shifts the saving function downward.
Question
Question
Question
Refer to the information provided in Figure 8.2 below to answer the questions that follow. Figure 8.2
Refer to Figure 8.2.Positive saving occurs along the line segment
A)BC.
B)DC.
C)AC.
D)BA.
Figure 8.2Refer to Figure 8.2.Positive saving occurs along the line segment
A)BC.
B)DC.
C)AC.
D)BA.
Question
Refer to the information provided in Figure 8.2 below to answer the questions that follow. Figure 8.2
Refer to Figure 8.2.Along the segment AB,Jerry's
A)consumption is less than his income.
B)saving is positive.
C)consumption equals his income.
D)saving is negative.
Figure 8.2Refer to Figure 8.2.Along the segment AB,Jerry's
A)consumption is less than his income.
B)saving is positive.
C)consumption equals his income.
D)saving is negative.
Question
Refer to the information provided in Figure 8.2 below to answer the questions that follow. Figure 8.2
Refer to Figure 8.2.Suppose Jerry's MPC increases,and the vertical intercept of the consumption function does not change.At income Y1,Jerry's
A)consumption will be greater than his income.
B)consumption will be less than his income.
C)saving will be zero.
D)all of the above
Figure 8.2Refer to Figure 8.2.Suppose Jerry's MPC increases,and the vertical intercept of the consumption function does not change.At income Y1,Jerry's
A)consumption will be greater than his income.
B)consumption will be less than his income.
C)saving will be zero.
D)all of the above
Question
Question
Question
Question
Refer to the information provided in Figure 8.2 below to answer the questions that follow. Figure 8.2
Refer to Figure 8.2.An increase in Jerry's income is represented by
A)an upward shift in Jerry's consumption function.
B)an increase in the slope of Jerry's consumption function.
C)a movement from Point B to A.
D)none of the above
Figure 8.2Refer to Figure 8.2.An increase in Jerry's income is represented by
A)an upward shift in Jerry's consumption function.
B)an increase in the slope of Jerry's consumption function.
C)a movement from Point B to A.
D)none of the above
Question
Question
Question
Refer to the information provided in Figure 8.2 below to answer the questions that follow. Figure 8.2
Refer to Figure 8.2.Jerry's saving equals zero at income level
A)zero.
B)Y1.
C)Y2.
D)Y2 - Y1.
Figure 8.2Refer to Figure 8.2.Jerry's saving equals zero at income level
A)zero.
B)Y1.
C)Y2.
D)Y2 - Y1.
Question
Refer to the information provided in Figure 8.2 below to answer the questions that follow. Figure 8.2
Refer to Figure 8.2.Jerry's consumption equals his income at Point
A)A.
B)B.
C)C.
D)D.
Figure 8.2Refer to Figure 8.2.Jerry's consumption equals his income at Point
A)A.
B)B.
C)C.
D)D.
Question
Question
Question
Question
Question
Question
Question
Question
Refer to the information provided in Figure 8.2 below to answer the questions that follow. Figure 8.2
Refer to Figure 8.2.Along the line segment AC,Jerry's
A)consumption equals his income.
B)consumption is greater than his income.
C)saving is zero.
D)saving is positive.
Figure 8.2Refer to Figure 8.2.Along the line segment AC,Jerry's
A)consumption equals his income.
B)consumption is greater than his income.
C)saving is zero.
D)saving is positive.
Question
Refer to the information provided in Table 8.1 below to answer the questions that follow.
Table 8.1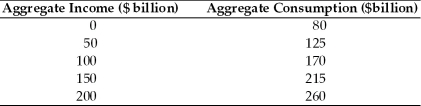
Refer to Table 8.1.Assuming society's MPC is constant at an aggregate of income of $300,aggregate consumption would be
A)$425.
B)$350.
C)$325.
D)$305.
Table 8.1
Refer to Table 8.1.Assuming society's MPC is constant at an aggregate of income of $300,aggregate consumption would be
A)$425.
B)$350.
C)$325.
D)$305.
Question
Refer to the information provided in Table 8.1 below to answer the questions that follow.
Table 8.1
Refer to Table 8.1.The equation for the aggregate consumption function is
A)C = 80 + 0.95Y.
B)C = 80 + 0.9Y.
C)C = 80 + 0.75Y.
D)C = -80 + 0.45Y.
Table 8.1
Refer to Table 8.1.The equation for the aggregate consumption function is
A)C = 80 + 0.95Y.
B)C = 80 + 0.9Y.
C)C = 80 + 0.75Y.
D)C = -80 + 0.45Y.
Question
Refer to the information provided in Figure 8.4 below to answer the questions that follow. 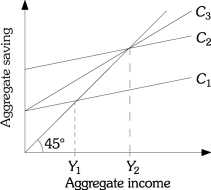 Figure 8.4
Refer to Figure 8.4.Which consumption function has the largest MPC?
A)C1.
B)C2.
C)C3.
D)cannot be determined from the figure
Figure 8.4Refer to Figure 8.4.Which consumption function has the largest MPC?
A)C1.
B)C2.
C)C3.
D)cannot be determined from the figure
Question
Refer to the information provided in Table 8.2 below to answer the questions that follow.
Table 8.2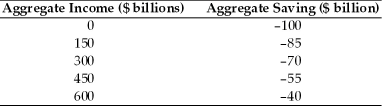
Refer to Table 8.2.Assuming society's MPC is constant,at an aggregate income level of $900,aggregate consumption would be
A)$665.
B)$910.
C)$1,200.
D)$1,750.
Table 8.2
Refer to Table 8.2.Assuming society's MPC is constant,at an aggregate income level of $900,aggregate consumption would be
A)$665.
B)$910.
C)$1,200.
D)$1,750.
Question
Refer to the information provided in Figure 8.4 below to answer the questions that follow. Figure 8.4
Refer to Figure 8.4.Suppose the consumption function for C1 = 20 + 0.5Y,the consumption function that best fits C3 is
A)C3 = 20 + 0.8Y.
B)C3 = 20 + 0.4Y.
C)C3 = 40 + 0.5Y.
D)C3 = 40 + 0.4Y.
Figure 8.4Refer to Figure 8.4.Suppose the consumption function for C1 = 20 + 0.5Y,the consumption function that best fits C3 is
A)C3 = 20 + 0.8Y.
B)C3 = 20 + 0.4Y.
C)C3 = 40 + 0.5Y.
D)C3 = 40 + 0.4Y.
Question
Refer to the information provided in Figure 8.3 below to answer the questions that follow. 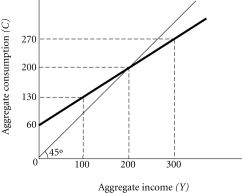 Figure 8.3
Refer to Figure 8.3.The equation for the aggregate saving function is
A)S = -60 + 0.3Y.
B)S = -200 + 0.6Y.
C)S = -140 + 0.5Y.
D)S = -80 + 0.4Y
Figure 8.3Refer to Figure 8.3.The equation for the aggregate saving function is
A)S = -60 + 0.3Y.
B)S = -200 + 0.6Y.
C)S = -140 + 0.5Y.
D)S = -80 + 0.4Y
Question
Refer to the information provided in Figure 8.3 below to answer the questions that follow. Figure 8.3
Refer to Figure 8.3.For this society,aggregate saving is positive if aggregate income is
A)above zero.
B)between $0 and $150 billion.
C)equal to $200 billion.
D)above $200 billion.
Figure 8.3Refer to Figure 8.3.For this society,aggregate saving is positive if aggregate income is
A)above zero.
B)between $0 and $150 billion.
C)equal to $200 billion.
D)above $200 billion.
Question
Refer to the information provided in Table 8.2 below to answer the questions that follow.
Table 8.2
Refer to Table 8.2.The equation for the aggregate saving function is
A)S = -100 + 0.15Y.
B)S = -100 + 0.1Y.
C)S = -150 + 0.2Y.
D)S = -150 + 0.85Y.
Table 8.2
Refer to Table 8.2.The equation for the aggregate saving function is
A)S = -100 + 0.15Y.
B)S = -100 + 0.1Y.
C)S = -150 + 0.2Y.
D)S = -150 + 0.85Y.
Question
Refer to the information provided in Table 8.1 below to answer the questions that follow.
Table 8.1
Refer to Table 8.1.At an aggregate income level of $100,aggregate saving would be
A)-$70.
B)-$30.
C)$50.
D)$70.
Table 8.1
Refer to Table 8.1.At an aggregate income level of $100,aggregate saving would be
A)-$70.
B)-$30.
C)$50.
D)$70.
Question
Refer to the information provided in Figure 8.3 below to answer the questions that follow. Figure 8.3
Refer to Figure 8.3.The equation for the aggregate consumption function is
A)C = 140 + 0.5Y.
B)C = 60 + 0.7Y.
C)C = 80 + 0.6Y.
D)C = 60 + 0.4Y.
Figure 8.3Refer to Figure 8.3.The equation for the aggregate consumption function is
A)C = 140 + 0.5Y.
B)C = 60 + 0.7Y.
C)C = 80 + 0.6Y.
D)C = 60 + 0.4Y.
Question
Refer to the information provided in Figure 8.3 below to answer the questions that follow. Figure 8.3
Refer to Figure 8.3.Which of the following statements is FALSE?
A)Aggregate saving is negative for all income levels below $400 billion.
B)For all aggregate income levels above $200 billion,aggregate consumption is less than aggregate income.
C)If consumption is the only expenditure,this economy would be in equilibrium at an aggregate income level of $200 billion.
D)Saving is negative at all income levels below $200 billion.
Figure 8.3Refer to Figure 8.3.Which of the following statements is FALSE?
A)Aggregate saving is negative for all income levels below $400 billion.
B)For all aggregate income levels above $200 billion,aggregate consumption is less than aggregate income.
C)If consumption is the only expenditure,this economy would be in equilibrium at an aggregate income level of $200 billion.
D)Saving is negative at all income levels below $200 billion.
Question
Refer to the information provided in Table 8.1 below to answer the questions that follow.
Table 8.1
Refer to Table 8.1.Society's MPS is
A)0.05.
B)0.10.
C)0.20.
D)0.95.
Table 8.1
Refer to Table 8.1.Society's MPS is
A)0.05.
B)0.10.
C)0.20.
D)0.95.
Question
Refer to the information provided in Figure 8.3 below to answer the questions that follow. Figure 8.3
Refer to Figure 8.3.If aggregate income is $1,000 billion,then in this society aggregate saving is ________ billion.
A)$240
B)$300
C)$320
D)$550
Figure 8.3Refer to Figure 8.3.If aggregate income is $1,000 billion,then in this society aggregate saving is ________ billion.
A)$240
B)$300
C)$320
D)$550
Question
Refer to the information provided in Table 8.2 below to answer the questions that follow.
Table 8.2
Refer to Table 8.2.Assuming society's MPC is constant,at an aggregate income of $1,200 aggregate saving would be
A)$0.
B)$20.
C)$55.
D)$150.
Table 8.2
Refer to Table 8.2.Assuming society's MPC is constant,at an aggregate income of $1,200 aggregate saving would be
A)$0.
B)$20.
C)$55.
D)$150.
Question
Refer to the information provided in Figure 8.4 below to answer the questions that follow. Figure 8.4
Refer to Figure 8.4.The aggregate consumption functions C1 and C2
A)have the same MPC values.
B)imply different MPS values.
C)have the same autonomous consumption values.
D)have the same break-even values.
Figure 8.4Refer to Figure 8.4.The aggregate consumption functions C1 and C2
A)have the same MPC values.
B)imply different MPS values.
C)have the same autonomous consumption values.
D)have the same break-even values.
Question
Refer to the information provided in Figure 8.3 below to answer the questions that follow. Figure 8.3
Refer to Figure 8.3.In this economy,aggregate saving will be zero if income is
A)$100 billion.
B)$200 billion.
C)$300 billion.
D)$400 billion.
Figure 8.3Refer to Figure 8.3.In this economy,aggregate saving will be zero if income is
A)$100 billion.
B)$200 billion.
C)$300 billion.
D)$400 billion.
Question
Refer to the information provided in Table 8.2 below to answer the questions that follow.
Table 8.2
Refer to Table 8.2.Society's MPC is
A)0.1.
B)0.2.
C)0.8.
D)0.9.
Table 8.2
Refer to Table 8.2.Society's MPC is
A)0.1.
B)0.2.
C)0.8.
D)0.9.
Question
Refer to the information provided in Table 8.2 below to answer the questions that follow.
Table 8.2
Refer to Table 8.2.Society's MPS is
A)0.1.
B)0.2.
C)0.3.
D)0.9.
Table 8.2
Refer to Table 8.2.Society's MPS is
A)0.1.
B)0.2.
C)0.3.
D)0.9.
Question
Refer to the information provided in Table 8.1 below to answer the questions that follow.
Table 8.1
Refer to Table 8.1.Society's MPC is
A)0.95.
B)0.90.
C)0.80.
D)0.05.
Table 8.1
Refer to Table 8.1.Society's MPC is
A)0.95.
B)0.90.
C)0.80.
D)0.05.
Question
Refer to the information provided in Figure 8.4 below to answer the questions that follow. Figure 8.4
Refer to Figure 8.4.Suppose the consumption function for C1 = 10 + 0.8Y,the consumption function that best fits C2 is
A)C2 = 20 + 0.8Y.
B)C2 = 10 + 0.4Y.
C)C2 = 40 + 0.5Y.
D)C2 = 20 + 0.1Y.
Figure 8.4Refer to Figure 8.4.Suppose the consumption function for C1 = 10 + 0.8Y,the consumption function that best fits C2 is
A)C2 = 20 + 0.8Y.
B)C2 = 10 + 0.4Y.
C)C2 = 40 + 0.5Y.
D)C2 = 20 + 0.1Y.
Question
Refer to the information provided in Figure 8.4 below to answer the questions that follow. Figure 8.4
Refer to Figure 8.4.If income is Y1,aggregate consumption is the greatest when the aggregate consumption function is
A)C3.
B)C2.
C)C1.
D)cannot be determined from the figure
Figure 8.4Refer to Figure 8.4.If income is Y1,aggregate consumption is the greatest when the aggregate consumption function is
A)C3.
B)C2.
C)C1.
D)cannot be determined from the figure
Question
Question
Refer to the information provided in Figure 8.5 below to answer the questions that follow. 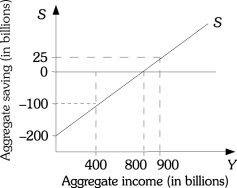 Figure 8.5
Refer to Figure 8.5.If aggregate income is $900 billion,aggregate consumption
A)is $25 billion.
B)is $800 billion.
C)is $875 billion.
D)cannot be determined from this information.
Figure 8.5Refer to Figure 8.5.If aggregate income is $900 billion,aggregate consumption
A)is $25 billion.
B)is $800 billion.
C)is $875 billion.
D)cannot be determined from this information.
Question
Question
Refer to the information provided in Figure 8.6 below to answer the questions that follow. 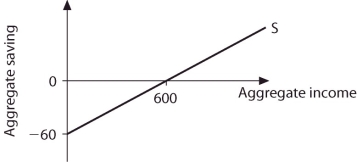 Figure 8.6
Refer to Figure 8.6.If aggregate income is $1,000,aggregate consumption is
A)$850.
B)$910.
C)$920.
D)$960.
Figure 8.6Refer to Figure 8.6.If aggregate income is $1,000,aggregate consumption is
A)$850.
B)$910.
C)$920.
D)$960.
Question
Question
Question
Refer to the information provided in Figure 8.6 below to answer the questions that follow. Figure 8.6
Refer to Figure 8.6.The MPS for this saving function is
A)0.4.
B)0.25.
C)0.2.
D)0.1.
Figure 8.6Refer to Figure 8.6.The MPS for this saving function is
A)0.4.
B)0.25.
C)0.2.
D)0.1.
Question
Question
Question
Refer to the information provided in Figure 8.5 below to answer the questions that follow. Figure 8.5
Refer to Figure 8.5.If aggregate income is $400 billion,aggregate saving is ________ billion.
A)-$300
B)-$100
C)$0
D)$500
Figure 8.5Refer to Figure 8.5.If aggregate income is $400 billion,aggregate saving is ________ billion.
A)-$300
B)-$100
C)$0
D)$500
Question
Question
Question
Question
Refer to the information provided in Figure 8.5 below to answer the questions that follow. Figure 8.5
Refer to Figure 8.5.The MPS for this saving function is
A)5.
B)4.
C)0.5.
D)0.25.
Figure 8.5Refer to Figure 8.5.The MPS for this saving function is
A)5.
B)4.
C)0.5.
D)0.25.
Question
Question
Question
Question
Refer to the information provided in Figure 8.4 below to answer the questions that follow. Figure 8.4
Refer to Figure 8.4.If income is Y2
A)the society's saving is negative along C1,C2,and C3.
B)the society's consumption is equal along C2 and C3.
C)the society's saving is positive along C2 and C3.
D)the society's savings is negative along C1.
Figure 8.4Refer to Figure 8.4.If income is Y2
A)the society's saving is negative along C1,C2,and C3.
B)the society's consumption is equal along C2 and C3.
C)the society's saving is positive along C2 and C3.
D)the society's savings is negative along C1.
Question
Refer to the information provided in Figure 8.6 below to answer the questions that follow. Figure 8.6
Refer to Figure 8.6.If aggregate income is $800,aggregate saving is
A)-$100.
B)-$20.
C)$20.
D)$40.
Figure 8.6Refer to Figure 8.6.If aggregate income is $800,aggregate saving is
A)-$100.
B)-$20.
C)$20.
D)$40.

Unlock Deck
Sign up to unlock the cards in this deck!
Unlock Deck
Unlock Deck
1/176
Play
Full screen (f)
Deck 8: Aggregate Expenditure and Equilibrium Output
1
Refer to the information provided in Figure 8.2 below to answer the questions that follow. Figure 8.2
Refer to Figure 8.2.The line segment BD represents Jerry's
A)consumption when income equals Y1.
B)saving when income equals zero.
C)saving when income is Y1.
D)consumption when income equals zero.
Figure 8.2Refer to Figure 8.2.The line segment BD represents Jerry's
A)consumption when income equals Y1.
B)saving when income equals zero.
C)saving when income is Y1.
D)consumption when income equals zero.
D
2
Refer to the information provided in Figure 8.1 below to answer the questions that follow. Figure 8.1
Refer to Figure 8.1.The MPS for this household is ________ and the MPC is ________.
A)0.4;0.6
B)0.5;0.5
C)0.2;0.8
D)0.3;0.7
Figure 8.1Refer to Figure 8.1.The MPS for this household is ________ and the MPC is ________.
A)0.4;0.6
B)0.5;0.5
C)0.2;0.8
D)0.3;0.7
B
3
The MPC is
A)the change in consumption divided by the change in income.
B)consumption divided by income.
C)the change in consumption divided by the change in saving.
D)the change in saving divided by the change in income.
A)the change in consumption divided by the change in income.
B)consumption divided by income.
C)the change in consumption divided by the change in saving.
D)the change in saving divided by the change in income.
A
4
The MPS is
A)the change in saving divided by the change in income.
B)1 + MPC.
C)income divided by saving.
D)total saving divided by total income.
A)the change in saving divided by the change in income.
B)1 + MPC.
C)income divided by saving.
D)total saving divided by total income.
Unlock Deck
Unlock for access to all 176 flashcards in this deck.
Unlock Deck
k this deck
5
Uncertainty about the future is likely to
A)increase current spending.
B)have no impact on current spending.
C)decrease current spending.
D)either increase or decrease current spending.
A)increase current spending.
B)have no impact on current spending.
C)decrease current spending.
D)either increase or decrease current spending.
Unlock Deck
Unlock for access to all 176 flashcards in this deck.
Unlock Deck
k this deck
6
In a closed economy with no government,aggregate expenditure is
A)consumption plus investment.
B)saving plus investment.
C)consumption plus the MPC.
D)MPC + MPS.
A)consumption plus investment.
B)saving plus investment.
C)consumption plus the MPC.
D)MPC + MPS.
Unlock Deck
Unlock for access to all 176 flashcards in this deck.
Unlock Deck
k this deck
7
Saving equals
A)Y - C.
B)Y - planned I.
C)Y - actual I.
D)inventory changes.
A)Y - C.
B)Y - planned I.
C)Y - actual I.
D)inventory changes.
Unlock Deck
Unlock for access to all 176 flashcards in this deck.
Unlock Deck
k this deck
8
If you earn additional $500 in disposable income one week for painting your neighbors house,
A)the total of your consumption and saving will increase by more than $500.
B)the total of your consumption and saving will increase by $500.
C)the total of your consumption and saving will increase by less than $500.
D)your consumption will increase by more than $500,even if your MPS is 0.1.
A)the total of your consumption and saving will increase by more than $500.
B)the total of your consumption and saving will increase by $500.
C)the total of your consumption and saving will increase by less than $500.
D)your consumption will increase by more than $500,even if your MPS is 0.1.
Unlock Deck
Unlock for access to all 176 flashcards in this deck.
Unlock Deck
k this deck
9
Refer to the information provided in Figure 8.1 below to answer the questions that follow. Figure 8.1
Refer to Figure 8.1.The equation for this household's saving function is
A)S = -200 + 0.8Y.
B)S = -300 + 0.25Y.
C)S = -500 + 0.5Y.
D)S = -1,000 + 0.8Y.
Figure 8.1Refer to Figure 8.1.The equation for this household's saving function is
A)S = -200 + 0.8Y.
B)S = -300 + 0.25Y.
C)S = -500 + 0.5Y.
D)S = -1,000 + 0.8Y.
Unlock Deck
Unlock for access to all 176 flashcards in this deck.
Unlock Deck
k this deck
10
Refer to the information provided in Figure 8.1 below to answer the questions that follow. Figure 8.1
Refer to Figure 8.1.This household consumes $2,000 at an income level of
A)$3,000.
B)$2,275.
C)$2,000.
D)$1,840.
Figure 8.1Refer to Figure 8.1.This household consumes $2,000 at an income level of
A)$3,000.
B)$2,275.
C)$2,000.
D)$1,840.
Unlock Deck
Unlock for access to all 176 flashcards in this deck.
Unlock Deck
k this deck
11
Refer to the information provided in Figure 8.1 below to answer the questions that follow. Figure 8.1
Refer to Figure 8.1.This household's consumption function is
A)C = 200 + 0.2Y.
B)C = 300 + 0.75Y.
C)C = 500 + 0.5Y.
D)C = 1,000 + 0.2Y.
Figure 8.1Refer to Figure 8.1.This household's consumption function is
A)C = 200 + 0.2Y.
B)C = 300 + 0.75Y.
C)C = 500 + 0.5Y.
D)C = 1,000 + 0.2Y.
Unlock Deck
Unlock for access to all 176 flashcards in this deck.
Unlock Deck
k this deck
12
Refer to the information provided in Figure 8.1 below to answer the questions that follow. Figure 8.1
Refer to Figure 8.1.At income level $1,500,this household's saving is ________ than (to)zero and this household's consumption is ________ zero.
A)less than;greater than
B)equal to;equal to
C)greater than;less than
D)greater than;greater than
Figure 8.1Refer to Figure 8.1.At income level $1,500,this household's saving is ________ than (to)zero and this household's consumption is ________ zero.
A)less than;greater than
B)equal to;equal to
C)greater than;less than
D)greater than;greater than
Unlock Deck
Unlock for access to all 176 flashcards in this deck.
Unlock Deck
k this deck
13
Consumption is
A)positively related to household income and wealth and households' expectations about the future,but negatively related to interest rates.
B)negatively related to household income and wealth,interest rates,and households' expectations about the future.
C)determined only by income.
D)positively related to household income and wealth,interest rates,and households' expectations about the future.
Unlock Deck
Unlock for access to all 176 flashcards in this deck.
Unlock Deck
k this deck
14
Refer to the information provided in Figure 8.1 below to answer the questions that follow. Figure 8.1
Refer to Figure 8.1.An increase in the amount of consumption this household makes when this household's income is zero
A)makes the consumption function steeper.
B)makes the saving function flatter.
C)shifts the consumption function downward.
D)shifts the saving function downward.
Figure 8.1Refer to Figure 8.1.An increase in the amount of consumption this household makes when this household's income is zero
A)makes the consumption function steeper.
B)makes the saving function flatter.
C)shifts the consumption function downward.
D)shifts the saving function downward.
Unlock Deck
Unlock for access to all 176 flashcards in this deck.
Unlock Deck
k this deck
15
Refer to the information provided in Figure 8.1 below to answer the questions that follow. Figure 8.1
Refer to Figure 8.1.This household saves -$300 at an income level of
A)$400.
B)$300
C)$250.
D)$125.
Figure 8.1Refer to Figure 8.1.This household saves -$300 at an income level of
A)$400.
B)$300
C)$250.
D)$125.
Unlock Deck
Unlock for access to all 176 flashcards in this deck.
Unlock Deck
k this deck
16
If the MPS is 0.60,MPC
A)is 1.60.
B)is 0.40.
C)is 0.30.
D)cannot be determined by the given information.
A)is 1.60.
B)is 0.40.
C)is 0.30.
D)cannot be determined by the given information.
Unlock Deck
Unlock for access to all 176 flashcards in this deck.
Unlock Deck
k this deck
17
If Logan received a $2,500 bonus and his MPS is 0.20,his consumption rises by $________ and his saving rises by $________.
A)500;100
B)2,500;200
C)2,000;500
D)2,500;20
A)500;100
B)2,500;200
C)2,000;500
D)2,500;20
Unlock Deck
Unlock for access to all 176 flashcards in this deck.
Unlock Deck
k this deck
18
Higher interest rates are likely to
A)have no effect on consumer spending or saving.
B)decrease consumer spending and increase consumer saving.
C)decrease both consumer spending and consumer saving.
D)increase consumer spending and decrease consumer saving.
A)have no effect on consumer spending or saving.
B)decrease consumer spending and increase consumer saving.
C)decrease both consumer spending and consumer saving.
D)increase consumer spending and decrease consumer saving.
Unlock Deck
Unlock for access to all 176 flashcards in this deck.
Unlock Deck
k this deck
19
Refer to the information provided in Figure 8.1 below to answer the questions that follow. Figure 8.1
Refer to Figure 8.1.An increase in the MPC
A)makes the consumption function flatter.
B)makes the saving function flatter.
C)shifts the consumption function upward.
D)shifts the saving function downward.
Figure 8.1Refer to Figure 8.1.An increase in the MPC
A)makes the consumption function flatter.
B)makes the saving function flatter.
C)shifts the consumption function upward.
D)shifts the saving function downward.
Unlock Deck
Unlock for access to all 176 flashcards in this deck.
Unlock Deck
k this deck
20
If Wanda's income is reduced to zero after she loses her job,her consumption will be ________ and her saving will be ________.
A)less than zero;less than zero
B)greater than zero;greater than zero
C)less than zero;greater than zero
D)greater than zero;less than zero
A)less than zero;less than zero
B)greater than zero;greater than zero
C)less than zero;greater than zero
D)greater than zero;less than zero
Unlock Deck
Unlock for access to all 176 flashcards in this deck.
Unlock Deck
k this deck
21
If Zander's saving function is of the form S = -150 + 0.5Y,his consumption equals his income at an income level of
A)150.
B)225.
C)300.
D)1,500.
A)150.
B)225.
C)300.
D)1,500.
Unlock Deck
Unlock for access to all 176 flashcards in this deck.
Unlock Deck
k this deck
22
Refer to the information provided in Figure 8.2 below to answer the questions that follow. Figure 8.2
Refer to Figure 8.2.Positive saving occurs along the line segment
A)BC.
B)DC.
C)AC.
D)BA.
Figure 8.2Refer to Figure 8.2.Positive saving occurs along the line segment
A)BC.
B)DC.
C)AC.
D)BA.
Unlock Deck
Unlock for access to all 176 flashcards in this deck.
Unlock Deck
k this deck
23
Refer to the information provided in Figure 8.2 below to answer the questions that follow. Figure 8.2
Refer to Figure 8.2.Along the segment AB,Jerry's
A)consumption is less than his income.
B)saving is positive.
C)consumption equals his income.
D)saving is negative.
Figure 8.2Refer to Figure 8.2.Along the segment AB,Jerry's
A)consumption is less than his income.
B)saving is positive.
C)consumption equals his income.
D)saving is negative.
Unlock Deck
Unlock for access to all 176 flashcards in this deck.
Unlock Deck
k this deck
24
Refer to the information provided in Figure 8.2 below to answer the questions that follow. Figure 8.2
Refer to Figure 8.2.Suppose Jerry's MPC increases,and the vertical intercept of the consumption function does not change.At income Y1,Jerry's
A)consumption will be greater than his income.
B)consumption will be less than his income.
C)saving will be zero.
D)all of the above
Figure 8.2Refer to Figure 8.2.Suppose Jerry's MPC increases,and the vertical intercept of the consumption function does not change.At income Y1,Jerry's
A)consumption will be greater than his income.
B)consumption will be less than his income.
C)saving will be zero.
D)all of the above
Unlock Deck
Unlock for access to all 176 flashcards in this deck.
Unlock Deck
k this deck
25
If the consumption function is of the form C = 80 + 0.4Y,the MPS equals
A)-0.6.
B)-0.4.
C)0.4.
D)0.6.
A)-0.6.
B)-0.4.
C)0.4.
D)0.6.
Unlock Deck
Unlock for access to all 176 flashcards in this deck.
Unlock Deck
k this deck
26
If the saving function is of the form S = -20 + 0.3Y,consumption at an income level of 200 is
A)80.
B)120.
C)160.
D)180.
A)80.
B)120.
C)160.
D)180.
Unlock Deck
Unlock for access to all 176 flashcards in this deck.
Unlock Deck
k this deck
27
If the MPS is 0.22,the MPC is
A)-0.22.
B)0.66.
C)0.78.
D)1.22.
A)-0.22.
B)0.66.
C)0.78.
D)1.22.
Unlock Deck
Unlock for access to all 176 flashcards in this deck.
Unlock Deck
k this deck
28
Refer to the information provided in Figure 8.2 below to answer the questions that follow. Figure 8.2
Refer to Figure 8.2.An increase in Jerry's income is represented by
A)an upward shift in Jerry's consumption function.
B)an increase in the slope of Jerry's consumption function.
C)a movement from Point B to A.
D)none of the above
Figure 8.2Refer to Figure 8.2.An increase in Jerry's income is represented by
A)an upward shift in Jerry's consumption function.
B)an increase in the slope of Jerry's consumption function.
C)a movement from Point B to A.
D)none of the above
Unlock Deck
Unlock for access to all 176 flashcards in this deck.
Unlock Deck
k this deck
29
If consumption is $10,000 when income is $10,000,and consumption increases to $11,000 when income increases to $12,000,the MPS is
A)0.10.
B)0.25.
C)0.50.
D)0.90.
A)0.10.
B)0.25.
C)0.50.
D)0.90.
Unlock Deck
Unlock for access to all 176 flashcards in this deck.
Unlock Deck
k this deck
30
If Lily's consumption function is of the form C = 100 + 0.8Y,her saving equals zero at an income level of
A)180.
B)500.
C)800.
D)cannot be determined from the given information
A)180.
B)500.
C)800.
D)cannot be determined from the given information
Unlock Deck
Unlock for access to all 176 flashcards in this deck.
Unlock Deck
k this deck
31
Refer to the information provided in Figure 8.2 below to answer the questions that follow. Figure 8.2
Refer to Figure 8.2.Jerry's saving equals zero at income level
A)zero.
B)Y1.
C)Y2.
D)Y2 - Y1.
Figure 8.2Refer to Figure 8.2.Jerry's saving equals zero at income level
A)zero.
B)Y1.
C)Y2.
D)Y2 - Y1.
Unlock Deck
Unlock for access to all 176 flashcards in this deck.
Unlock Deck
k this deck
32
Refer to the information provided in Figure 8.2 below to answer the questions that follow. Figure 8.2
Refer to Figure 8.2.Jerry's consumption equals his income at Point
A)A.
B)B.
C)C.
D)D.
Figure 8.2Refer to Figure 8.2.Jerry's consumption equals his income at Point
A)A.
B)B.
C)C.
D)D.
Unlock Deck
Unlock for access to all 176 flashcards in this deck.
Unlock Deck
k this deck
33
Suppose saving is $1,400 when income is $10,000 and the MPC equals 0.8.When income increases to $12,000,saving is
A)$1,680.
B)$1,800.
C)$2,200.
D)$3,000.
A)$1,680.
B)$1,800.
C)$2,200.
D)$3,000.
Unlock Deck
Unlock for access to all 176 flashcards in this deck.
Unlock Deck
k this deck
34
The fraction of a change in income that is consumed or spent is called
A)the marginal propensity of income.
B)the marginal propensity to save.
C)the marginal propensity to consume.
D)average consumption.
A)the marginal propensity of income.
B)the marginal propensity to save.
C)the marginal propensity to consume.
D)average consumption.
Unlock Deck
Unlock for access to all 176 flashcards in this deck.
Unlock Deck
k this deck
35
If consumption is $30,000 when income is $35,000,and consumption increases to $36,000 when income increases to $43,000,the MPC is
A)0.65.
B)0.75.
C)0.80.
D)0.95.
A)0.65.
B)0.75.
C)0.80.
D)0.95.
Unlock Deck
Unlock for access to all 176 flashcards in this deck.
Unlock Deck
k this deck
36
Suppose consumption is $60,000 when income is $90,000 and the MPS equals 0.25.When income increases to $100,000,consumption is
A)$90,250.
B)$85,000.
C)$70,000.
D)$67,500.
A)$90,250.
B)$85,000.
C)$70,000.
D)$67,500.
Unlock Deck
Unlock for access to all 176 flashcards in this deck.
Unlock Deck
k this deck
37
Suppose consumption is $5,000 when income is $8,000 and the MPC equals 0.9.When income increases to $10,000,consumption is
A)$2,700.
B)$4,500.
C)$6,800.
D)$7,200.
A)$2,700.
B)$4,500.
C)$6,800.
D)$7,200.
Unlock Deck
Unlock for access to all 176 flashcards in this deck.
Unlock Deck
k this deck
38
If you save $80 when you experience a $400 rise in your income,
A)your MPS is 0.25.
B)your MPC is 0.80.
C)your MPC is 0.85.
D)your MPS is 0.40.
A)your MPS is 0.25.
B)your MPC is 0.80.
C)your MPC is 0.85.
D)your MPS is 0.40.
Unlock Deck
Unlock for access to all 176 flashcards in this deck.
Unlock Deck
k this deck
39
If the MPS is 0.05,the MPC is
A)-0.05.
B)0.95.
C)1.05.
D)2.25.
A)-0.05.
B)0.95.
C)1.05.
D)2.25.
Unlock Deck
Unlock for access to all 176 flashcards in this deck.
Unlock Deck
k this deck
40
Refer to the information provided in Figure 8.2 below to answer the questions that follow. Figure 8.2
Refer to Figure 8.2.Along the line segment AC,Jerry's
A)consumption equals his income.
B)consumption is greater than his income.
C)saving is zero.
D)saving is positive.
Figure 8.2Refer to Figure 8.2.Along the line segment AC,Jerry's
A)consumption equals his income.
B)consumption is greater than his income.
C)saving is zero.
D)saving is positive.
Unlock Deck
Unlock for access to all 176 flashcards in this deck.
Unlock Deck
k this deck
41
Refer to the information provided in Table 8.1 below to answer the questions that follow.
Table 8.1
Refer to Table 8.1.Assuming society's MPC is constant at an aggregate of income of $300,aggregate consumption would be
A)$425.
B)$350.
C)$325.
D)$305.
Table 8.1
Refer to Table 8.1.Assuming society's MPC is constant at an aggregate of income of $300,aggregate consumption would be
A)$425.
B)$350.
C)$325.
D)$305.
Unlock Deck
Unlock for access to all 176 flashcards in this deck.
Unlock Deck
k this deck
42
Refer to the information provided in Table 8.1 below to answer the questions that follow.
Table 8.1
Refer to Table 8.1.The equation for the aggregate consumption function is
A)C = 80 + 0.95Y.
B)C = 80 + 0.9Y.
C)C = 80 + 0.75Y.
D)C = -80 + 0.45Y.
Table 8.1
Refer to Table 8.1.The equation for the aggregate consumption function is
A)C = 80 + 0.95Y.
B)C = 80 + 0.9Y.
C)C = 80 + 0.75Y.
D)C = -80 + 0.45Y.
Unlock Deck
Unlock for access to all 176 flashcards in this deck.
Unlock Deck
k this deck
43
Refer to the information provided in Figure 8.4 below to answer the questions that follow. Figure 8.4
Refer to Figure 8.4.Which consumption function has the largest MPC?
A)C1.
B)C2.
C)C3.
D)cannot be determined from the figure
Figure 8.4Refer to Figure 8.4.Which consumption function has the largest MPC?
A)C1.
B)C2.
C)C3.
D)cannot be determined from the figure
Unlock Deck
Unlock for access to all 176 flashcards in this deck.
Unlock Deck
k this deck
44
Refer to the information provided in Table 8.2 below to answer the questions that follow.
Table 8.2
Refer to Table 8.2.Assuming society's MPC is constant,at an aggregate income level of $900,aggregate consumption would be
A)$665.
B)$910.
C)$1,200.
D)$1,750.
Table 8.2
Refer to Table 8.2.Assuming society's MPC is constant,at an aggregate income level of $900,aggregate consumption would be
A)$665.
B)$910.
C)$1,200.
D)$1,750.
Unlock Deck
Unlock for access to all 176 flashcards in this deck.
Unlock Deck
k this deck
45
Refer to the information provided in Figure 8.4 below to answer the questions that follow. Figure 8.4
Refer to Figure 8.4.Suppose the consumption function for C1 = 20 + 0.5Y,the consumption function that best fits C3 is
A)C3 = 20 + 0.8Y.
B)C3 = 20 + 0.4Y.
C)C3 = 40 + 0.5Y.
D)C3 = 40 + 0.4Y.
Figure 8.4Refer to Figure 8.4.Suppose the consumption function for C1 = 20 + 0.5Y,the consumption function that best fits C3 is
A)C3 = 20 + 0.8Y.
B)C3 = 20 + 0.4Y.
C)C3 = 40 + 0.5Y.
D)C3 = 40 + 0.4Y.
Unlock Deck
Unlock for access to all 176 flashcards in this deck.
Unlock Deck
k this deck
46
Refer to the information provided in Figure 8.3 below to answer the questions that follow. Figure 8.3
Refer to Figure 8.3.The equation for the aggregate saving function is
A)S = -60 + 0.3Y.
B)S = -200 + 0.6Y.
C)S = -140 + 0.5Y.
D)S = -80 + 0.4Y
Figure 8.3Refer to Figure 8.3.The equation for the aggregate saving function is
A)S = -60 + 0.3Y.
B)S = -200 + 0.6Y.
C)S = -140 + 0.5Y.
D)S = -80 + 0.4Y
Unlock Deck
Unlock for access to all 176 flashcards in this deck.
Unlock Deck
k this deck
47
Refer to the information provided in Figure 8.3 below to answer the questions that follow. Figure 8.3
Refer to Figure 8.3.For this society,aggregate saving is positive if aggregate income is
A)above zero.
B)between $0 and $150 billion.
C)equal to $200 billion.
D)above $200 billion.
Figure 8.3Refer to Figure 8.3.For this society,aggregate saving is positive if aggregate income is
A)above zero.
B)between $0 and $150 billion.
C)equal to $200 billion.
D)above $200 billion.
Unlock Deck
Unlock for access to all 176 flashcards in this deck.
Unlock Deck
k this deck
48
Refer to the information provided in Table 8.2 below to answer the questions that follow.
Table 8.2
Refer to Table 8.2.The equation for the aggregate saving function is
A)S = -100 + 0.15Y.
B)S = -100 + 0.1Y.
C)S = -150 + 0.2Y.
D)S = -150 + 0.85Y.
Table 8.2
Refer to Table 8.2.The equation for the aggregate saving function is
A)S = -100 + 0.15Y.
B)S = -100 + 0.1Y.
C)S = -150 + 0.2Y.
D)S = -150 + 0.85Y.
Unlock Deck
Unlock for access to all 176 flashcards in this deck.
Unlock Deck
k this deck
49
Refer to the information provided in Table 8.1 below to answer the questions that follow.
Table 8.1
Refer to Table 8.1.At an aggregate income level of $100,aggregate saving would be
A)-$70.
B)-$30.
C)$50.
D)$70.
Table 8.1
Refer to Table 8.1.At an aggregate income level of $100,aggregate saving would be
A)-$70.
B)-$30.
C)$50.
D)$70.
Unlock Deck
Unlock for access to all 176 flashcards in this deck.
Unlock Deck
k this deck
50
Refer to the information provided in Figure 8.3 below to answer the questions that follow. Figure 8.3
Refer to Figure 8.3.The equation for the aggregate consumption function is
A)C = 140 + 0.5Y.
B)C = 60 + 0.7Y.
C)C = 80 + 0.6Y.
D)C = 60 + 0.4Y.
Figure 8.3Refer to Figure 8.3.The equation for the aggregate consumption function is
A)C = 140 + 0.5Y.
B)C = 60 + 0.7Y.
C)C = 80 + 0.6Y.
D)C = 60 + 0.4Y.
Unlock Deck
Unlock for access to all 176 flashcards in this deck.
Unlock Deck
k this deck
51
Refer to the information provided in Figure 8.3 below to answer the questions that follow. Figure 8.3
Refer to Figure 8.3.Which of the following statements is FALSE?
A)Aggregate saving is negative for all income levels below $400 billion.
B)For all aggregate income levels above $200 billion,aggregate consumption is less than aggregate income.
C)If consumption is the only expenditure,this economy would be in equilibrium at an aggregate income level of $200 billion.
D)Saving is negative at all income levels below $200 billion.
Figure 8.3Refer to Figure 8.3.Which of the following statements is FALSE?
A)Aggregate saving is negative for all income levels below $400 billion.
B)For all aggregate income levels above $200 billion,aggregate consumption is less than aggregate income.
C)If consumption is the only expenditure,this economy would be in equilibrium at an aggregate income level of $200 billion.
D)Saving is negative at all income levels below $200 billion.
Unlock Deck
Unlock for access to all 176 flashcards in this deck.
Unlock Deck
k this deck
52
Refer to the information provided in Table 8.1 below to answer the questions that follow.
Table 8.1
Refer to Table 8.1.Society's MPS is
A)0.05.
B)0.10.
C)0.20.
D)0.95.
Table 8.1
Refer to Table 8.1.Society's MPS is
A)0.05.
B)0.10.
C)0.20.
D)0.95.
Unlock Deck
Unlock for access to all 176 flashcards in this deck.
Unlock Deck
k this deck
53
Refer to the information provided in Figure 8.3 below to answer the questions that follow. Figure 8.3
Refer to Figure 8.3.If aggregate income is $1,000 billion,then in this society aggregate saving is ________ billion.
A)$240
B)$300
C)$320
D)$550
Figure 8.3Refer to Figure 8.3.If aggregate income is $1,000 billion,then in this society aggregate saving is ________ billion.
A)$240
B)$300
C)$320
D)$550
Unlock Deck
Unlock for access to all 176 flashcards in this deck.
Unlock Deck
k this deck
54
Refer to the information provided in Table 8.2 below to answer the questions that follow.
Table 8.2
Refer to Table 8.2.Assuming society's MPC is constant,at an aggregate income of $1,200 aggregate saving would be
A)$0.
B)$20.
C)$55.
D)$150.
Table 8.2
Refer to Table 8.2.Assuming society's MPC is constant,at an aggregate income of $1,200 aggregate saving would be
A)$0.
B)$20.
C)$55.
D)$150.
Unlock Deck
Unlock for access to all 176 flashcards in this deck.
Unlock Deck
k this deck
55
Refer to the information provided in Figure 8.4 below to answer the questions that follow. Figure 8.4
Refer to Figure 8.4.The aggregate consumption functions C1 and C2
A)have the same MPC values.
B)imply different MPS values.
C)have the same autonomous consumption values.
D)have the same break-even values.
Figure 8.4Refer to Figure 8.4.The aggregate consumption functions C1 and C2
A)have the same MPC values.
B)imply different MPS values.
C)have the same autonomous consumption values.
D)have the same break-even values.
Unlock Deck
Unlock for access to all 176 flashcards in this deck.
Unlock Deck
k this deck
56
Refer to the information provided in Figure 8.3 below to answer the questions that follow. Figure 8.3
Refer to Figure 8.3.In this economy,aggregate saving will be zero if income is
A)$100 billion.
B)$200 billion.
C)$300 billion.
D)$400 billion.
Figure 8.3Refer to Figure 8.3.In this economy,aggregate saving will be zero if income is
A)$100 billion.
B)$200 billion.
C)$300 billion.
D)$400 billion.
Unlock Deck
Unlock for access to all 176 flashcards in this deck.
Unlock Deck
k this deck
57
Refer to the information provided in Table 8.2 below to answer the questions that follow.
Table 8.2
Refer to Table 8.2.Society's MPC is
A)0.1.
B)0.2.
C)0.8.
D)0.9.
Table 8.2
Refer to Table 8.2.Society's MPC is
A)0.1.
B)0.2.
C)0.8.
D)0.9.
Unlock Deck
Unlock for access to all 176 flashcards in this deck.
Unlock Deck
k this deck
58
Refer to the information provided in Table 8.2 below to answer the questions that follow.
Table 8.2
Refer to Table 8.2.Society's MPS is
A)0.1.
B)0.2.
C)0.3.
D)0.9.
Table 8.2
Refer to Table 8.2.Society's MPS is
A)0.1.
B)0.2.
C)0.3.
D)0.9.
Unlock Deck
Unlock for access to all 176 flashcards in this deck.
Unlock Deck
k this deck
59
Refer to the information provided in Table 8.1 below to answer the questions that follow.
Table 8.1
Refer to Table 8.1.Society's MPC is
A)0.95.
B)0.90.
C)0.80.
D)0.05.
Table 8.1
Refer to Table 8.1.Society's MPC is
A)0.95.
B)0.90.
C)0.80.
D)0.05.
Unlock Deck
Unlock for access to all 176 flashcards in this deck.
Unlock Deck
k this deck
60
Refer to the information provided in Figure 8.4 below to answer the questions that follow. Figure 8.4
Refer to Figure 8.4.Suppose the consumption function for C1 = 10 + 0.8Y,the consumption function that best fits C2 is
A)C2 = 20 + 0.8Y.
B)C2 = 10 + 0.4Y.
C)C2 = 40 + 0.5Y.
D)C2 = 20 + 0.1Y.
Figure 8.4Refer to Figure 8.4.Suppose the consumption function for C1 = 10 + 0.8Y,the consumption function that best fits C2 is
A)C2 = 20 + 0.8Y.
B)C2 = 10 + 0.4Y.
C)C2 = 40 + 0.5Y.
D)C2 = 20 + 0.1Y.
Unlock Deck
Unlock for access to all 176 flashcards in this deck.
Unlock Deck
k this deck
61
Refer to the information provided in Figure 8.4 below to answer the questions that follow. Figure 8.4
Refer to Figure 8.4.If income is Y1,aggregate consumption is the greatest when the aggregate consumption function is
A)C3.
B)C2.
C)C1.
D)cannot be determined from the figure
Figure 8.4Refer to Figure 8.4.If income is Y1,aggregate consumption is the greatest when the aggregate consumption function is
A)C3.
B)C2.
C)C1.
D)cannot be determined from the figure
Unlock Deck
Unlock for access to all 176 flashcards in this deck.
Unlock Deck
k this deck
62
An expected permanent tax increase is likely to increase current spending.
Unlock Deck
Unlock for access to all 176 flashcards in this deck.
Unlock Deck
k this deck
63
Refer to the information provided in Figure 8.5 below to answer the questions that follow. Figure 8.5
Refer to Figure 8.5.If aggregate income is $900 billion,aggregate consumption
A)is $25 billion.
B)is $800 billion.
C)is $875 billion.
D)cannot be determined from this information.
Figure 8.5Refer to Figure 8.5.If aggregate income is $900 billion,aggregate consumption
A)is $25 billion.
B)is $800 billion.
C)is $875 billion.
D)cannot be determined from this information.
Unlock Deck
Unlock for access to all 176 flashcards in this deck.
Unlock Deck
k this deck
64
Assume that in Jabara,planned investment is $30 billion,but actual investment is $45 billion.Unplanned inventory investment is
A)-$75 billion.
B)-$15 billion.
C)$15 billion.
D)$75 billion.
A)-$75 billion.
B)-$15 billion.
C)$15 billion.
D)$75 billion.
Unlock Deck
Unlock for access to all 176 flashcards in this deck.
Unlock Deck
k this deck
65
Refer to the information provided in Figure 8.6 below to answer the questions that follow. Figure 8.6
Refer to Figure 8.6.If aggregate income is $1,000,aggregate consumption is
A)$850.
B)$910.
C)$920.
D)$960.
Figure 8.6Refer to Figure 8.6.If aggregate income is $1,000,aggregate consumption is
A)$850.
B)$910.
C)$920.
D)$960.
Unlock Deck
Unlock for access to all 176 flashcards in this deck.
Unlock Deck
k this deck
66
Assume that in Scandia,planned investment is $80 billion but actual investment is $60 billion.Unplanned inventory investment is
A)-$20 billion.
B)-$10 billion.
C)$70 billion.
D)$140 billion.
A)-$20 billion.
B)-$10 billion.
C)$70 billion.
D)$140 billion.
Unlock Deck
Unlock for access to all 176 flashcards in this deck.
Unlock Deck
k this deck
67
The Jackson Tool Company manufactures only tools.In 2012 Jackson Tools manufactured 20,000 tools,but sold 21,000 tools.In 2012 Jackson Tools' change in inventory was
A)-2,000 tools.
B)-1,000 tools.
C)1,000 tools.
D)3,000 tools.
A)-2,000 tools.
B)-1,000 tools.
C)1,000 tools.
D)3,000 tools.
Unlock Deck
Unlock for access to all 176 flashcards in this deck.
Unlock Deck
k this deck
68
Refer to the information provided in Figure 8.6 below to answer the questions that follow. Figure 8.6
Refer to Figure 8.6.The MPS for this saving function is
A)0.4.
B)0.25.
C)0.2.
D)0.1.
Figure 8.6Refer to Figure 8.6.The MPS for this saving function is
A)0.4.
B)0.25.
C)0.2.
D)0.1.
Unlock Deck
Unlock for access to all 176 flashcards in this deck.
Unlock Deck
k this deck
69
If the marginal propensity to consume is 0.8,the marginal propensity to save is 8.
Unlock Deck
Unlock for access to all 176 flashcards in this deck.
Unlock Deck
k this deck
70
Which of the following is an investment?
A)the purchase of a new printing press by a business
B)the purchase of a corporate bond by a household
C)the purchase of a share of stock by a household
D)a leveraged buyout of one corporation by another
A)the purchase of a new printing press by a business
B)the purchase of a corporate bond by a household
C)the purchase of a share of stock by a household
D)a leveraged buyout of one corporation by another
Unlock Deck
Unlock for access to all 176 flashcards in this deck.
Unlock Deck
k this deck
71
Refer to the information provided in Figure 8.5 below to answer the questions that follow. Figure 8.5
Refer to Figure 8.5.If aggregate income is $400 billion,aggregate saving is ________ billion.
A)-$300
B)-$100
C)$0
D)$500
Figure 8.5Refer to Figure 8.5.If aggregate income is $400 billion,aggregate saving is ________ billion.
A)-$300
B)-$100
C)$0
D)$500
Unlock Deck
Unlock for access to all 176 flashcards in this deck.
Unlock Deck
k this deck
72
The Tiny Tots Toy Company manufactures only sleds.In 2012 Tiny Tots manufactured 10,000 sleds,but sold only 8,000 sleds.In 2012 Tiny Tots' change in inventory was
A)-2,000 sleds.
B)1,000 sleds.
C)2,000 sleds.
D)3,000 sleds.
A)-2,000 sleds.
B)1,000 sleds.
C)2,000 sleds.
D)3,000 sleds.
Unlock Deck
Unlock for access to all 176 flashcards in this deck.
Unlock Deck
k this deck
73
As interest rates fall,spending decreases.
Unlock Deck
Unlock for access to all 176 flashcards in this deck.
Unlock Deck
k this deck
74
Which of the following is NOT considered investment?
A)the acquisition of capital goods
B)the purchase of government bonds
C)the increase in planned inventories
D)the construction of a new factory
A)the acquisition of capital goods
B)the purchase of government bonds
C)the increase in planned inventories
D)the construction of a new factory
Unlock Deck
Unlock for access to all 176 flashcards in this deck.
Unlock Deck
k this deck
75
Refer to the information provided in Figure 8.5 below to answer the questions that follow. Figure 8.5
Refer to Figure 8.5.The MPS for this saving function is
A)5.
B)4.
C)0.5.
D)0.25.
Figure 8.5Refer to Figure 8.5.The MPS for this saving function is
A)5.
B)4.
C)0.5.
D)0.25.
Unlock Deck
Unlock for access to all 176 flashcards in this deck.
Unlock Deck
k this deck
76
The marginal propensity to consume is the change in consumption per change in income.
Unlock Deck
Unlock for access to all 176 flashcards in this deck.
Unlock Deck
k this deck
77
Over which component of investment do firms have the least amount of control?
A)purchases of new equipment
B)construction of new factories
C)changes in inventories
D)building new machines
A)purchases of new equipment
B)construction of new factories
C)changes in inventories
D)building new machines
Unlock Deck
Unlock for access to all 176 flashcards in this deck.
Unlock Deck
k this deck
78
If the consumption function is below the 45-degree line,
A)consumption is less than income and saving is positive.
B)consumption is less than income and saving is negative.
C)consumption exceeds income and saving is positive.
D)consumption exceeds income and saving is negative.
A)consumption is less than income and saving is positive.
B)consumption is less than income and saving is negative.
C)consumption exceeds income and saving is positive.
D)consumption exceeds income and saving is negative.
Unlock Deck
Unlock for access to all 176 flashcards in this deck.
Unlock Deck
k this deck
79
Refer to the information provided in Figure 8.4 below to answer the questions that follow. Figure 8.4
Refer to Figure 8.4.If income is Y2
A)the society's saving is negative along C1,C2,and C3.
B)the society's consumption is equal along C2 and C3.
C)the society's saving is positive along C2 and C3.
D)the society's savings is negative along C1.
Figure 8.4Refer to Figure 8.4.If income is Y2
A)the society's saving is negative along C1,C2,and C3.
B)the society's consumption is equal along C2 and C3.
C)the society's saving is positive along C2 and C3.
D)the society's savings is negative along C1.
Unlock Deck
Unlock for access to all 176 flashcards in this deck.
Unlock Deck
k this deck
80
Refer to the information provided in Figure 8.6 below to answer the questions that follow. Figure 8.6
Refer to Figure 8.6.If aggregate income is $800,aggregate saving is
A)-$100.
B)-$20.
C)$20.
D)$40.
Figure 8.6Refer to Figure 8.6.If aggregate income is $800,aggregate saving is
A)-$100.
B)-$20.
C)$20.
D)$40.
Unlock Deck
Unlock for access to all 176 flashcards in this deck.
Unlock Deck
k this deck
Unlock Deck
Unlock for access to all 176 flashcards in this deck.


