Deck 11: C: Factorial Design: I Lost My Phone Number, Can I Borrow Yours Do Pickup Lines Really Work
Full screen (f)
Question
Use the following to answer questions
Scenario I
Scenario I is based on fabricated data inspired by the following study:
Hennig-Thurau,T. ,Groth,M. ,Paul,M.& Gremler,D.D.(2006).Are all smiles created equal? How emotional contagion and emotional labor affect service relationships.Journal of Marketing,70,58-73.
Do Smiling Employees Improve Customer Satisfaction?
In this 2 × 2 between-subjects design,Hennig-Thurau and colleagues examined the effect of employee emotions and authenticity of the emotion on customer relations.A total of 223 undergraduate volunteers participated in this study.The participants were told they would be testing a new movie consulting service.The movie consulting service was created by the experimenters,and actors were hired to act as customer service representatives.Each participant approached the service desk where the actor asked them a number of questions about their movie preferences.The actors were trained to manipulate their smiling (high or low)and authenticity of smiling (high or low)during their interaction with each participant.After the interaction the participants were given a customer satisfaction survey.The results of this survey were used to examine the effect of each independent variable on customer satisfaction.Data analyses revealed that while the smiling had an effect on customer satisfaction,the authenticity of the emotion did not.Furthermore,the combination of both treatments (emotion × authenticity)had no impact on customer satisfaction.The results suggest that smiling,whether genuine or not,has a positive impact on customer satisfaction.Results are displayed in Figure 1.
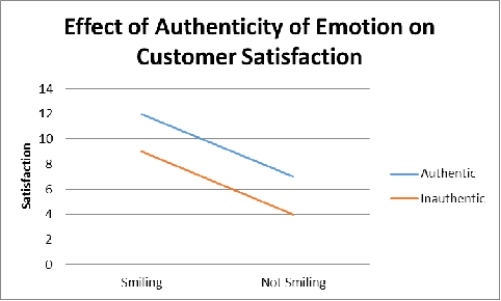 Figure 1.Customers rate their experience more favorably when employees are smiling.
(Scenario I)Suppose the researchers in Scenario I were unable to create the fictitious movie consulting service environment.Instead,they created four written scenarios that matched each of the four treatment conditions.Participants were randomly assigned to each treatment and were asked to indicate how satisfied they think they would have been based on the scenario they read.This type of design uses:
A) nonexperimental manipulations.
B) vignettes.
C) correlation
D) experimentation
Scenario I
Scenario I is based on fabricated data inspired by the following study:
Hennig-Thurau,T. ,Groth,M. ,Paul,M.& Gremler,D.D.(2006).Are all smiles created equal? How emotional contagion and emotional labor affect service relationships.Journal of Marketing,70,58-73.
Do Smiling Employees Improve Customer Satisfaction?
In this 2 × 2 between-subjects design,Hennig-Thurau and colleagues examined the effect of employee emotions and authenticity of the emotion on customer relations.A total of 223 undergraduate volunteers participated in this study.The participants were told they would be testing a new movie consulting service.The movie consulting service was created by the experimenters,and actors were hired to act as customer service representatives.Each participant approached the service desk where the actor asked them a number of questions about their movie preferences.The actors were trained to manipulate their smiling (high or low)and authenticity of smiling (high or low)during their interaction with each participant.After the interaction the participants were given a customer satisfaction survey.The results of this survey were used to examine the effect of each independent variable on customer satisfaction.Data analyses revealed that while the smiling had an effect on customer satisfaction,the authenticity of the emotion did not.Furthermore,the combination of both treatments (emotion × authenticity)had no impact on customer satisfaction.The results suggest that smiling,whether genuine or not,has a positive impact on customer satisfaction.Results are displayed in Figure 1.
Figure 1.Customers rate their experience more favorably when employees are smiling.(Scenario I)Suppose the researchers in Scenario I were unable to create the fictitious movie consulting service environment.Instead,they created four written scenarios that matched each of the four treatment conditions.Participants were randomly assigned to each treatment and were asked to indicate how satisfied they think they would have been based on the scenario they read.This type of design uses:
A) nonexperimental manipulations.
B) vignettes.
C) correlation
D) experimentation
Question
Use the following to answer questions
Scenario III
Scenario III is based on fabricated data inspired by the following study:
Spencer,S.J. ,Steele,C.M.& Quinn,D.M.(1999).Stereotype threat and women's math performance.Journal of Experimental Social Psychology,35,4-28.
Effect of Stereotype Threat on Math Study
The myth that men outperform women in math is widely believed by many individuals.The purpose of the study described in Scenario III was to determine if a sample of women whose math abilities equaled a sample of men would fall victim to this threat.To that end,28 adult men and 28 adult women were administered an easy math test or a difficult math test.The performance of men and women on both the easy and hard test was quantified.A two-factor ANOVA revealed a significant main effect for test,with participants scoring significantly better on the easy test.The analyses also revealed a main effect for sex,with men performing significantly better than women.The interaction between test difficulty and sex was also statistically significant.Further inspection of the data revealed that although men and women did not differ on the easy math test,women performed significantly less well than men on the difficult math test.Given that the screening criteria for participants including earning a grade of B or better in college calculus,and scoring in at least the 85th percentile on the math subsection of the ACT,the current study indicates that women do succumb to math stereotype threat but only when the math challenge is great.The data are presented in Figure 2.
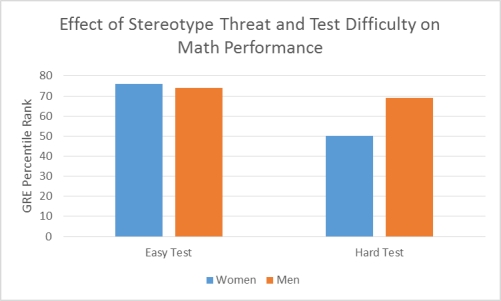 Figure 2.Although women and men performed equally on an easy version of the math test,women performed significantly worse than men on the difficult version.
(Scenario III)What makes the design in Scenario III a hybrid design?
A) There is more than one independent variable examined.
B) One independent variable is measured at the nominal and one is measured at the ratio level.
C) Sex is a quasi-independent variable.
D) All of the reasons are true.
Scenario III
Scenario III is based on fabricated data inspired by the following study:
Spencer,S.J. ,Steele,C.M.& Quinn,D.M.(1999).Stereotype threat and women's math performance.Journal of Experimental Social Psychology,35,4-28.
Effect of Stereotype Threat on Math Study
The myth that men outperform women in math is widely believed by many individuals.The purpose of the study described in Scenario III was to determine if a sample of women whose math abilities equaled a sample of men would fall victim to this threat.To that end,28 adult men and 28 adult women were administered an easy math test or a difficult math test.The performance of men and women on both the easy and hard test was quantified.A two-factor ANOVA revealed a significant main effect for test,with participants scoring significantly better on the easy test.The analyses also revealed a main effect for sex,with men performing significantly better than women.The interaction between test difficulty and sex was also statistically significant.Further inspection of the data revealed that although men and women did not differ on the easy math test,women performed significantly less well than men on the difficult math test.Given that the screening criteria for participants including earning a grade of B or better in college calculus,and scoring in at least the 85th percentile on the math subsection of the ACT,the current study indicates that women do succumb to math stereotype threat but only when the math challenge is great.The data are presented in Figure 2.
Figure 2.Although women and men performed equally on an easy version of the math test,women performed significantly worse than men on the difficult version.(Scenario III)What makes the design in Scenario III a hybrid design?
A) There is more than one independent variable examined.
B) One independent variable is measured at the nominal and one is measured at the ratio level.
C) Sex is a quasi-independent variable.
D) All of the reasons are true.
Question
Use the following to answer questions
Scenario III
Scenario III is based on fabricated data inspired by the following study:
Spencer,S.J. ,Steele,C.M.& Quinn,D.M.(1999).Stereotype threat and women's math performance.Journal of Experimental Social Psychology,35,4-28.
Effect of Stereotype Threat on Math Study
The myth that men outperform women in math is widely believed by many individuals.The purpose of the study described in Scenario III was to determine if a sample of women whose math abilities equaled a sample of men would fall victim to this threat.To that end,28 adult men and 28 adult women were administered an easy math test or a difficult math test.The performance of men and women on both the easy and hard test was quantified.A two-factor ANOVA revealed a significant main effect for test,with participants scoring significantly better on the easy test.The analyses also revealed a main effect for sex,with men performing significantly better than women.The interaction between test difficulty and sex was also statistically significant.Further inspection of the data revealed that although men and women did not differ on the easy math test,women performed significantly less well than men on the difficult math test.Given that the screening criteria for participants including earning a grade of B or better in college calculus,and scoring in at least the 85th percentile on the math subsection of the ACT,the current study indicates that women do succumb to math stereotype threat but only when the math challenge is great.The data are presented in Figure 2.
Figure 2.Although women and men performed equally on an easy version of the math test,women performed significantly worse than men on the difficult version.
(Scenario III)The study described in Scenario III used a factorial design to examine the effect of sex and test difficulty on math performance.Which of the following is NOT true of factorial designs?
A) It requires more participants and takes a greater amount of time to conduct.
B) It tests three hypotheses simultaneously.
C) It can identify a synergistic effect of the independent variables.
D) It can identify a suppression effect of the independent variables.
Scenario III
Scenario III is based on fabricated data inspired by the following study:
Spencer,S.J. ,Steele,C.M.& Quinn,D.M.(1999).Stereotype threat and women's math performance.Journal of Experimental Social Psychology,35,4-28.
Effect of Stereotype Threat on Math Study
The myth that men outperform women in math is widely believed by many individuals.The purpose of the study described in Scenario III was to determine if a sample of women whose math abilities equaled a sample of men would fall victim to this threat.To that end,28 adult men and 28 adult women were administered an easy math test or a difficult math test.The performance of men and women on both the easy and hard test was quantified.A two-factor ANOVA revealed a significant main effect for test,with participants scoring significantly better on the easy test.The analyses also revealed a main effect for sex,with men performing significantly better than women.The interaction between test difficulty and sex was also statistically significant.Further inspection of the data revealed that although men and women did not differ on the easy math test,women performed significantly less well than men on the difficult math test.Given that the screening criteria for participants including earning a grade of B or better in college calculus,and scoring in at least the 85th percentile on the math subsection of the ACT,the current study indicates that women do succumb to math stereotype threat but only when the math challenge is great.The data are presented in Figure 2.
Figure 2.Although women and men performed equally on an easy version of the math test,women performed significantly worse than men on the difficult version.(Scenario III)The study described in Scenario III used a factorial design to examine the effect of sex and test difficulty on math performance.Which of the following is NOT true of factorial designs?
A) It requires more participants and takes a greater amount of time to conduct.
B) It tests three hypotheses simultaneously.
C) It can identify a synergistic effect of the independent variables.
D) It can identify a suppression effect of the independent variables.
Question
Question
Use the following to answer questions
Scenario III
Scenario III is based on fabricated data inspired by the following study:
Spencer,S.J. ,Steele,C.M.& Quinn,D.M.(1999).Stereotype threat and women's math performance.Journal of Experimental Social Psychology,35,4-28.
Effect of Stereotype Threat on Math Study
The myth that men outperform women in math is widely believed by many individuals.The purpose of the study described in Scenario III was to determine if a sample of women whose math abilities equaled a sample of men would fall victim to this threat.To that end,28 adult men and 28 adult women were administered an easy math test or a difficult math test.The performance of men and women on both the easy and hard test was quantified.A two-factor ANOVA revealed a significant main effect for test,with participants scoring significantly better on the easy test.The analyses also revealed a main effect for sex,with men performing significantly better than women.The interaction between test difficulty and sex was also statistically significant.Further inspection of the data revealed that although men and women did not differ on the easy math test,women performed significantly less well than men on the difficult math test.Given that the screening criteria for participants including earning a grade of B or better in college calculus,and scoring in at least the 85th percentile on the math subsection of the ACT,the current study indicates that women do succumb to math stereotype threat but only when the math challenge is great.The data are presented in Figure 2.
Figure 2.Although women and men performed equally on an easy version of the math test,women performed significantly worse than men on the difficult version.
(Scenario III)The study described in Scenario III examined the effect of two independent variables on math performance.Based on this design,which of the following is true?
A) There could potentially be one main effect and one interaction.
B) If a main effect is identified,then there will automatically be an interaction.
C) If there is an interaction,then there will not be a main effect.
D) The design allows for three hypotheses to be tested.
Scenario III
Scenario III is based on fabricated data inspired by the following study:
Spencer,S.J. ,Steele,C.M.& Quinn,D.M.(1999).Stereotype threat and women's math performance.Journal of Experimental Social Psychology,35,4-28.
Effect of Stereotype Threat on Math Study
The myth that men outperform women in math is widely believed by many individuals.The purpose of the study described in Scenario III was to determine if a sample of women whose math abilities equaled a sample of men would fall victim to this threat.To that end,28 adult men and 28 adult women were administered an easy math test or a difficult math test.The performance of men and women on both the easy and hard test was quantified.A two-factor ANOVA revealed a significant main effect for test,with participants scoring significantly better on the easy test.The analyses also revealed a main effect for sex,with men performing significantly better than women.The interaction between test difficulty and sex was also statistically significant.Further inspection of the data revealed that although men and women did not differ on the easy math test,women performed significantly less well than men on the difficult math test.Given that the screening criteria for participants including earning a grade of B or better in college calculus,and scoring in at least the 85th percentile on the math subsection of the ACT,the current study indicates that women do succumb to math stereotype threat but only when the math challenge is great.The data are presented in Figure 2.
Figure 2.Although women and men performed equally on an easy version of the math test,women performed significantly worse than men on the difficult version.(Scenario III)The study described in Scenario III examined the effect of two independent variables on math performance.Based on this design,which of the following is true?
A) There could potentially be one main effect and one interaction.
B) If a main effect is identified,then there will automatically be an interaction.
C) If there is an interaction,then there will not be a main effect.
D) The design allows for three hypotheses to be tested.
Question
Question
Use the following to answer questions
Scenario I
Scenario I is based on fabricated data inspired by the following study:
Hennig-Thurau,T. ,Groth,M. ,Paul,M.& Gremler,D.D.(2006).Are all smiles created equal? How emotional contagion and emotional labor affect service relationships.Journal of Marketing,70,58-73.
Do Smiling Employees Improve Customer Satisfaction?
In this 2 × 2 between-subjects design,Hennig-Thurau and colleagues examined the effect of employee emotions and authenticity of the emotion on customer relations.A total of 223 undergraduate volunteers participated in this study.The participants were told they would be testing a new movie consulting service.The movie consulting service was created by the experimenters,and actors were hired to act as customer service representatives.Each participant approached the service desk where the actor asked them a number of questions about their movie preferences.The actors were trained to manipulate their smiling (high or low)and authenticity of smiling (high or low)during their interaction with each participant.After the interaction the participants were given a customer satisfaction survey.The results of this survey were used to examine the effect of each independent variable on customer satisfaction.Data analyses revealed that while the smiling had an effect on customer satisfaction,the authenticity of the emotion did not.Furthermore,the combination of both treatments (emotion × authenticity)had no impact on customer satisfaction.The results suggest that smiling,whether genuine or not,has a positive impact on customer satisfaction.Results are displayed in Figure 1.
Figure 1.Customers rate their experience more favorably when employees are smiling.
(Scenario I)The researchers of Scenario I conducted a follow-up study to examine whether customer satisfaction differed based on the smiling of the employee and sex of the participant.This design can be described as:
A) a 2 × 2 design.
B) a factorial design.
C) a hybrid design.
D) all of the above.
Scenario I
Scenario I is based on fabricated data inspired by the following study:
Hennig-Thurau,T. ,Groth,M. ,Paul,M.& Gremler,D.D.(2006).Are all smiles created equal? How emotional contagion and emotional labor affect service relationships.Journal of Marketing,70,58-73.
Do Smiling Employees Improve Customer Satisfaction?
In this 2 × 2 between-subjects design,Hennig-Thurau and colleagues examined the effect of employee emotions and authenticity of the emotion on customer relations.A total of 223 undergraduate volunteers participated in this study.The participants were told they would be testing a new movie consulting service.The movie consulting service was created by the experimenters,and actors were hired to act as customer service representatives.Each participant approached the service desk where the actor asked them a number of questions about their movie preferences.The actors were trained to manipulate their smiling (high or low)and authenticity of smiling (high or low)during their interaction with each participant.After the interaction the participants were given a customer satisfaction survey.The results of this survey were used to examine the effect of each independent variable on customer satisfaction.Data analyses revealed that while the smiling had an effect on customer satisfaction,the authenticity of the emotion did not.Furthermore,the combination of both treatments (emotion × authenticity)had no impact on customer satisfaction.The results suggest that smiling,whether genuine or not,has a positive impact on customer satisfaction.Results are displayed in Figure 1.
Figure 1.Customers rate their experience more favorably when employees are smiling.(Scenario I)The researchers of Scenario I conducted a follow-up study to examine whether customer satisfaction differed based on the smiling of the employee and sex of the participant.This design can be described as:
A) a 2 × 2 design.
B) a factorial design.
C) a hybrid design.
D) all of the above.
Question
Use the following to answer questions
Scenario I
Scenario I is based on fabricated data inspired by the following study:
Hennig-Thurau,T. ,Groth,M. ,Paul,M.& Gremler,D.D.(2006).Are all smiles created equal? How emotional contagion and emotional labor affect service relationships.Journal of Marketing,70,58-73.
Do Smiling Employees Improve Customer Satisfaction?
In this 2 × 2 between-subjects design,Hennig-Thurau and colleagues examined the effect of employee emotions and authenticity of the emotion on customer relations.A total of 223 undergraduate volunteers participated in this study.The participants were told they would be testing a new movie consulting service.The movie consulting service was created by the experimenters,and actors were hired to act as customer service representatives.Each participant approached the service desk where the actor asked them a number of questions about their movie preferences.The actors were trained to manipulate their smiling (high or low)and authenticity of smiling (high or low)during their interaction with each participant.After the interaction the participants were given a customer satisfaction survey.The results of this survey were used to examine the effect of each independent variable on customer satisfaction.Data analyses revealed that while the smiling had an effect on customer satisfaction,the authenticity of the emotion did not.Furthermore,the combination of both treatments (emotion × authenticity)had no impact on customer satisfaction.The results suggest that smiling,whether genuine or not,has a positive impact on customer satisfaction.Results are displayed in Figure 1.
Figure 1.Customers rate their experience more favorably when employees are smiling.
(Scenario I)How many hypotheses were tested in the study described in Scenario I?
A) one
B) two
C) three
D) four
Scenario I
Scenario I is based on fabricated data inspired by the following study:
Hennig-Thurau,T. ,Groth,M. ,Paul,M.& Gremler,D.D.(2006).Are all smiles created equal? How emotional contagion and emotional labor affect service relationships.Journal of Marketing,70,58-73.
Do Smiling Employees Improve Customer Satisfaction?
In this 2 × 2 between-subjects design,Hennig-Thurau and colleagues examined the effect of employee emotions and authenticity of the emotion on customer relations.A total of 223 undergraduate volunteers participated in this study.The participants were told they would be testing a new movie consulting service.The movie consulting service was created by the experimenters,and actors were hired to act as customer service representatives.Each participant approached the service desk where the actor asked them a number of questions about their movie preferences.The actors were trained to manipulate their smiling (high or low)and authenticity of smiling (high or low)during their interaction with each participant.After the interaction the participants were given a customer satisfaction survey.The results of this survey were used to examine the effect of each independent variable on customer satisfaction.Data analyses revealed that while the smiling had an effect on customer satisfaction,the authenticity of the emotion did not.Furthermore,the combination of both treatments (emotion × authenticity)had no impact on customer satisfaction.The results suggest that smiling,whether genuine or not,has a positive impact on customer satisfaction.Results are displayed in Figure 1.
Figure 1.Customers rate their experience more favorably when employees are smiling.(Scenario I)How many hypotheses were tested in the study described in Scenario I?
A) one
B) two
C) three
D) four
Question
Use the following to answer questions
Scenario I
Scenario I is based on fabricated data inspired by the following study:
Hennig-Thurau,T. ,Groth,M. ,Paul,M.& Gremler,D.D.(2006).Are all smiles created equal? How emotional contagion and emotional labor affect service relationships.Journal of Marketing,70,58-73.
Do Smiling Employees Improve Customer Satisfaction?
In this 2 × 2 between-subjects design,Hennig-Thurau and colleagues examined the effect of employee emotions and authenticity of the emotion on customer relations.A total of 223 undergraduate volunteers participated in this study.The participants were told they would be testing a new movie consulting service.The movie consulting service was created by the experimenters,and actors were hired to act as customer service representatives.Each participant approached the service desk where the actor asked them a number of questions about their movie preferences.The actors were trained to manipulate their smiling (high or low)and authenticity of smiling (high or low)during their interaction with each participant.After the interaction the participants were given a customer satisfaction survey.The results of this survey were used to examine the effect of each independent variable on customer satisfaction.Data analyses revealed that while the smiling had an effect on customer satisfaction,the authenticity of the emotion did not.Furthermore,the combination of both treatments (emotion × authenticity)had no impact on customer satisfaction.The results suggest that smiling,whether genuine or not,has a positive impact on customer satisfaction.Results are displayed in Figure 1.
Figure 1.Customers rate their experience more favorably when employees are smiling.
(Scenario I)Suppose each treatment condition described in Scenario I was conducted sequentially with the first treatment tested in the fall semester,and the second in the spring semester.Following testing all treatment conditions the participants received payment for their participation in the form of a gift card.Some received a gift card to a coffee shop and others received one to a megastore.Along with their gift card,participants also received a statement debriefing them of the actual intent of the study.Which of the following presents a potential confound?
A) debriefing letter
B) gift card type
C) month of testing
D) all are confounds
Scenario I
Scenario I is based on fabricated data inspired by the following study:
Hennig-Thurau,T. ,Groth,M. ,Paul,M.& Gremler,D.D.(2006).Are all smiles created equal? How emotional contagion and emotional labor affect service relationships.Journal of Marketing,70,58-73.
Do Smiling Employees Improve Customer Satisfaction?
In this 2 × 2 between-subjects design,Hennig-Thurau and colleagues examined the effect of employee emotions and authenticity of the emotion on customer relations.A total of 223 undergraduate volunteers participated in this study.The participants were told they would be testing a new movie consulting service.The movie consulting service was created by the experimenters,and actors were hired to act as customer service representatives.Each participant approached the service desk where the actor asked them a number of questions about their movie preferences.The actors were trained to manipulate their smiling (high or low)and authenticity of smiling (high or low)during their interaction with each participant.After the interaction the participants were given a customer satisfaction survey.The results of this survey were used to examine the effect of each independent variable on customer satisfaction.Data analyses revealed that while the smiling had an effect on customer satisfaction,the authenticity of the emotion did not.Furthermore,the combination of both treatments (emotion × authenticity)had no impact on customer satisfaction.The results suggest that smiling,whether genuine or not,has a positive impact on customer satisfaction.Results are displayed in Figure 1.
Figure 1.Customers rate their experience more favorably when employees are smiling.(Scenario I)Suppose each treatment condition described in Scenario I was conducted sequentially with the first treatment tested in the fall semester,and the second in the spring semester.Following testing all treatment conditions the participants received payment for their participation in the form of a gift card.Some received a gift card to a coffee shop and others received one to a megastore.Along with their gift card,participants also received a statement debriefing them of the actual intent of the study.Which of the following presents a potential confound?
A) debriefing letter
B) gift card type
C) month of testing
D) all are confounds
Question
Use the following to answer questions
Scenario III
Scenario III is based on fabricated data inspired by the following study:
Spencer,S.J. ,Steele,C.M.& Quinn,D.M.(1999).Stereotype threat and women's math performance.Journal of Experimental Social Psychology,35,4-28.
Effect of Stereotype Threat on Math Study
The myth that men outperform women in math is widely believed by many individuals.The purpose of the study described in Scenario III was to determine if a sample of women whose math abilities equaled a sample of men would fall victim to this threat.To that end,28 adult men and 28 adult women were administered an easy math test or a difficult math test.The performance of men and women on both the easy and hard test was quantified.A two-factor ANOVA revealed a significant main effect for test,with participants scoring significantly better on the easy test.The analyses also revealed a main effect for sex,with men performing significantly better than women.The interaction between test difficulty and sex was also statistically significant.Further inspection of the data revealed that although men and women did not differ on the easy math test,women performed significantly less well than men on the difficult math test.Given that the screening criteria for participants including earning a grade of B or better in college calculus,and scoring in at least the 85th percentile on the math subsection of the ACT,the current study indicates that women do succumb to math stereotype threat but only when the math challenge is great.The data are presented in Figure 2.
Figure 2.Although women and men performed equally on an easy version of the math test,women performed significantly worse than men on the difficult version.
(Scenario III)Suppose the researchers described in Scenario III added a third level of difficulty to the math test and added a third variable (time to complete test).Participants were given 1 hour,2 hours,or 3 hours to complete the test.This design would now produce how many unique treatment conditions?
A) 3
B) 9
C) 18
D) 27
Scenario III
Scenario III is based on fabricated data inspired by the following study:
Spencer,S.J. ,Steele,C.M.& Quinn,D.M.(1999).Stereotype threat and women's math performance.Journal of Experimental Social Psychology,35,4-28.
Effect of Stereotype Threat on Math Study
The myth that men outperform women in math is widely believed by many individuals.The purpose of the study described in Scenario III was to determine if a sample of women whose math abilities equaled a sample of men would fall victim to this threat.To that end,28 adult men and 28 adult women were administered an easy math test or a difficult math test.The performance of men and women on both the easy and hard test was quantified.A two-factor ANOVA revealed a significant main effect for test,with participants scoring significantly better on the easy test.The analyses also revealed a main effect for sex,with men performing significantly better than women.The interaction between test difficulty and sex was also statistically significant.Further inspection of the data revealed that although men and women did not differ on the easy math test,women performed significantly less well than men on the difficult math test.Given that the screening criteria for participants including earning a grade of B or better in college calculus,and scoring in at least the 85th percentile on the math subsection of the ACT,the current study indicates that women do succumb to math stereotype threat but only when the math challenge is great.The data are presented in Figure 2.
Figure 2.Although women and men performed equally on an easy version of the math test,women performed significantly worse than men on the difficult version.(Scenario III)Suppose the researchers described in Scenario III added a third level of difficulty to the math test and added a third variable (time to complete test).Participants were given 1 hour,2 hours,or 3 hours to complete the test.This design would now produce how many unique treatment conditions?
A) 3
B) 9
C) 18
D) 27
Question
Use the following to answer questions
Scenario III
Scenario III is based on fabricated data inspired by the following study:
Spencer,S.J. ,Steele,C.M.& Quinn,D.M.(1999).Stereotype threat and women's math performance.Journal of Experimental Social Psychology,35,4-28.
Effect of Stereotype Threat on Math Study
The myth that men outperform women in math is widely believed by many individuals.The purpose of the study described in Scenario III was to determine if a sample of women whose math abilities equaled a sample of men would fall victim to this threat.To that end,28 adult men and 28 adult women were administered an easy math test or a difficult math test.The performance of men and women on both the easy and hard test was quantified.A two-factor ANOVA revealed a significant main effect for test,with participants scoring significantly better on the easy test.The analyses also revealed a main effect for sex,with men performing significantly better than women.The interaction between test difficulty and sex was also statistically significant.Further inspection of the data revealed that although men and women did not differ on the easy math test,women performed significantly less well than men on the difficult math test.Given that the screening criteria for participants including earning a grade of B or better in college calculus,and scoring in at least the 85th percentile on the math subsection of the ACT,the current study indicates that women do succumb to math stereotype threat but only when the math challenge is great.The data are presented in Figure 2.
Figure 2.Although women and men performed equally on an easy version of the math test,women performed significantly worse than men on the difficult version.
(Scenario III)According to Scenario III,there was a main effect for sex,with men performing significantly better than women.To arrive at this conclusion,the researchers would have had to examine:
A) interaction means.
B) cell means.
C) marginal means.
D) factorial means.
Scenario III
Scenario III is based on fabricated data inspired by the following study:
Spencer,S.J. ,Steele,C.M.& Quinn,D.M.(1999).Stereotype threat and women's math performance.Journal of Experimental Social Psychology,35,4-28.
Effect of Stereotype Threat on Math Study
The myth that men outperform women in math is widely believed by many individuals.The purpose of the study described in Scenario III was to determine if a sample of women whose math abilities equaled a sample of men would fall victim to this threat.To that end,28 adult men and 28 adult women were administered an easy math test or a difficult math test.The performance of men and women on both the easy and hard test was quantified.A two-factor ANOVA revealed a significant main effect for test,with participants scoring significantly better on the easy test.The analyses also revealed a main effect for sex,with men performing significantly better than women.The interaction between test difficulty and sex was also statistically significant.Further inspection of the data revealed that although men and women did not differ on the easy math test,women performed significantly less well than men on the difficult math test.Given that the screening criteria for participants including earning a grade of B or better in college calculus,and scoring in at least the 85th percentile on the math subsection of the ACT,the current study indicates that women do succumb to math stereotype threat but only when the math challenge is great.The data are presented in Figure 2.
Figure 2.Although women and men performed equally on an easy version of the math test,women performed significantly worse than men on the difficult version.(Scenario III)According to Scenario III,there was a main effect for sex,with men performing significantly better than women.To arrive at this conclusion,the researchers would have had to examine:
A) interaction means.
B) cell means.
C) marginal means.
D) factorial means.
Question
Question
Use the following to answer questions
Scenario I
Scenario I is based on fabricated data inspired by the following study:
Hennig-Thurau,T. ,Groth,M. ,Paul,M.& Gremler,D.D.(2006).Are all smiles created equal? How emotional contagion and emotional labor affect service relationships.Journal of Marketing,70,58-73.
Do Smiling Employees Improve Customer Satisfaction?
In this 2 × 2 between-subjects design,Hennig-Thurau and colleagues examined the effect of employee emotions and authenticity of the emotion on customer relations.A total of 223 undergraduate volunteers participated in this study.The participants were told they would be testing a new movie consulting service.The movie consulting service was created by the experimenters,and actors were hired to act as customer service representatives.Each participant approached the service desk where the actor asked them a number of questions about their movie preferences.The actors were trained to manipulate their smiling (high or low)and authenticity of smiling (high or low)during their interaction with each participant.After the interaction the participants were given a customer satisfaction survey.The results of this survey were used to examine the effect of each independent variable on customer satisfaction.Data analyses revealed that while the smiling had an effect on customer satisfaction,the authenticity of the emotion did not.Furthermore,the combination of both treatments (emotion × authenticity)had no impact on customer satisfaction.The results suggest that smiling,whether genuine or not,has a positive impact on customer satisfaction.Results are displayed in Figure 1.
Figure 1.Customers rate their experience more favorably when employees are smiling.
(Scenario I)Which of the following hypothesis did the results of the study described in Scenario I support?
A) There is a main effect for emotion,but no main effect for authenticity or interaction between emotion and authenticity on customer satisfaction.
B) There is a main effect for emotion and a main effect for authenticity,but not an interaction between emotion and authenticity on customer satisfaction.
C) There is a main effect for emotion,a main effect for interaction and an interaction between emotion and authenticity on customer satisfaction.
D) There is no effect for emotion,authenticity,or emotion × authenticity interaction on customer satisfaction.
Scenario I
Scenario I is based on fabricated data inspired by the following study:
Hennig-Thurau,T. ,Groth,M. ,Paul,M.& Gremler,D.D.(2006).Are all smiles created equal? How emotional contagion and emotional labor affect service relationships.Journal of Marketing,70,58-73.
Do Smiling Employees Improve Customer Satisfaction?
In this 2 × 2 between-subjects design,Hennig-Thurau and colleagues examined the effect of employee emotions and authenticity of the emotion on customer relations.A total of 223 undergraduate volunteers participated in this study.The participants were told they would be testing a new movie consulting service.The movie consulting service was created by the experimenters,and actors were hired to act as customer service representatives.Each participant approached the service desk where the actor asked them a number of questions about their movie preferences.The actors were trained to manipulate their smiling (high or low)and authenticity of smiling (high or low)during their interaction with each participant.After the interaction the participants were given a customer satisfaction survey.The results of this survey were used to examine the effect of each independent variable on customer satisfaction.Data analyses revealed that while the smiling had an effect on customer satisfaction,the authenticity of the emotion did not.Furthermore,the combination of both treatments (emotion × authenticity)had no impact on customer satisfaction.The results suggest that smiling,whether genuine or not,has a positive impact on customer satisfaction.Results are displayed in Figure 1.
Figure 1.Customers rate their experience more favorably when employees are smiling.(Scenario I)Which of the following hypothesis did the results of the study described in Scenario I support?
A) There is a main effect for emotion,but no main effect for authenticity or interaction between emotion and authenticity on customer satisfaction.
B) There is a main effect for emotion and a main effect for authenticity,but not an interaction between emotion and authenticity on customer satisfaction.
C) There is a main effect for emotion,a main effect for interaction and an interaction between emotion and authenticity on customer satisfaction.
D) There is no effect for emotion,authenticity,or emotion × authenticity interaction on customer satisfaction.
Question
Use the following to answer questions
Scenario I
Scenario I is based on fabricated data inspired by the following study:
Hennig-Thurau,T. ,Groth,M. ,Paul,M.& Gremler,D.D.(2006).Are all smiles created equal? How emotional contagion and emotional labor affect service relationships.Journal of Marketing,70,58-73.
Do Smiling Employees Improve Customer Satisfaction?
In this 2 × 2 between-subjects design,Hennig-Thurau and colleagues examined the effect of employee emotions and authenticity of the emotion on customer relations.A total of 223 undergraduate volunteers participated in this study.The participants were told they would be testing a new movie consulting service.The movie consulting service was created by the experimenters,and actors were hired to act as customer service representatives.Each participant approached the service desk where the actor asked them a number of questions about their movie preferences.The actors were trained to manipulate their smiling (high or low)and authenticity of smiling (high or low)during their interaction with each participant.After the interaction the participants were given a customer satisfaction survey.The results of this survey were used to examine the effect of each independent variable on customer satisfaction.Data analyses revealed that while the smiling had an effect on customer satisfaction,the authenticity of the emotion did not.Furthermore,the combination of both treatments (emotion × authenticity)had no impact on customer satisfaction.The results suggest that smiling,whether genuine or not,has a positive impact on customer satisfaction.Results are displayed in Figure 1.
Figure 1.Customers rate their experience more favorably when employees are smiling.
(Scenario I)Figure 1 supports which of the following hypotheses?
A) main effect for smiling
B) main effect for authenticity
C) interaction between smiling and authenticity
D) all of the above hypotheses are supported
Scenario I
Scenario I is based on fabricated data inspired by the following study:
Hennig-Thurau,T. ,Groth,M. ,Paul,M.& Gremler,D.D.(2006).Are all smiles created equal? How emotional contagion and emotional labor affect service relationships.Journal of Marketing,70,58-73.
Do Smiling Employees Improve Customer Satisfaction?
In this 2 × 2 between-subjects design,Hennig-Thurau and colleagues examined the effect of employee emotions and authenticity of the emotion on customer relations.A total of 223 undergraduate volunteers participated in this study.The participants were told they would be testing a new movie consulting service.The movie consulting service was created by the experimenters,and actors were hired to act as customer service representatives.Each participant approached the service desk where the actor asked them a number of questions about their movie preferences.The actors were trained to manipulate their smiling (high or low)and authenticity of smiling (high or low)during their interaction with each participant.After the interaction the participants were given a customer satisfaction survey.The results of this survey were used to examine the effect of each independent variable on customer satisfaction.Data analyses revealed that while the smiling had an effect on customer satisfaction,the authenticity of the emotion did not.Furthermore,the combination of both treatments (emotion × authenticity)had no impact on customer satisfaction.The results suggest that smiling,whether genuine or not,has a positive impact on customer satisfaction.Results are displayed in Figure 1.
Figure 1.Customers rate their experience more favorably when employees are smiling.(Scenario I)Figure 1 supports which of the following hypotheses?
A) main effect for smiling
B) main effect for authenticity
C) interaction between smiling and authenticity
D) all of the above hypotheses are supported
Question
Question

Unlock Deck
Sign up to unlock the cards in this deck!
Unlock Deck
Unlock Deck
1/16
Play
Full screen (f)
Deck 11: C: Factorial Design: I Lost My Phone Number, Can I Borrow Yours Do Pickup Lines Really Work
1
Use the following to answer questions
Scenario I
Scenario I is based on fabricated data inspired by the following study:
Hennig-Thurau,T. ,Groth,M. ,Paul,M.& Gremler,D.D.(2006).Are all smiles created equal? How emotional contagion and emotional labor affect service relationships.Journal of Marketing,70,58-73.
Do Smiling Employees Improve Customer Satisfaction?
In this 2 × 2 between-subjects design,Hennig-Thurau and colleagues examined the effect of employee emotions and authenticity of the emotion on customer relations.A total of 223 undergraduate volunteers participated in this study.The participants were told they would be testing a new movie consulting service.The movie consulting service was created by the experimenters,and actors were hired to act as customer service representatives.Each participant approached the service desk where the actor asked them a number of questions about their movie preferences.The actors were trained to manipulate their smiling (high or low)and authenticity of smiling (high or low)during their interaction with each participant.After the interaction the participants were given a customer satisfaction survey.The results of this survey were used to examine the effect of each independent variable on customer satisfaction.Data analyses revealed that while the smiling had an effect on customer satisfaction,the authenticity of the emotion did not.Furthermore,the combination of both treatments (emotion × authenticity)had no impact on customer satisfaction.The results suggest that smiling,whether genuine or not,has a positive impact on customer satisfaction.Results are displayed in Figure 1.
Figure 1.Customers rate their experience more favorably when employees are smiling.
(Scenario I)Suppose the researchers in Scenario I were unable to create the fictitious movie consulting service environment.Instead,they created four written scenarios that matched each of the four treatment conditions.Participants were randomly assigned to each treatment and were asked to indicate how satisfied they think they would have been based on the scenario they read.This type of design uses:
A) nonexperimental manipulations.
B) vignettes.
C) correlation
D) experimentation
Scenario I
Scenario I is based on fabricated data inspired by the following study:
Hennig-Thurau,T. ,Groth,M. ,Paul,M.& Gremler,D.D.(2006).Are all smiles created equal? How emotional contagion and emotional labor affect service relationships.Journal of Marketing,70,58-73.
Do Smiling Employees Improve Customer Satisfaction?
In this 2 × 2 between-subjects design,Hennig-Thurau and colleagues examined the effect of employee emotions and authenticity of the emotion on customer relations.A total of 223 undergraduate volunteers participated in this study.The participants were told they would be testing a new movie consulting service.The movie consulting service was created by the experimenters,and actors were hired to act as customer service representatives.Each participant approached the service desk where the actor asked them a number of questions about their movie preferences.The actors were trained to manipulate their smiling (high or low)and authenticity of smiling (high or low)during their interaction with each participant.After the interaction the participants were given a customer satisfaction survey.The results of this survey were used to examine the effect of each independent variable on customer satisfaction.Data analyses revealed that while the smiling had an effect on customer satisfaction,the authenticity of the emotion did not.Furthermore,the combination of both treatments (emotion × authenticity)had no impact on customer satisfaction.The results suggest that smiling,whether genuine or not,has a positive impact on customer satisfaction.Results are displayed in Figure 1.
Figure 1.Customers rate their experience more favorably when employees are smiling.(Scenario I)Suppose the researchers in Scenario I were unable to create the fictitious movie consulting service environment.Instead,they created four written scenarios that matched each of the four treatment conditions.Participants were randomly assigned to each treatment and were asked to indicate how satisfied they think they would have been based on the scenario they read.This type of design uses:
A) nonexperimental manipulations.
B) vignettes.
C) correlation
D) experimentation
nonexperimental manipulations.
2
Use the following to answer questions
Scenario III
Scenario III is based on fabricated data inspired by the following study:
Spencer,S.J. ,Steele,C.M.& Quinn,D.M.(1999).Stereotype threat and women's math performance.Journal of Experimental Social Psychology,35,4-28.
Effect of Stereotype Threat on Math Study
The myth that men outperform women in math is widely believed by many individuals.The purpose of the study described in Scenario III was to determine if a sample of women whose math abilities equaled a sample of men would fall victim to this threat.To that end,28 adult men and 28 adult women were administered an easy math test or a difficult math test.The performance of men and women on both the easy and hard test was quantified.A two-factor ANOVA revealed a significant main effect for test,with participants scoring significantly better on the easy test.The analyses also revealed a main effect for sex,with men performing significantly better than women.The interaction between test difficulty and sex was also statistically significant.Further inspection of the data revealed that although men and women did not differ on the easy math test,women performed significantly less well than men on the difficult math test.Given that the screening criteria for participants including earning a grade of B or better in college calculus,and scoring in at least the 85th percentile on the math subsection of the ACT,the current study indicates that women do succumb to math stereotype threat but only when the math challenge is great.The data are presented in Figure 2.
Figure 2.Although women and men performed equally on an easy version of the math test,women performed significantly worse than men on the difficult version.
(Scenario III)What makes the design in Scenario III a hybrid design?
A) There is more than one independent variable examined.
B) One independent variable is measured at the nominal and one is measured at the ratio level.
C) Sex is a quasi-independent variable.
D) All of the reasons are true.
Scenario III
Scenario III is based on fabricated data inspired by the following study:
Spencer,S.J. ,Steele,C.M.& Quinn,D.M.(1999).Stereotype threat and women's math performance.Journal of Experimental Social Psychology,35,4-28.
Effect of Stereotype Threat on Math Study
The myth that men outperform women in math is widely believed by many individuals.The purpose of the study described in Scenario III was to determine if a sample of women whose math abilities equaled a sample of men would fall victim to this threat.To that end,28 adult men and 28 adult women were administered an easy math test or a difficult math test.The performance of men and women on both the easy and hard test was quantified.A two-factor ANOVA revealed a significant main effect for test,with participants scoring significantly better on the easy test.The analyses also revealed a main effect for sex,with men performing significantly better than women.The interaction between test difficulty and sex was also statistically significant.Further inspection of the data revealed that although men and women did not differ on the easy math test,women performed significantly less well than men on the difficult math test.Given that the screening criteria for participants including earning a grade of B or better in college calculus,and scoring in at least the 85th percentile on the math subsection of the ACT,the current study indicates that women do succumb to math stereotype threat but only when the math challenge is great.The data are presented in Figure 2.
Figure 2.Although women and men performed equally on an easy version of the math test,women performed significantly worse than men on the difficult version.(Scenario III)What makes the design in Scenario III a hybrid design?
A) There is more than one independent variable examined.
B) One independent variable is measured at the nominal and one is measured at the ratio level.
C) Sex is a quasi-independent variable.
D) All of the reasons are true.
Sex is a quasi-independent variable.
3
Use the following to answer questions
Scenario III
Scenario III is based on fabricated data inspired by the following study:
Spencer,S.J. ,Steele,C.M.& Quinn,D.M.(1999).Stereotype threat and women's math performance.Journal of Experimental Social Psychology,35,4-28.
Effect of Stereotype Threat on Math Study
The myth that men outperform women in math is widely believed by many individuals.The purpose of the study described in Scenario III was to determine if a sample of women whose math abilities equaled a sample of men would fall victim to this threat.To that end,28 adult men and 28 adult women were administered an easy math test or a difficult math test.The performance of men and women on both the easy and hard test was quantified.A two-factor ANOVA revealed a significant main effect for test,with participants scoring significantly better on the easy test.The analyses also revealed a main effect for sex,with men performing significantly better than women.The interaction between test difficulty and sex was also statistically significant.Further inspection of the data revealed that although men and women did not differ on the easy math test,women performed significantly less well than men on the difficult math test.Given that the screening criteria for participants including earning a grade of B or better in college calculus,and scoring in at least the 85th percentile on the math subsection of the ACT,the current study indicates that women do succumb to math stereotype threat but only when the math challenge is great.The data are presented in Figure 2.
Figure 2.Although women and men performed equally on an easy version of the math test,women performed significantly worse than men on the difficult version.
(Scenario III)The study described in Scenario III used a factorial design to examine the effect of sex and test difficulty on math performance.Which of the following is NOT true of factorial designs?
A) It requires more participants and takes a greater amount of time to conduct.
B) It tests three hypotheses simultaneously.
C) It can identify a synergistic effect of the independent variables.
D) It can identify a suppression effect of the independent variables.
Scenario III
Scenario III is based on fabricated data inspired by the following study:
Spencer,S.J. ,Steele,C.M.& Quinn,D.M.(1999).Stereotype threat and women's math performance.Journal of Experimental Social Psychology,35,4-28.
Effect of Stereotype Threat on Math Study
The myth that men outperform women in math is widely believed by many individuals.The purpose of the study described in Scenario III was to determine if a sample of women whose math abilities equaled a sample of men would fall victim to this threat.To that end,28 adult men and 28 adult women were administered an easy math test or a difficult math test.The performance of men and women on both the easy and hard test was quantified.A two-factor ANOVA revealed a significant main effect for test,with participants scoring significantly better on the easy test.The analyses also revealed a main effect for sex,with men performing significantly better than women.The interaction between test difficulty and sex was also statistically significant.Further inspection of the data revealed that although men and women did not differ on the easy math test,women performed significantly less well than men on the difficult math test.Given that the screening criteria for participants including earning a grade of B or better in college calculus,and scoring in at least the 85th percentile on the math subsection of the ACT,the current study indicates that women do succumb to math stereotype threat but only when the math challenge is great.The data are presented in Figure 2.
Figure 2.Although women and men performed equally on an easy version of the math test,women performed significantly worse than men on the difficult version.(Scenario III)The study described in Scenario III used a factorial design to examine the effect of sex and test difficulty on math performance.Which of the following is NOT true of factorial designs?
A) It requires more participants and takes a greater amount of time to conduct.
B) It tests three hypotheses simultaneously.
C) It can identify a synergistic effect of the independent variables.
D) It can identify a suppression effect of the independent variables.
It requires more participants and takes a greater amount of time to conduct.
4
Use the following to answer questions
Scenario II is presents fabricated data inspired by the following study:
Greimel,E. ,Wanderer,S. ,Rothenberger,A. ,Herpertz-Dahlman,B. ,Konrad,K.& Roessner,V.(2011).Attentional performance in children and adolescents with tic disorder and co-occurring attention-deficit/hyperactivity disorder: new insights from a 2×2 factorial design study.Journal of Abnormal Child Psychology,39,819-828.
Effect of Tic Disorder and ADHD on Children's Attention
This study examined the extent to which tic disorder (TD)and attention-deficit/hyperactivity disorder (ADHD),both individually and combined,affects attention in children and adolescents.To that end,the researchers recruited children with and without TD,and children with and without ADHD.This 2 × 2 (TD × ADHD)design resulted in four conditions: children with no diagnosis (control),children with TD only,children with ADHD only,and children with TD+ADHD.The Child Behavior Checklist (CBCL)was used to quantify three components of attentional behavior: internalizing,externalizing,and attention.The results revealed that children with ADHD+TD had significantly more internalizing than those with TD alone.In addition,children with ADHD+TD as well as children with only ADHD had more externalizing than those with TD alone.Lastly,ADHD+TD children had more attention problems than those with only TD and those with only ADHD.The results of this study suggest that children with ADHD+TD have more behavioral problems than those with single diagnoses and those with no diagnoses.
(Scenario II)The fact that kids with ADHD+TD had significantly more behavioral problems than those with ADHD alone or TD alone suggests a _____ effect.
A) marginal
B) hybrid
C) suppression
D) synergistic
Unlock Deck
Unlock for access to all 16 flashcards in this deck.
Unlock Deck
k this deck
5
Use the following to answer questions
Scenario III
Scenario III is based on fabricated data inspired by the following study:
Spencer,S.J. ,Steele,C.M.& Quinn,D.M.(1999).Stereotype threat and women's math performance.Journal of Experimental Social Psychology,35,4-28.
Effect of Stereotype Threat on Math Study
The myth that men outperform women in math is widely believed by many individuals.The purpose of the study described in Scenario III was to determine if a sample of women whose math abilities equaled a sample of men would fall victim to this threat.To that end,28 adult men and 28 adult women were administered an easy math test or a difficult math test.The performance of men and women on both the easy and hard test was quantified.A two-factor ANOVA revealed a significant main effect for test,with participants scoring significantly better on the easy test.The analyses also revealed a main effect for sex,with men performing significantly better than women.The interaction between test difficulty and sex was also statistically significant.Further inspection of the data revealed that although men and women did not differ on the easy math test,women performed significantly less well than men on the difficult math test.Given that the screening criteria for participants including earning a grade of B or better in college calculus,and scoring in at least the 85th percentile on the math subsection of the ACT,the current study indicates that women do succumb to math stereotype threat but only when the math challenge is great.The data are presented in Figure 2.
Figure 2.Although women and men performed equally on an easy version of the math test,women performed significantly worse than men on the difficult version.
(Scenario III)The study described in Scenario III examined the effect of two independent variables on math performance.Based on this design,which of the following is true?
A) There could potentially be one main effect and one interaction.
B) If a main effect is identified,then there will automatically be an interaction.
C) If there is an interaction,then there will not be a main effect.
D) The design allows for three hypotheses to be tested.
Scenario III
Scenario III is based on fabricated data inspired by the following study:
Spencer,S.J. ,Steele,C.M.& Quinn,D.M.(1999).Stereotype threat and women's math performance.Journal of Experimental Social Psychology,35,4-28.
Effect of Stereotype Threat on Math Study
The myth that men outperform women in math is widely believed by many individuals.The purpose of the study described in Scenario III was to determine if a sample of women whose math abilities equaled a sample of men would fall victim to this threat.To that end,28 adult men and 28 adult women were administered an easy math test or a difficult math test.The performance of men and women on both the easy and hard test was quantified.A two-factor ANOVA revealed a significant main effect for test,with participants scoring significantly better on the easy test.The analyses also revealed a main effect for sex,with men performing significantly better than women.The interaction between test difficulty and sex was also statistically significant.Further inspection of the data revealed that although men and women did not differ on the easy math test,women performed significantly less well than men on the difficult math test.Given that the screening criteria for participants including earning a grade of B or better in college calculus,and scoring in at least the 85th percentile on the math subsection of the ACT,the current study indicates that women do succumb to math stereotype threat but only when the math challenge is great.The data are presented in Figure 2.
Figure 2.Although women and men performed equally on an easy version of the math test,women performed significantly worse than men on the difficult version.(Scenario III)The study described in Scenario III examined the effect of two independent variables on math performance.Based on this design,which of the following is true?
A) There could potentially be one main effect and one interaction.
B) If a main effect is identified,then there will automatically be an interaction.
C) If there is an interaction,then there will not be a main effect.
D) The design allows for three hypotheses to be tested.
Unlock Deck
Unlock for access to all 16 flashcards in this deck.
Unlock Deck
k this deck
6
Use the following to answer questions
Scenario II is presents fabricated data inspired by the following study:
Greimel,E. ,Wanderer,S. ,Rothenberger,A. ,Herpertz-Dahlman,B. ,Konrad,K.& Roessner,V.(2011).Attentional performance in children and adolescents with tic disorder and co-occurring attention-deficit/hyperactivity disorder: new insights from a 2×2 factorial design study.Journal of Abnormal Child Psychology,39,819-828.
Effect of Tic Disorder and ADHD on Children's Attention
This study examined the extent to which tic disorder (TD)and attention-deficit/hyperactivity disorder (ADHD),both individually and combined,affects attention in children and adolescents.To that end,the researchers recruited children with and without TD,and children with and without ADHD.This 2 × 2 (TD × ADHD)design resulted in four conditions: children with no diagnosis (control),children with TD only,children with ADHD only,and children with TD+ADHD.The Child Behavior Checklist (CBCL)was used to quantify three components of attentional behavior: internalizing,externalizing,and attention.The results revealed that children with ADHD+TD had significantly more internalizing than those with TD alone.In addition,children with ADHD+TD as well as children with only ADHD had more externalizing than those with TD alone.Lastly,ADHD+TD children had more attention problems than those with only TD and those with only ADHD.The results of this study suggest that children with ADHD+TD have more behavioral problems than those with single diagnoses and those with no diagnoses.
(Scenario II)If the researchers also wanted to examine whether having ADHD+TD affected boys and girls differently,they would have had to use which test to analyze the data?
A) t-test for independent means
B) one-way ANOVA
C) two-way ANOVA
D) three-way ANOVA
Unlock Deck
Unlock for access to all 16 flashcards in this deck.
Unlock Deck
k this deck
7
Use the following to answer questions
Scenario I
Scenario I is based on fabricated data inspired by the following study:
Hennig-Thurau,T. ,Groth,M. ,Paul,M.& Gremler,D.D.(2006).Are all smiles created equal? How emotional contagion and emotional labor affect service relationships.Journal of Marketing,70,58-73.
Do Smiling Employees Improve Customer Satisfaction?
In this 2 × 2 between-subjects design,Hennig-Thurau and colleagues examined the effect of employee emotions and authenticity of the emotion on customer relations.A total of 223 undergraduate volunteers participated in this study.The participants were told they would be testing a new movie consulting service.The movie consulting service was created by the experimenters,and actors were hired to act as customer service representatives.Each participant approached the service desk where the actor asked them a number of questions about their movie preferences.The actors were trained to manipulate their smiling (high or low)and authenticity of smiling (high or low)during their interaction with each participant.After the interaction the participants were given a customer satisfaction survey.The results of this survey were used to examine the effect of each independent variable on customer satisfaction.Data analyses revealed that while the smiling had an effect on customer satisfaction,the authenticity of the emotion did not.Furthermore,the combination of both treatments (emotion × authenticity)had no impact on customer satisfaction.The results suggest that smiling,whether genuine or not,has a positive impact on customer satisfaction.Results are displayed in Figure 1.
Figure 1.Customers rate their experience more favorably when employees are smiling.
(Scenario I)The researchers of Scenario I conducted a follow-up study to examine whether customer satisfaction differed based on the smiling of the employee and sex of the participant.This design can be described as:
A) a 2 × 2 design.
B) a factorial design.
C) a hybrid design.
D) all of the above.
Scenario I
Scenario I is based on fabricated data inspired by the following study:
Hennig-Thurau,T. ,Groth,M. ,Paul,M.& Gremler,D.D.(2006).Are all smiles created equal? How emotional contagion and emotional labor affect service relationships.Journal of Marketing,70,58-73.
Do Smiling Employees Improve Customer Satisfaction?
In this 2 × 2 between-subjects design,Hennig-Thurau and colleagues examined the effect of employee emotions and authenticity of the emotion on customer relations.A total of 223 undergraduate volunteers participated in this study.The participants were told they would be testing a new movie consulting service.The movie consulting service was created by the experimenters,and actors were hired to act as customer service representatives.Each participant approached the service desk where the actor asked them a number of questions about their movie preferences.The actors were trained to manipulate their smiling (high or low)and authenticity of smiling (high or low)during their interaction with each participant.After the interaction the participants were given a customer satisfaction survey.The results of this survey were used to examine the effect of each independent variable on customer satisfaction.Data analyses revealed that while the smiling had an effect on customer satisfaction,the authenticity of the emotion did not.Furthermore,the combination of both treatments (emotion × authenticity)had no impact on customer satisfaction.The results suggest that smiling,whether genuine or not,has a positive impact on customer satisfaction.Results are displayed in Figure 1.
Figure 1.Customers rate their experience more favorably when employees are smiling.(Scenario I)The researchers of Scenario I conducted a follow-up study to examine whether customer satisfaction differed based on the smiling of the employee and sex of the participant.This design can be described as:
A) a 2 × 2 design.
B) a factorial design.
C) a hybrid design.
D) all of the above.
Unlock Deck
Unlock for access to all 16 flashcards in this deck.
Unlock Deck
k this deck
8
Use the following to answer questions
Scenario I
Scenario I is based on fabricated data inspired by the following study:
Hennig-Thurau,T. ,Groth,M. ,Paul,M.& Gremler,D.D.(2006).Are all smiles created equal? How emotional contagion and emotional labor affect service relationships.Journal of Marketing,70,58-73.
Do Smiling Employees Improve Customer Satisfaction?
In this 2 × 2 between-subjects design,Hennig-Thurau and colleagues examined the effect of employee emotions and authenticity of the emotion on customer relations.A total of 223 undergraduate volunteers participated in this study.The participants were told they would be testing a new movie consulting service.The movie consulting service was created by the experimenters,and actors were hired to act as customer service representatives.Each participant approached the service desk where the actor asked them a number of questions about their movie preferences.The actors were trained to manipulate their smiling (high or low)and authenticity of smiling (high or low)during their interaction with each participant.After the interaction the participants were given a customer satisfaction survey.The results of this survey were used to examine the effect of each independent variable on customer satisfaction.Data analyses revealed that while the smiling had an effect on customer satisfaction,the authenticity of the emotion did not.Furthermore,the combination of both treatments (emotion × authenticity)had no impact on customer satisfaction.The results suggest that smiling,whether genuine or not,has a positive impact on customer satisfaction.Results are displayed in Figure 1.
Figure 1.Customers rate their experience more favorably when employees are smiling.
(Scenario I)How many hypotheses were tested in the study described in Scenario I?
A) one
B) two
C) three
D) four
Scenario I
Scenario I is based on fabricated data inspired by the following study:
Hennig-Thurau,T. ,Groth,M. ,Paul,M.& Gremler,D.D.(2006).Are all smiles created equal? How emotional contagion and emotional labor affect service relationships.Journal of Marketing,70,58-73.
Do Smiling Employees Improve Customer Satisfaction?
In this 2 × 2 between-subjects design,Hennig-Thurau and colleagues examined the effect of employee emotions and authenticity of the emotion on customer relations.A total of 223 undergraduate volunteers participated in this study.The participants were told they would be testing a new movie consulting service.The movie consulting service was created by the experimenters,and actors were hired to act as customer service representatives.Each participant approached the service desk where the actor asked them a number of questions about their movie preferences.The actors were trained to manipulate their smiling (high or low)and authenticity of smiling (high or low)during their interaction with each participant.After the interaction the participants were given a customer satisfaction survey.The results of this survey were used to examine the effect of each independent variable on customer satisfaction.Data analyses revealed that while the smiling had an effect on customer satisfaction,the authenticity of the emotion did not.Furthermore,the combination of both treatments (emotion × authenticity)had no impact on customer satisfaction.The results suggest that smiling,whether genuine or not,has a positive impact on customer satisfaction.Results are displayed in Figure 1.
Figure 1.Customers rate their experience more favorably when employees are smiling.(Scenario I)How many hypotheses were tested in the study described in Scenario I?
A) one
B) two
C) three
D) four
Unlock Deck
Unlock for access to all 16 flashcards in this deck.
Unlock Deck
k this deck
9
Use the following to answer questions
Scenario I
Scenario I is based on fabricated data inspired by the following study:
Hennig-Thurau,T. ,Groth,M. ,Paul,M.& Gremler,D.D.(2006).Are all smiles created equal? How emotional contagion and emotional labor affect service relationships.Journal of Marketing,70,58-73.
Do Smiling Employees Improve Customer Satisfaction?
In this 2 × 2 between-subjects design,Hennig-Thurau and colleagues examined the effect of employee emotions and authenticity of the emotion on customer relations.A total of 223 undergraduate volunteers participated in this study.The participants were told they would be testing a new movie consulting service.The movie consulting service was created by the experimenters,and actors were hired to act as customer service representatives.Each participant approached the service desk where the actor asked them a number of questions about their movie preferences.The actors were trained to manipulate their smiling (high or low)and authenticity of smiling (high or low)during their interaction with each participant.After the interaction the participants were given a customer satisfaction survey.The results of this survey were used to examine the effect of each independent variable on customer satisfaction.Data analyses revealed that while the smiling had an effect on customer satisfaction,the authenticity of the emotion did not.Furthermore,the combination of both treatments (emotion × authenticity)had no impact on customer satisfaction.The results suggest that smiling,whether genuine or not,has a positive impact on customer satisfaction.Results are displayed in Figure 1.
Figure 1.Customers rate their experience more favorably when employees are smiling.
(Scenario I)Suppose each treatment condition described in Scenario I was conducted sequentially with the first treatment tested in the fall semester,and the second in the spring semester.Following testing all treatment conditions the participants received payment for their participation in the form of a gift card.Some received a gift card to a coffee shop and others received one to a megastore.Along with their gift card,participants also received a statement debriefing them of the actual intent of the study.Which of the following presents a potential confound?
A) debriefing letter
B) gift card type
C) month of testing
D) all are confounds
Scenario I
Scenario I is based on fabricated data inspired by the following study:
Hennig-Thurau,T. ,Groth,M. ,Paul,M.& Gremler,D.D.(2006).Are all smiles created equal? How emotional contagion and emotional labor affect service relationships.Journal of Marketing,70,58-73.
Do Smiling Employees Improve Customer Satisfaction?
In this 2 × 2 between-subjects design,Hennig-Thurau and colleagues examined the effect of employee emotions and authenticity of the emotion on customer relations.A total of 223 undergraduate volunteers participated in this study.The participants were told they would be testing a new movie consulting service.The movie consulting service was created by the experimenters,and actors were hired to act as customer service representatives.Each participant approached the service desk where the actor asked them a number of questions about their movie preferences.The actors were trained to manipulate their smiling (high or low)and authenticity of smiling (high or low)during their interaction with each participant.After the interaction the participants were given a customer satisfaction survey.The results of this survey were used to examine the effect of each independent variable on customer satisfaction.Data analyses revealed that while the smiling had an effect on customer satisfaction,the authenticity of the emotion did not.Furthermore,the combination of both treatments (emotion × authenticity)had no impact on customer satisfaction.The results suggest that smiling,whether genuine or not,has a positive impact on customer satisfaction.Results are displayed in Figure 1.
Figure 1.Customers rate their experience more favorably when employees are smiling.(Scenario I)Suppose each treatment condition described in Scenario I was conducted sequentially with the first treatment tested in the fall semester,and the second in the spring semester.Following testing all treatment conditions the participants received payment for their participation in the form of a gift card.Some received a gift card to a coffee shop and others received one to a megastore.Along with their gift card,participants also received a statement debriefing them of the actual intent of the study.Which of the following presents a potential confound?
A) debriefing letter
B) gift card type
C) month of testing
D) all are confounds
Unlock Deck
Unlock for access to all 16 flashcards in this deck.
Unlock Deck
k this deck
10
Use the following to answer questions
Scenario III
Scenario III is based on fabricated data inspired by the following study:
Spencer,S.J. ,Steele,C.M.& Quinn,D.M.(1999).Stereotype threat and women's math performance.Journal of Experimental Social Psychology,35,4-28.
Effect of Stereotype Threat on Math Study
The myth that men outperform women in math is widely believed by many individuals.The purpose of the study described in Scenario III was to determine if a sample of women whose math abilities equaled a sample of men would fall victim to this threat.To that end,28 adult men and 28 adult women were administered an easy math test or a difficult math test.The performance of men and women on both the easy and hard test was quantified.A two-factor ANOVA revealed a significant main effect for test,with participants scoring significantly better on the easy test.The analyses also revealed a main effect for sex,with men performing significantly better than women.The interaction between test difficulty and sex was also statistically significant.Further inspection of the data revealed that although men and women did not differ on the easy math test,women performed significantly less well than men on the difficult math test.Given that the screening criteria for participants including earning a grade of B or better in college calculus,and scoring in at least the 85th percentile on the math subsection of the ACT,the current study indicates that women do succumb to math stereotype threat but only when the math challenge is great.The data are presented in Figure 2.
Figure 2.Although women and men performed equally on an easy version of the math test,women performed significantly worse than men on the difficult version.
(Scenario III)Suppose the researchers described in Scenario III added a third level of difficulty to the math test and added a third variable (time to complete test).Participants were given 1 hour,2 hours,or 3 hours to complete the test.This design would now produce how many unique treatment conditions?
A) 3
B) 9
C) 18
D) 27
Scenario III
Scenario III is based on fabricated data inspired by the following study:
Spencer,S.J. ,Steele,C.M.& Quinn,D.M.(1999).Stereotype threat and women's math performance.Journal of Experimental Social Psychology,35,4-28.
Effect of Stereotype Threat on Math Study
The myth that men outperform women in math is widely believed by many individuals.The purpose of the study described in Scenario III was to determine if a sample of women whose math abilities equaled a sample of men would fall victim to this threat.To that end,28 adult men and 28 adult women were administered an easy math test or a difficult math test.The performance of men and women on both the easy and hard test was quantified.A two-factor ANOVA revealed a significant main effect for test,with participants scoring significantly better on the easy test.The analyses also revealed a main effect for sex,with men performing significantly better than women.The interaction between test difficulty and sex was also statistically significant.Further inspection of the data revealed that although men and women did not differ on the easy math test,women performed significantly less well than men on the difficult math test.Given that the screening criteria for participants including earning a grade of B or better in college calculus,and scoring in at least the 85th percentile on the math subsection of the ACT,the current study indicates that women do succumb to math stereotype threat but only when the math challenge is great.The data are presented in Figure 2.
Figure 2.Although women and men performed equally on an easy version of the math test,women performed significantly worse than men on the difficult version.(Scenario III)Suppose the researchers described in Scenario III added a third level of difficulty to the math test and added a third variable (time to complete test).Participants were given 1 hour,2 hours,or 3 hours to complete the test.This design would now produce how many unique treatment conditions?
A) 3
B) 9
C) 18
D) 27
Unlock Deck
Unlock for access to all 16 flashcards in this deck.
Unlock Deck
k this deck
11
Use the following to answer questions
Scenario III
Scenario III is based on fabricated data inspired by the following study:
Spencer,S.J. ,Steele,C.M.& Quinn,D.M.(1999).Stereotype threat and women's math performance.Journal of Experimental Social Psychology,35,4-28.
Effect of Stereotype Threat on Math Study
The myth that men outperform women in math is widely believed by many individuals.The purpose of the study described in Scenario III was to determine if a sample of women whose math abilities equaled a sample of men would fall victim to this threat.To that end,28 adult men and 28 adult women were administered an easy math test or a difficult math test.The performance of men and women on both the easy and hard test was quantified.A two-factor ANOVA revealed a significant main effect for test,with participants scoring significantly better on the easy test.The analyses also revealed a main effect for sex,with men performing significantly better than women.The interaction between test difficulty and sex was also statistically significant.Further inspection of the data revealed that although men and women did not differ on the easy math test,women performed significantly less well than men on the difficult math test.Given that the screening criteria for participants including earning a grade of B or better in college calculus,and scoring in at least the 85th percentile on the math subsection of the ACT,the current study indicates that women do succumb to math stereotype threat but only when the math challenge is great.The data are presented in Figure 2.
Figure 2.Although women and men performed equally on an easy version of the math test,women performed significantly worse than men on the difficult version.
(Scenario III)According to Scenario III,there was a main effect for sex,with men performing significantly better than women.To arrive at this conclusion,the researchers would have had to examine:
A) interaction means.
B) cell means.
C) marginal means.
D) factorial means.
Scenario III
Scenario III is based on fabricated data inspired by the following study:
Spencer,S.J. ,Steele,C.M.& Quinn,D.M.(1999).Stereotype threat and women's math performance.Journal of Experimental Social Psychology,35,4-28.
Effect of Stereotype Threat on Math Study
The myth that men outperform women in math is widely believed by many individuals.The purpose of the study described in Scenario III was to determine if a sample of women whose math abilities equaled a sample of men would fall victim to this threat.To that end,28 adult men and 28 adult women were administered an easy math test or a difficult math test.The performance of men and women on both the easy and hard test was quantified.A two-factor ANOVA revealed a significant main effect for test,with participants scoring significantly better on the easy test.The analyses also revealed a main effect for sex,with men performing significantly better than women.The interaction between test difficulty and sex was also statistically significant.Further inspection of the data revealed that although men and women did not differ on the easy math test,women performed significantly less well than men on the difficult math test.Given that the screening criteria for participants including earning a grade of B or better in college calculus,and scoring in at least the 85th percentile on the math subsection of the ACT,the current study indicates that women do succumb to math stereotype threat but only when the math challenge is great.The data are presented in Figure 2.
Figure 2.Although women and men performed equally on an easy version of the math test,women performed significantly worse than men on the difficult version.(Scenario III)According to Scenario III,there was a main effect for sex,with men performing significantly better than women.To arrive at this conclusion,the researchers would have had to examine:
A) interaction means.
B) cell means.
C) marginal means.
D) factorial means.
Unlock Deck
Unlock for access to all 16 flashcards in this deck.
Unlock Deck
k this deck
12
Use the following to answer questions
Scenario II is presents fabricated data inspired by the following study:
Greimel,E. ,Wanderer,S. ,Rothenberger,A. ,Herpertz-Dahlman,B. ,Konrad,K.& Roessner,V.(2011).Attentional performance in children and adolescents with tic disorder and co-occurring attention-deficit/hyperactivity disorder: new insights from a 2×2 factorial design study.Journal of Abnormal Child Psychology,39,819-828.
Effect of Tic Disorder and ADHD on Children's Attention
This study examined the extent to which tic disorder (TD)and attention-deficit/hyperactivity disorder (ADHD),both individually and combined,affects attention in children and adolescents.To that end,the researchers recruited children with and without TD,and children with and without ADHD.This 2 × 2 (TD × ADHD)design resulted in four conditions: children with no diagnosis (control),children with TD only,children with ADHD only,and children with TD+ADHD.The Child Behavior Checklist (CBCL)was used to quantify three components of attentional behavior: internalizing,externalizing,and attention.The results revealed that children with ADHD+TD had significantly more internalizing than those with TD alone.In addition,children with ADHD+TD as well as children with only ADHD had more externalizing than those with TD alone.Lastly,ADHD+TD children had more attention problems than those with only TD and those with only ADHD.The results of this study suggest that children with ADHD+TD have more behavioral problems than those with single diagnoses and those with no diagnoses.
(Scenario II)Suppose the authors of the study described in Scenario II had categorized children into high-ADHD,low-ADHD and no-ADHD groups.Children were also categorized has having TD or not having TD.This design can be expressed as:
A) 2 × 2.
B) 3 × 3.
C) 3 × 2.
D) 3 × 4.
Unlock Deck
Unlock for access to all 16 flashcards in this deck.
Unlock Deck
k this deck
13
Use the following to answer questions
Scenario I
Scenario I is based on fabricated data inspired by the following study:
Hennig-Thurau,T. ,Groth,M. ,Paul,M.& Gremler,D.D.(2006).Are all smiles created equal? How emotional contagion and emotional labor affect service relationships.Journal of Marketing,70,58-73.
Do Smiling Employees Improve Customer Satisfaction?
In this 2 × 2 between-subjects design,Hennig-Thurau and colleagues examined the effect of employee emotions and authenticity of the emotion on customer relations.A total of 223 undergraduate volunteers participated in this study.The participants were told they would be testing a new movie consulting service.The movie consulting service was created by the experimenters,and actors were hired to act as customer service representatives.Each participant approached the service desk where the actor asked them a number of questions about their movie preferences.The actors were trained to manipulate their smiling (high or low)and authenticity of smiling (high or low)during their interaction with each participant.After the interaction the participants were given a customer satisfaction survey.The results of this survey were used to examine the effect of each independent variable on customer satisfaction.Data analyses revealed that while the smiling had an effect on customer satisfaction,the authenticity of the emotion did not.Furthermore,the combination of both treatments (emotion × authenticity)had no impact on customer satisfaction.The results suggest that smiling,whether genuine or not,has a positive impact on customer satisfaction.Results are displayed in Figure 1.
Figure 1.Customers rate their experience more favorably when employees are smiling.
(Scenario I)Which of the following hypothesis did the results of the study described in Scenario I support?
A) There is a main effect for emotion,but no main effect for authenticity or interaction between emotion and authenticity on customer satisfaction.
B) There is a main effect for emotion and a main effect for authenticity,but not an interaction between emotion and authenticity on customer satisfaction.
C) There is a main effect for emotion,a main effect for interaction and an interaction between emotion and authenticity on customer satisfaction.
D) There is no effect for emotion,authenticity,or emotion × authenticity interaction on customer satisfaction.
Scenario I
Scenario I is based on fabricated data inspired by the following study:
Hennig-Thurau,T. ,Groth,M. ,Paul,M.& Gremler,D.D.(2006).Are all smiles created equal? How emotional contagion and emotional labor affect service relationships.Journal of Marketing,70,58-73.
Do Smiling Employees Improve Customer Satisfaction?
In this 2 × 2 between-subjects design,Hennig-Thurau and colleagues examined the effect of employee emotions and authenticity of the emotion on customer relations.A total of 223 undergraduate volunteers participated in this study.The participants were told they would be testing a new movie consulting service.The movie consulting service was created by the experimenters,and actors were hired to act as customer service representatives.Each participant approached the service desk where the actor asked them a number of questions about their movie preferences.The actors were trained to manipulate their smiling (high or low)and authenticity of smiling (high or low)during their interaction with each participant.After the interaction the participants were given a customer satisfaction survey.The results of this survey were used to examine the effect of each independent variable on customer satisfaction.Data analyses revealed that while the smiling had an effect on customer satisfaction,the authenticity of the emotion did not.Furthermore,the combination of both treatments (emotion × authenticity)had no impact on customer satisfaction.The results suggest that smiling,whether genuine or not,has a positive impact on customer satisfaction.Results are displayed in Figure 1.
Figure 1.Customers rate their experience more favorably when employees are smiling.(Scenario I)Which of the following hypothesis did the results of the study described in Scenario I support?
A) There is a main effect for emotion,but no main effect for authenticity or interaction between emotion and authenticity on customer satisfaction.
B) There is a main effect for emotion and a main effect for authenticity,but not an interaction between emotion and authenticity on customer satisfaction.
C) There is a main effect for emotion,a main effect for interaction and an interaction between emotion and authenticity on customer satisfaction.
D) There is no effect for emotion,authenticity,or emotion × authenticity interaction on customer satisfaction.
Unlock Deck
Unlock for access to all 16 flashcards in this deck.
Unlock Deck
k this deck
14
Use the following to answer questions
Scenario I
Scenario I is based on fabricated data inspired by the following study:
Hennig-Thurau,T. ,Groth,M. ,Paul,M.& Gremler,D.D.(2006).Are all smiles created equal? How emotional contagion and emotional labor affect service relationships.Journal of Marketing,70,58-73.
Do Smiling Employees Improve Customer Satisfaction?
In this 2 × 2 between-subjects design,Hennig-Thurau and colleagues examined the effect of employee emotions and authenticity of the emotion on customer relations.A total of 223 undergraduate volunteers participated in this study.The participants were told they would be testing a new movie consulting service.The movie consulting service was created by the experimenters,and actors were hired to act as customer service representatives.Each participant approached the service desk where the actor asked them a number of questions about their movie preferences.The actors were trained to manipulate their smiling (high or low)and authenticity of smiling (high or low)during their interaction with each participant.After the interaction the participants were given a customer satisfaction survey.The results of this survey were used to examine the effect of each independent variable on customer satisfaction.Data analyses revealed that while the smiling had an effect on customer satisfaction,the authenticity of the emotion did not.Furthermore,the combination of both treatments (emotion × authenticity)had no impact on customer satisfaction.The results suggest that smiling,whether genuine or not,has a positive impact on customer satisfaction.Results are displayed in Figure 1.
Figure 1.Customers rate their experience more favorably when employees are smiling.
(Scenario I)Figure 1 supports which of the following hypotheses?
A) main effect for smiling
B) main effect for authenticity
C) interaction between smiling and authenticity
D) all of the above hypotheses are supported
Scenario I
Scenario I is based on fabricated data inspired by the following study:
Hennig-Thurau,T. ,Groth,M. ,Paul,M.& Gremler,D.D.(2006).Are all smiles created equal? How emotional contagion and emotional labor affect service relationships.Journal of Marketing,70,58-73.
Do Smiling Employees Improve Customer Satisfaction?
In this 2 × 2 between-subjects design,Hennig-Thurau and colleagues examined the effect of employee emotions and authenticity of the emotion on customer relations.A total of 223 undergraduate volunteers participated in this study.The participants were told they would be testing a new movie consulting service.The movie consulting service was created by the experimenters,and actors were hired to act as customer service representatives.Each participant approached the service desk where the actor asked them a number of questions about their movie preferences.The actors were trained to manipulate their smiling (high or low)and authenticity of smiling (high or low)during their interaction with each participant.After the interaction the participants were given a customer satisfaction survey.The results of this survey were used to examine the effect of each independent variable on customer satisfaction.Data analyses revealed that while the smiling had an effect on customer satisfaction,the authenticity of the emotion did not.Furthermore,the combination of both treatments (emotion × authenticity)had no impact on customer satisfaction.The results suggest that smiling,whether genuine or not,has a positive impact on customer satisfaction.Results are displayed in Figure 1.
Figure 1.Customers rate their experience more favorably when employees are smiling.(Scenario I)Figure 1 supports which of the following hypotheses?
A) main effect for smiling
B) main effect for authenticity
C) interaction between smiling and authenticity
D) all of the above hypotheses are supported
Unlock Deck
Unlock for access to all 16 flashcards in this deck.
Unlock Deck
k this deck
15
Use the following to answer questions
Scenario II is presents fabricated data inspired by the following study:
Greimel,E. ,Wanderer,S. ,Rothenberger,A. ,Herpertz-Dahlman,B. ,Konrad,K.& Roessner,V.(2011).Attentional performance in children and adolescents with tic disorder and co-occurring attention-deficit/hyperactivity disorder: new insights from a 2×2 factorial design study.Journal of Abnormal Child Psychology,39,819-828.
Effect of Tic Disorder and ADHD on Children's Attention
This study examined the extent to which tic disorder (TD)and attention-deficit/hyperactivity disorder (ADHD),both individually and combined,affects attention in children and adolescents.To that end,the researchers recruited children with and without TD,and children with and without ADHD.This 2 × 2 (TD × ADHD)design resulted in four conditions: children with no diagnosis (control),children with TD only,children with ADHD only,and children with TD+ADHD.The Child Behavior Checklist (CBCL)was used to quantify three components of attentional behavior: internalizing,externalizing,and attention.The results revealed that children with ADHD+TD had significantly more internalizing than those with TD alone.In addition,children with ADHD+TD as well as children with only ADHD had more externalizing than those with TD alone.Lastly,ADHD+TD children had more attention problems than those with only TD and those with only ADHD.The results of this study suggest that children with ADHD+TD have more behavioral problems than those with single diagnoses and those with no diagnoses.
(Scenario II)Suppose the results of Scenario II were that kids with ADHD had more behavioral problems when they did not have TD,and that kids with high TD had more behavioral problems when they did not have ADHD.This would indicate what type of relationship between the two independent variables?
A) marginal
B) hybrid
C) suppression
D) synergistic
Unlock Deck
Unlock for access to all 16 flashcards in this deck.
Unlock Deck
k this deck
16
Use the following to answer questions
Scenario II is presents fabricated data inspired by the following study:
Greimel,E. ,Wanderer,S. ,Rothenberger,A. ,Herpertz-Dahlman,B. ,Konrad,K.& Roessner,V.(2011).Attentional performance in children and adolescents with tic disorder and co-occurring attention-deficit/hyperactivity disorder: new insights from a 2×2 factorial design study.Journal of Abnormal Child Psychology,39,819-828.
Effect of Tic Disorder and ADHD on Children's Attention
This study examined the extent to which tic disorder (TD)and attention-deficit/hyperactivity disorder (ADHD),both individually and combined,affects attention in children and adolescents.To that end,the researchers recruited children with and without TD,and children with and without ADHD.This 2 × 2 (TD × ADHD)design resulted in four conditions: children with no diagnosis (control),children with TD only,children with ADHD only,and children with TD+ADHD.The Child Behavior Checklist (CBCL)was used to quantify three components of attentional behavior: internalizing,externalizing,and attention.The results revealed that children with ADHD+TD had significantly more internalizing than those with TD alone.In addition,children with ADHD+TD as well as children with only ADHD had more externalizing than those with TD alone.Lastly,ADHD+TD children had more attention problems than those with only TD and those with only ADHD.The results of this study suggest that children with ADHD+TD have more behavioral problems than those with single diagnoses and those with no diagnoses.
(Scenario II)Which of the following may have been the results of the ANOVA performed by the authors of Scenario II?
A) F (1,36)= 4.92,p < .05
B) F (2,36)= 4.92,p < .05
C) F (1,36)= 4.92,p > .05
D) F (2,36)= 4.92,p >.05
Unlock Deck
Unlock for access to all 16 flashcards in this deck.
Unlock Deck
k this deck
Unlock Deck
Unlock for access to all 16 flashcards in this deck.


