Deck 13: Policy Effects and Costs Shocks in the Asad Model
Full screen (f)
Question
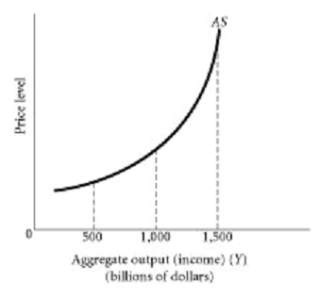
Using the graph above, at aggregate output levels below $500 billion what is this economy likely experiencing?
Question
Question
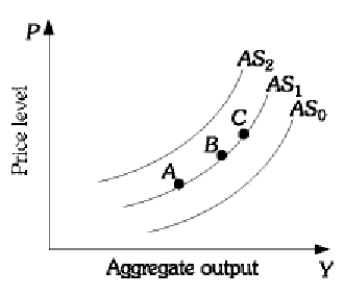
Using the above graph, if Hurricane Katrina destroyed a large portion of the infrastructure in the Gulf Coast of the United States, how would this be portrayed using the information depicted in the graph if we assume the economy was originally at point B?
Question
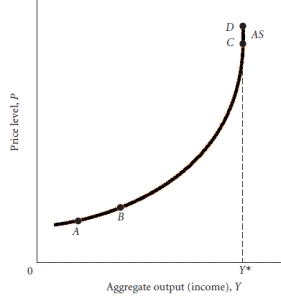 Figure 28.1
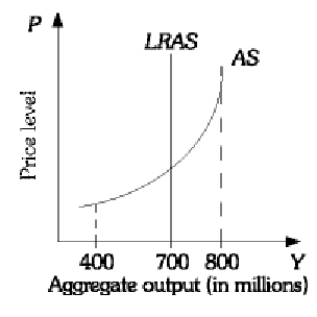
Figure 28.1 depicts a short-run aggregate supply curve. Explain why it is shaped this way. Be very specific.
Question
Question
Question
Question
Using the graph above, where does the economy reach capacity and how do you know?
Question
Question
Question
Question
Question
Question
Figure 28.1Consider the case in which there is an increase in aggregate demand, and assume that firms in the economy are imperfectly competitive. The increase in aggregate demand shifts the demand curves facing individual firms out. If the firms' wages do not also increase, then firms can increase their profits by raising prices and increasing output. In other words, the response of the overall economy to the aggregate demand increase will be an increase in output and the price level-a positive slope of the short-run AS curve. What is the key assumption in this story that makes it work? Explain.
Question
Question
Using the graph above, at aggregate output levels above $1500 billion what is happening to both costs and prices?
Question
Question
Using the graph above, between the output levels of $500 billion and $1500 billion what is the relationship between the price level and aggregate output?
Question
Using the above graph, if the economy is initially at point B how would you describe a change which resulted in an increase in aggregate supply?
Question
Question
Question
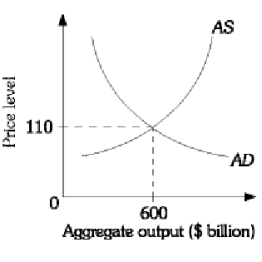
Using the above graph assume that the economy is in equilibrium at an output level of $600 billion and a price level of 110. What would happen to the aggregate output level and the price level if wages fell and their was an increase in government spending?
Question
Question
Question
Using the above graph assume that the economy is in equilibrium at an output level of $600 billion and a price level of 110. What would happen to the aggregate output level and the price level with an expansionary monetary policy?
Question
Monetary and Fiscal Policy Effects
Using the above graph, which output level is is considered potential output? Explain.
Using the above graph, which output level is is considered potential output? Explain.
Question
Question
Question
Question
Question
Question
Monetary and Fiscal Policy Effects
Using the above graph, how would you characterize an output level of $800 million?
Using the above graph, how would you characterize an output level of $800 million?
Question
Question
Question
Question
Question
Question
Using the above graph assume that the economy is in equilibrium at an output level of $600 billion and a price level of 110. What would happen to the aggregate output level and the price level in th face of an oil embargo?
Question
Question
Question
Question
Question
Question
Question
Question
Question
Question
Question
Question
Question
Question
Question
Question
Question
Question
Question
Question
Question
Question
Question
Question
Question
Question
Question
Question
Question
Question
Question
Question
Question
Question
Question
Question
Question
Question
Question
Question
Question
Question

Unlock Deck
Sign up to unlock the cards in this deck!
Unlock Deck
Unlock Deck
1/89
Play
Full screen (f)
Deck 13: Policy Effects and Costs Shocks in the Asad Model
1
Using the graph above, at aggregate output levels below $500 billion what is this economy likely experiencing?
It is likely experiencing excess capacity and a recession.
2
What do the authors of the text mean when they say that an "aggregate supply curve" in the traditional sense of the word supply does not exist?
They are arguing that because input prices change when the overall price level changes and because many firms in the economy set prices as well as output it is perhaps not valid to speak of the aggregate supply curve as a market supply curve.
3
Using the above graph, if Hurricane Katrina destroyed a large portion of the infrastructure in the Gulf Coast of the United States, how would this be portrayed using the information depicted in the graph if we assume the economy was originally at point B?
The short-run aggregate supply curve would shift from AS to AS .
4
Figure 28.1Figure 28.1 depicts a short-run aggregate supply curve. Explain why it is shaped this way. Be very specific.
Unlock Deck
Unlock for access to all 89 flashcards in this deck.
Unlock Deck
k this deck
5
Aggregating the production of vastly disparate goods whose units of measurement vary widely is a problem. How do macroeconomists attempt to reconcile this difficulty?
Unlock Deck
Unlock for access to all 89 flashcards in this deck.
Unlock Deck
k this deck
6
Using aggregate supply and aggregate demand curves, indicate what impact each of the following would have on the price level and on the equilibrium level of aggregate output in the short run.
(a) The Fed buys bonds in the open market.
(b) The economy is far below capacity and the government increases government spending.
(c) The floods in the Midwest in 1993 destroyed a large portion of the United States' agricultural crops.
(a) The Fed buys bonds in the open market.
(b) The economy is far below capacity and the government increases government spending.
(c) The floods in the Midwest in 1993 destroyed a large portion of the United States' agricultural crops.
Unlock Deck
Unlock for access to all 89 flashcards in this deck.
Unlock Deck
k this deck
7
What might keep the aggregate supply curve from becoming completely vertical?
Unlock Deck
Unlock for access to all 89 flashcards in this deck.
Unlock Deck
k this deck
8
Using the graph above, where does the economy reach capacity and how do you know?
Unlock Deck
Unlock for access to all 89 flashcards in this deck.
Unlock Deck
k this deck
9
Draw an aggregate supply curve in which all prices (both input and output prices) change at the same rate.
Unlock Deck
Unlock for access to all 89 flashcards in this deck.
Unlock Deck
k this deck
10
Explain in broad terms what the equilibrium price level and equilibrium output level correspond to with respect to the money market and the goods market.
Unlock Deck
Unlock for access to all 89 flashcards in this deck.
Unlock Deck
k this deck
11
If input prices are increasing at the same rate as prices what can we conclude about the shape of the aggregate supply curve?
Unlock Deck
Unlock for access to all 89 flashcards in this deck.
Unlock Deck
k this deck
12
What is the macroeconomic equilibrium price level?
Unlock Deck
Unlock for access to all 89 flashcards in this deck.
Unlock Deck
k this deck
13
The reaction of firms to an expansion in aggregate demand is likely to depend on what two factors?
Unlock Deck
Unlock for access to all 89 flashcards in this deck.
Unlock Deck
k this deck
14
Figure 28.1Consider the case in which there is an increase in aggregate demand, and assume that firms in the economy are imperfectly competitive. The increase in aggregate demand shifts the demand curves facing individual firms out. If the firms' wages do not also increase, then firms can increase their profits by raising prices and increasing output. In other words, the response of the overall economy to the aggregate demand increase will be an increase in output and the price level-a positive slope of the short-run AS curve. What is the key assumption in this story that makes it work? Explain.
Unlock Deck
Unlock for access to all 89 flashcards in this deck.
Unlock Deck
k this deck
15
Explain why the aggregate supply curve is not a market supply curve.
Unlock Deck
Unlock for access to all 89 flashcards in this deck.
Unlock Deck
k this deck
16
Using the graph above, at aggregate output levels above $1500 billion what is happening to both costs and prices?
Unlock Deck
Unlock for access to all 89 flashcards in this deck.
Unlock Deck
k this deck
17
Explain what the aggregate supply curve represents.
Unlock Deck
Unlock for access to all 89 flashcards in this deck.
Unlock Deck
k this deck
18
Using the graph above, between the output levels of $500 billion and $1500 billion what is the relationship between the price level and aggregate output?
Unlock Deck
Unlock for access to all 89 flashcards in this deck.
Unlock Deck
k this deck
19
Using the above graph, if the economy is initially at point B how would you describe a change which resulted in an increase in aggregate supply?
Unlock Deck
Unlock for access to all 89 flashcards in this deck.
Unlock Deck
k this deck
20
Define aggregate supply.
Unlock Deck
Unlock for access to all 89 flashcards in this deck.
Unlock Deck
k this deck
21
List some of the elements that have increased the aggregate supply curve during the 1960s and 1970s that relate to labor.
Unlock Deck
Unlock for access to all 89 flashcards in this deck.
Unlock Deck
k this deck
22
Using the above graph assume that the economy is in equilibrium at an output level of $600 billion and a price level of 110. What would happen to the aggregate output level and the price level if wages fell and their was an increase in government spending?
Unlock Deck
Unlock for access to all 89 flashcards in this deck.
Unlock Deck
k this deck
23
Explain what a cost shock or supply shock is.
Unlock Deck
Unlock for access to all 89 flashcards in this deck.
Unlock Deck
k this deck
24
Coal is used as a source of energy in many manufacturing processes. Assume a long strike by coal miners reduced the supply of coal and increased the price of coal. What impact would this have on the economy? Use the AS/AD model to explain your answer.
Unlock Deck
Unlock for access to all 89 flashcards in this deck.
Unlock Deck
k this deck
25
Using the above graph assume that the economy is in equilibrium at an output level of $600 billion and a price level of 110. What would happen to the aggregate output level and the price level with an expansionary monetary policy?
Unlock Deck
Unlock for access to all 89 flashcards in this deck.
Unlock Deck
k this deck
26
Monetary and Fiscal Policy Effects
Using the above graph, which output level is is considered potential output? Explain.
Using the above graph, which output level is is considered potential output? Explain.
Unlock Deck
Unlock for access to all 89 flashcards in this deck.
Unlock Deck
k this deck
27
Why will the price level tend to rise as firms get closer to their productive capacity?
Unlock Deck
Unlock for access to all 89 flashcards in this deck.
Unlock Deck
k this deck
28
Explain why the aggregate supply curve is likely to be fairly flat at low levels of aggregate output.
Unlock Deck
Unlock for access to all 89 flashcards in this deck.
Unlock Deck
k this deck
29
Explain how economic decline can happen as it relates to the capital stock.
Unlock Deck
Unlock for access to all 89 flashcards in this deck.
Unlock Deck
k this deck
30
Graphically illustrate and explain the aggregate supply (AS) curve.
Unlock Deck
Unlock for access to all 89 flashcards in this deck.
Unlock Deck
k this deck
31
Illustrate what happens to the aggregate supply curve when there is an increase in costs (for example, and increase in wage rates or energy prices).
Unlock Deck
Unlock for access to all 89 flashcards in this deck.
Unlock Deck
k this deck
32
Monetary and Fiscal Policy Effects
Using the above graph, how would you characterize an output level of $800 million?
Using the above graph, how would you characterize an output level of $800 million?
Unlock Deck
Unlock for access to all 89 flashcards in this deck.
Unlock Deck
k this deck
33
At what point might the aggregate supply curve become completely vertical? Why might this be true?
Unlock Deck
Unlock for access to all 89 flashcards in this deck.
Unlock Deck
k this deck
34
Explain why it is not realistic to assume that all input prices (including wages) are fixed when deriving the short-run aggregate supply curve. What is a better assumption?
Unlock Deck
Unlock for access to all 89 flashcards in this deck.
Unlock Deck
k this deck
35
Illustrate the effects of an increase in economic growth on the aggregate supply curve.
Unlock Deck
Unlock for access to all 89 flashcards in this deck.
Unlock Deck
k this deck
36
Discuss why the aggregate supply function is relatively flat within the low ranges of aggregate output. Discuss why the aggregate supply function is relatively vertical within the ranges of high aggregate output.
Unlock Deck
Unlock for access to all 89 flashcards in this deck.
Unlock Deck
k this deck
37
Why is the short-run aggregate supply curve controversial?
Unlock Deck
Unlock for access to all 89 flashcards in this deck.
Unlock Deck
k this deck
38
Using the above graph assume that the economy is in equilibrium at an output level of $600 billion and a price level of 110. What would happen to the aggregate output level and the price level in th face of an oil embargo?
Unlock Deck
Unlock for access to all 89 flashcards in this deck.
Unlock Deck
k this deck
39
Discuss how public policy during the 1980s was aimed at shifting aggregate supply.
Unlock Deck
Unlock for access to all 89 flashcards in this deck.
Unlock Deck
k this deck
40
If the United States were to pass legislation that would make it easier for people to emigrate to the United States what impact would this have on the economy? Use the AS/AD model to explain your answer.
Unlock Deck
Unlock for access to all 89 flashcards in this deck.
Unlock Deck
k this deck
41
Explain what is meant by potential output.
Unlock Deck
Unlock for access to all 89 flashcards in this deck.
Unlock Deck
k this deck
42
Critically evaluate the following statement. "If the price of a commodity is rising sharply you can be sure that it is the result of inflation."
Unlock Deck
Unlock for access to all 89 flashcards in this deck.
Unlock Deck
k this deck
43
Show using graphs and explain what is the likely impact of expansionary policies when the economy is operating at excess capacity on the flat, horizontal portion of the AS curve? Graphically illustrate this policy effect.
Unlock Deck
Unlock for access to all 89 flashcards in this deck.
Unlock Deck
k this deck
44
What is sustained inflation and what do most economists believe is its root cause?
Unlock Deck
Unlock for access to all 89 flashcards in this deck.
Unlock Deck
k this deck
45
Demonstrate on a graph the effect on output and the price level if there is an increase in aggregate demand along the nearly flat part of the aggregate supply curve.
Unlock Deck
Unlock for access to all 89 flashcards in this deck.
Unlock Deck
k this deck
46
Explain why expansionary policy is not likely to work very well when the economy is operating along the steeper portion of the aggregate supply curve.
Unlock Deck
Unlock for access to all 89 flashcards in this deck.
Unlock Deck
k this deck
47
Explain demand-pull inflation
Unlock Deck
Unlock for access to all 89 flashcards in this deck.
Unlock Deck
k this deck
48
Explain why the AS curve cannot be the sum of the supply curves of all the individual firms in the economy.
Unlock Deck
Unlock for access to all 89 flashcards in this deck.
Unlock Deck
k this deck
49
Explain how external shocks might casue cost-push inflation.
Unlock Deck
Unlock for access to all 89 flashcards in this deck.
Unlock Deck
k this deck
50
According to economists who believe the aggregate supply is vertical in the long run, what is the adjustment process in the economy if output is below full employment?
Unlock Deck
Unlock for access to all 89 flashcards in this deck.
Unlock Deck
k this deck
51
Explain why the aggregate supply curve is flat in the short run and steep in the long run.
Unlock Deck
Unlock for access to all 89 flashcards in this deck.
Unlock Deck
k this deck
52
Indicate the effects of cost shocks upon the aggregate supply (AS) function.
Unlock Deck
Unlock for access to all 89 flashcards in this deck.
Unlock Deck
k this deck
53
Show the effect on the price level and output of a shift of the aggregate demand curve when the economy is operating at or near maximum capacity.
Unlock Deck
Unlock for access to all 89 flashcards in this deck.
Unlock Deck
k this deck
54
Draw the short-run aggregate supply and long-run aggregate supply curve on the same graph along with the aggregate demand curve. Illustrate the effects of an increase in aggregate demand on both the price level and the output level both in the short-run and the long-run.
Unlock Deck
Unlock for access to all 89 flashcards in this deck.
Unlock Deck
k this deck
55
What is the general economic view regarding whether the AS curve is vertical in the long run?
Unlock Deck
Unlock for access to all 89 flashcards in this deck.
Unlock Deck
k this deck
56
Suppose the economy is initially operating at the potential level of output. Graphically illustrate and explain what effect a one-time permanent reduction in the money supply will have on output and the price level in the short run and in the long run.
Unlock Deck
Unlock for access to all 89 flashcards in this deck.
Unlock Deck
k this deck
57
Explain cost-push inflation and give an example of a possible cause.
Unlock Deck
Unlock for access to all 89 flashcards in this deck.
Unlock Deck
k this deck
58
What is the likely impact of expansionary policies when the economy is operating at full capacity on the vertical portion of the AS curve?
Unlock Deck
Unlock for access to all 89 flashcards in this deck.
Unlock Deck
k this deck
59
Explain why increases in long-run aggregate supply are the only means to achieve sustained increases in aggregate output.
Unlock Deck
Unlock for access to all 89 flashcards in this deck.
Unlock Deck
k this deck
60
Explain how changes in the exchange rate might casue cost-push inflation.
Unlock Deck
Unlock for access to all 89 flashcards in this deck.
Unlock Deck
k this deck
61
If inflation is really a monetary phenomena does it really make sense to talk about rising oil prices as a cause of inflation?
Unlock Deck
Unlock for access to all 89 flashcards in this deck.
Unlock Deck
k this deck
62
Explain how action by the Fed might bring about a hyperinflation when the economy is operating on the steep part of the AS curve.
Unlock Deck
Unlock for access to all 89 flashcards in this deck.
Unlock Deck
k this deck
63
Explain why costs shocks are bad news for policy makers.
Unlock Deck
Unlock for access to all 89 flashcards in this deck.
Unlock Deck
k this deck
64
Assume there are two goods in an economy: bread and bottled water. Assume bread sells for $2 per loaf and water sells for $1 per gallon the first year and in the second year the price of a loaf rises to $2.50 and bottled water rises to $1.25. Why is averaging these two prices meaningless in terms of trying to figure out whether or not there is inflation in the economy?
Unlock Deck
Unlock for access to all 89 flashcards in this deck.
Unlock Deck
k this deck
65
Assume the Federal Reserve Bank chairman implores business people not to raise prices as a means of controlling inflation. Why is this likely not to work?
Unlock Deck
Unlock for access to all 89 flashcards in this deck.
Unlock Deck
k this deck
66
Why might the general public in a country suffering from hyperinflation choose to purchase cars they don't need, art and precious metals instead of depositing their money in banks where at least they will earn interest?
Unlock Deck
Unlock for access to all 89 flashcards in this deck.
Unlock Deck
k this deck
67
Define stagflation.
Unlock Deck
Unlock for access to all 89 flashcards in this deck.
Unlock Deck
k this deck
68
China owns hundreds of billions of dollars worth of U.S. federal debt. If suddenly they lost their appetite for purchasing federal debt and began selling off large portions of their U.S. debt holdings, how would this hamper the efforts of the federal government's effort to maintain continued deficit spending, even with the help of the Federal Reserve?
Unlock Deck
Unlock for access to all 89 flashcards in this deck.
Unlock Deck
k this deck
69
Assume the price of everything in the economy including wages and income were to double almost overnight. Explain why this wouldn't necessarily have any impact on production.
Unlock Deck
Unlock for access to all 89 flashcards in this deck.
Unlock Deck
k this deck
70
Explain how inflation can be "built into the system."
Unlock Deck
Unlock for access to all 89 flashcards in this deck.
Unlock Deck
k this deck
71
Explain under which circumstances the government will not be able to increase non-taxed-financed spending without the Fed's cooperation.
Unlock Deck
Unlock for access to all 89 flashcards in this deck.
Unlock Deck
k this deck
72
Assume the Congress passes legislation to spend $1 trillion on new highways and roads across the country. If it is determined that there aren't enough engineers in the United States to build these highways what will be the actual impact of this $1 trillion spending?
Unlock Deck
Unlock for access to all 89 flashcards in this deck.
Unlock Deck
k this deck
73
Using aggregate supply and aggregate demand analysis illustrate with the use of a graph the effect of cost-push inflation on the economy.
Unlock Deck
Unlock for access to all 89 flashcards in this deck.
Unlock Deck
k this deck
74
Assume the economy is operating in the vertical range of the AS curve and the government increases spending. Explain how Fed accommodation can trigger further increases in the price level.
Unlock Deck
Unlock for access to all 89 flashcards in this deck.
Unlock Deck
k this deck
75
Explain how expectations can affect the price level.
Unlock Deck
Unlock for access to all 89 flashcards in this deck.
Unlock Deck
k this deck
76
Define hyperinflation.
Unlock Deck
Unlock for access to all 89 flashcards in this deck.
Unlock Deck
k this deck
77
Assuming a decline in money demand explains what will happen to planned investment and aggregate output.
Unlock Deck
Unlock for access to all 89 flashcards in this deck.
Unlock Deck
k this deck
78
Suppose minimum wages are tied to the consumer price index.How might this contribute to cost-push inflation?
Unlock Deck
Unlock for access to all 89 flashcards in this deck.
Unlock Deck
k this deck
79
Assuming that the Fed takes no action to change the money supply, as the price level increases, what chain of events will occur?
Unlock Deck
Unlock for access to all 89 flashcards in this deck.
Unlock Deck
k this deck
80
Could a high degree of monopoly power in an economy provide the explanation for inflation?
Unlock Deck
Unlock for access to all 89 flashcards in this deck.
Unlock Deck
k this deck
Unlock Deck
Unlock for access to all 89 flashcards in this deck.


