Deck 5: Sampling Distributions
Full screen (f)
Question
A study,conducted by Jackson et al.and published in the journal Cancer Causes and Control in 2009,examined 33,938 women aged 40 to 84 years old who resided in California and who reported having had a mammogram within the last 2 years.The researchers were interested in characteristics of women who routinely obtain mammograms,as suggested by the American Cancer Society,to detect breast cancer.The table below provides a column that refers to the sample size and provides characteristics of the 33,938 women who were included in the study who reported having had a mammogram. 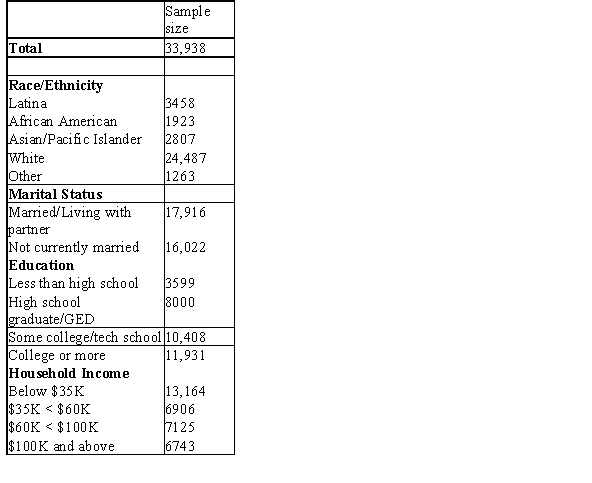 The data in the sample size column can be considered
A)statistics.
B)a parameter.
C)the population.
D)None of the above
The data in the sample size column can be consideredA)statistics.
B)a parameter.
C)the population.
D)None of the above
Question
A study,conducted by Jackson et al.and published in the journal Cancer Causes and Control in 2009,examined 33,938 women aged 40 to 84 years old who resided in California and who reported having had a mammogram within the last 2 years.The researchers were interested in characteristics of women who routinely obtain mammograms,as suggested by the American Cancer Society,to detect breast cancer.The table below provides a column that refers to the sample size and provides characteristics of the 33,938 women who were included in the study who reported having had a mammogram.  The proportion of the sample that were Latina is an example of a
A)statistic.
B)parameter.
C)sample.
D)population.
The proportion of the sample that were Latina is an example of aA)statistic.
B)parameter.
C)sample.
D)population.
Question
A study,conducted by Jackson et al.and published in the journal Cancer Causes and Control in 2009,examined 33,938 women aged 40 to 84 years old who resided in California and who reported having had a mammogram within the last 2 years.The researchers were interested in characteristics of women who routinely obtain mammograms,as suggested by the American Cancer Society,to detect breast cancer.The table below provides a column that refers to the sample size and provides characteristics of the 33,938 women who were included in the study who reported having had a mammogram. 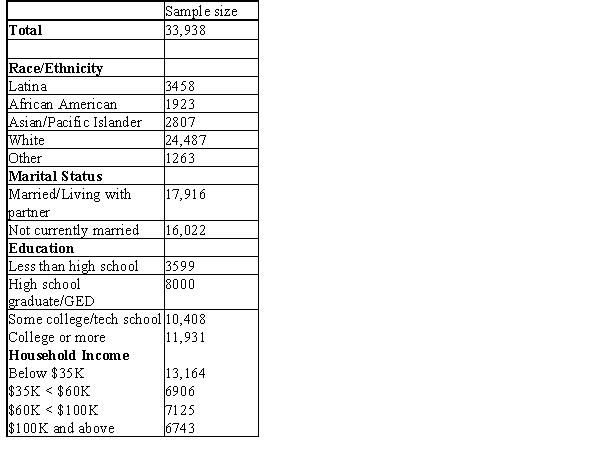 What is the value of the statistic,
  ,that represents the proportion of women in California who have less than a high school education?
A)3599/33,938
B)33,938/3599
C)3599
D)None of the above
What is the value of the statistic, ,that represents the proportion of women in California who have less than a high school education?A)3599/33,938
B)33,938/3599
C)3599
D)None of the above
Question
Suppose you are going to roll a six-sided die 60 times and record  ,the proportion of times that an even number (2,4,or 6)is showing.Suppose you decide to roll the die 200 times instead of 60 times.How will this affect the center and spread of the sampling distribution of
  ?
?
A)Both the center and the spread will remain the same.
B)The center will remain the same,but the spread will increase.
C)The center will remain the same,but the spread will decrease.
D)Both the center and the spread will decrease.
,the proportion of times that an even number (2,4,or 6)is showing.Suppose you decide to roll the die 200 times instead of 60 times.How will this affect the center and spread of the sampling distribution of ?A)Both the center and the spread will remain the same.
B)The center will remain the same,but the spread will increase.
C)The center will remain the same,but the spread will decrease.
D)Both the center and the spread will decrease.
Question
Question
Question
Question
The number of undergraduates at Johns Hopkins University is approximately 2000,while the number at Ohio State University is approximately 40,000.A simple random sample of 50 undergraduates at Johns Hopkins University will be obtained to estimate the proportion of all Johns Hopkins students who feel that drinking is a problem among college students.A simple random sample of 50 undergraduates at Ohio State University will be obtained to estimate the proportion of all Ohio State students who feel that drinking is a problem among college students.What can we conclude about the sampling variability in the sample proportion,  ,calculated from the sample at Johns Hopkins as compared to that in the sample proportion from Ohio State?
A)The sample proportion from Johns Hopkins will have less sampling variability than that from Ohio State.
B)The sample proportion from Johns Hopkins will have more sampling variability than that from Ohio State.
C)The sample proportion from Johns Hopkins will have about the same sampling variability as that from Ohio State.
D)It is impossible to make any statements about the sampling variability of the two samples because the students surveyed were different.
,calculated from the sample at Johns Hopkins as compared to that in the sample proportion from Ohio State?A)The sample proportion from Johns Hopkins will have less sampling variability than that from Ohio State.
B)The sample proportion from Johns Hopkins will have more sampling variability than that from Ohio State.
C)The sample proportion from Johns Hopkins will have about the same sampling variability as that from Ohio State.
D)It is impossible to make any statements about the sampling variability of the two samples because the students surveyed were different.
Question
Suppose you are going to roll a six-sided die 60 times and record  ,the proportion of times that an even number (2,4,or 6)is showing.At approximately what value should the sampling distribution of
  be centered?
A)1/6
B)1/3
C)1/2
D)30
,the proportion of times that an even number (2,4,or 6)is showing.At approximately what value should the sampling distribution of be centered?A)1/6
B)1/3
C)1/2
D)30
Question
Question
A study,conducted by Jackson et al.and published in the journal Cancer Causes and Control in 2009,examined 33,938 women aged 40 to 84 years old who resided in California and who reported having had a mammogram within the last 2 years.The researchers were interested in characteristics of women who routinely obtain mammograms,as suggested by the American Cancer Society,to detect breast cancer.The table below provides a column that refers to the sample size and provides characteristics of the 33,938 women who were included in the study who reported having had a mammogram.  What is the value of the parameter,p,that represents the proportion of women in California who have less than a high school education?
A)3599/33,938
B)33,938/3599
C)3599
D)None of the above
What is the value of the parameter,p,that represents the proportion of women in California who have less than a high school education?A)3599/33,938
B)33,938/3599
C)3599
D)None of the above
Question
Question
A study,conducted by Jackson et al.and published in the journal Cancer Causes and Control in 2009,examined 33,938 women aged 40 to 84 years old who resided in California and who reported having had a mammogram within the last 2 years.The researchers were interested in characteristics of women who routinely obtain mammograms,as suggested by the American Cancer Society,to detect breast cancer.The table below provides a column that refers to the sample size and provides characteristics of the 33,938 women who were included in the study who reported having had a mammogram.  The margin of error for the white respondents is likely _____ the African American respondents.
A)lower than
B)higher than
C)the same as
D)as biased as
The margin of error for the white respondents is likely _____ the African American respondents.A)lower than
B)higher than
C)the same as
D)as biased as
Question
A study,conducted by Jackson et al.and published in the journal Cancer Causes and Control in 2009,examined 33,938 women aged 40 to 84 years old who resided in California and who reported having had a mammogram within the last 2 years.The researchers were interested in characteristics of women who routinely obtain mammograms,as suggested by the American Cancer Society,to detect breast cancer.The table below provides a column that refers to the sample size and provides characteristics of the 33,938 women who were included in the study who reported having had a mammogram.  Having such a low number of the respondents being African American would create _____ variability in their responses.
A)high
B)low
C)no
D)biased
Having such a low number of the respondents being African American would create _____ variability in their responses.A)high
B)low
C)no
D)biased
Question
Question
Question
A study,conducted by Jackson et al.and published in the journal Cancer Causes and Control in 2009,examined 33,938 women aged 40 to 84 years old who resided in California and who reported having had a mammogram within the last 2 years.The researchers were interested in characteristics of women who routinely obtain mammograms,as suggested by the American Cancer Society,to detect breast cancer.The table below provides a column that refers to the sample size and provides characteristics of the 33,938 women who were included in the study who reported having had a mammogram.  Having such a large number of the respondents being white would create _____ variability in their responses.
A)high
B)low
C)no
D)biased
Having such a large number of the respondents being white would create _____ variability in their responses.A)high
B)low
C)no
D)biased
Question
A study,conducted by Jackson et al.and published in the journal Cancer Causes and Control in 2009,examined 33,938 women aged 40 to 84 years old who resided in California and who reported having had a mammogram within the last 2 years.The researchers were interested in characteristics of women who routinely obtain mammograms,as suggested by the American Cancer Society,to detect breast cancer.The table below provides a column that refers to the sample size and provides characteristics of the 33,938 women who were included in the study who reported having had a mammogram.  What proportion of the sample had a household income below $35K?
A)13,164/33,938
B)33,938/13,164
C)13,164
D)33,938
What proportion of the sample had a household income below $35K?A)13,164/33,938
B)33,938/13,164
C)13,164
D)33,938
Question
Question
A study,conducted by Jackson et al.and published in the journal Cancer Causes and Control in 2009,examined 33,938 women aged 40 to 84 years old who resided in California and who reported having had a mammogram within the last 2 years.The researchers were interested in characteristics of women who routinely obtain mammograms,as suggested by the American Cancer Society,to detect breast cancer.The table below provides a column that refers to the sample size and provides characteristics of the 33,938 women who were included in the study who reported having had a mammogram.  Are the results of the study likely biased toward one race/ethnicity group?
A)No,not as long as valid sampling process was used.
B)Yes,because most of the women in the study were white.
C)Yes,because the study included too many race/ethnicity groups.
D)None of the above
Are the results of the study likely biased toward one race/ethnicity group?A)No,not as long as valid sampling process was used.
B)Yes,because most of the women in the study were white.
C)Yes,because the study included too many race/ethnicity groups.
D)None of the above
Question
Question
Question
Which histograms display a sampling distribution that is unbiased for estimating the proportion of women at a large university,which is known to be 45%?
A)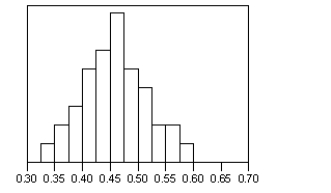
B)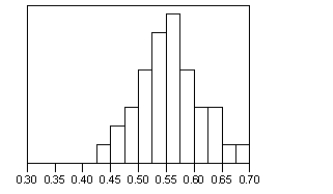
C)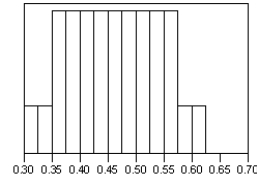
D)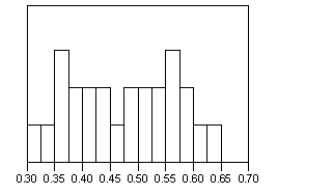
A)
B)
C)
D)
Question
Question
Question
Question
Question
Question
Question
Question
Question
Question
Question
Question
The figure below shows the Poisson distribution with a mean of 4.The Poisson distribution is an example of _________. 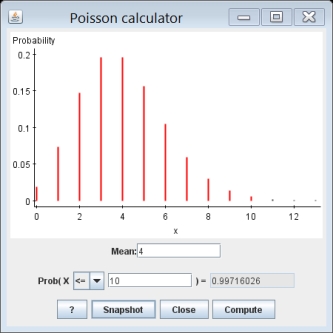
A)continuous probability distribution
B)discrete probability distribution
A)continuous probability distribution
B)discrete probability distribution
Question
Question
Question
Question
Question
Question
A population variable has a distribution with a mean of = 50 and a variance of 2 = 225.From this population a simple random sample of n observations is to be selected and the mean  of the sample values calculated.If the population variable is known to be Normally distributed and the sample size used is to be n = 16,what is the probability that the sample mean will be between 48.35 and 55.74,that is,P(48.35
  55.74)?
A)0.393
B)0.607
C)0.937
D)0.330
E)Not within ± 0.010 of any of the above
of the sample values calculated.If the population variable is known to be Normally distributed and the sample size used is to be n = 16,what is the probability that the sample mean will be between 48.35 and 55.74,that is,P(48.35 55.74)?A)0.393
B)0.607
C)0.937
D)0.330
E)Not within ± 0.010 of any of the above
Question
In the construction industry,compressive strength of concrete is a crucial characteristic.Suppose for a particular residential construction job the concrete tested after 3 days should have a mean compression strength of = 3000 psi with a standard deviation of = 50 psi.It is known that compressive strength of concrete is Normally distributed.On a construction site,a sample of n = 5 specimens is selected and tested after 3 days.If the concrete has the desired characteristics,what is the probability that the sample mean  will be larger than 3060 psi?
A)0.996
B)0.004
C)0.885
D)0.115
E)This can't be determined because the sample size n = 5 is much too small to rely on the Normal distribution for calculation of the required probability.
will be larger than 3060 psi?A)0.996
B)0.004
C)0.885
D)0.115
E)This can't be determined because the sample size n = 5 is much too small to rely on the Normal distribution for calculation of the required probability.
Question
The length of time it takes to get through the security checks at a very large urban airport is a random variable with a mean of = 20.6 minutes and a standard deviation of = 8.4 minutes.A simple random sample of 36 airline passengers is to be observed going through security.What is the variance  of the sampling distribution of the sample mean
  ?
?
A)8.4 minutes
B)20.6 minutes
C)1.4 minute
D)None of the above
E)It is close to 8.4 minutes,but we can't be certain without having the data to determine it.
of the sampling distribution of the sample mean ?A)8.4 minutes
B)20.6 minutes
C)1.4 minute
D)None of the above
E)It is close to 8.4 minutes,but we can't be certain without having the data to determine it.
Question
The following histogram shows the distribution of 1000 sample observations from a population with a mean of = 4 and a variance of 2 = 8. 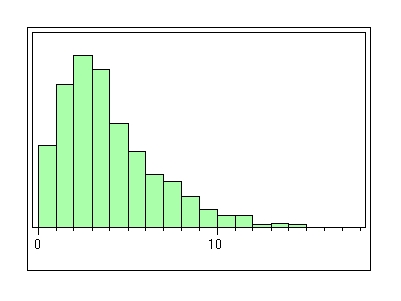 Suppose a simple random sample of 100 observations is to be selected from the population and the sample average
  is calculated.Which of the following statements about the distribution of
  is/are FALSE?
A)The distribution of will have a mean of 4.
B)The distribution will be approximately Normal.
C)Because the distribution shown in the histogram above is clearly skewed to the right,the shape of the distribution of will also show skewness to the right.
D)Even though the distribution of the population variable appears to be skewed to the right,the distribution of will be approximately symmetric around = 4.
E)The standard deviation of the distribution of will be 0.283.
Suppose a simple random sample of 100 observations is to be selected from the population and the sample average is calculated.Which of the following statements about the distribution of is/are FALSE?A)The distribution of
will have a mean of 4.B)The distribution
will be approximately Normal.C)Because the distribution shown in the histogram above is clearly skewed to the right,the shape of the distribution of
will also show skewness to the right.D)Even though the distribution of the population variable appears to be skewed to the right,the distribution of
will be approximately symmetric around = 4.E)The standard deviation of the distribution of
will be 0.283. Question
Question
Question
Chocolate bars produced by a certain machine are labeled 8.0 ounces.The distribution of the actual weights of these chocolate bars is claimed to be Normal with a mean of 8.1 ounces and a standard deviation of 0.1 ounces.The quality control manager plans to take a simple random sample of size n from the production line.How big should n be so that the sampling distribution of  has a standard deviation of 0.01 ounces?
A)10
B)100
C)1000
D)This can't be determined unless we know the population follows a Normal distribution.
has a standard deviation of 0.01 ounces?A)10
B)100
C)1000
D)This can't be determined unless we know the population follows a Normal distribution.
Question
Let X represent the SAT total score of an entering freshman at University X.The random variable X is known to have a N(1200,90)distribution.Let Y represent the SAT total score of an entering freshman at University Y.The random variable Y is known to have a N(1215,110)distribution.A random sample of 100 freshmen is obtained from each university.Let  = the sample mean of the 100 scores from University X,and
  = the sample mean of the 100 scores from University Y.What is the probability that
  will be greater than
  ?
?
A)0.0475
B)0.0869
C)0.1456
D)0.2266
= the sample mean of the 100 scores from University X,and = the sample mean of the 100 scores from University Y.What is the probability that will be greater than ?A)0.0475
B)0.0869
C)0.1456
D)0.2266
Question
Let X represent the SAT total score of an entering freshman at University X.The random variable X is known to have a N(1200,90)distribution.Let Y represent the SAT total score of an entering freshman at University Y.The random variable Y is known to have a N(1215,110)distribution.A random sample of 100 freshmen is obtained from each university.Let  = the sample mean of the 100 scores from University X,and
  = the sample mean of the 100 scores from University Y.What is the probability that
  will be less than 1190?
A)0.0116
B)0.1335
C)0.4090
D)0.4562
= the sample mean of the 100 scores from University X,and = the sample mean of the 100 scores from University Y.What is the probability that will be less than 1190?A)0.0116
B)0.1335
C)0.4090
D)0.4562
Question
A population variable has a distribution with a mean of = 50 and a variance of 2 = 225.From this population a simple random sample of n observations is to be selected and the mean  of the sample values calculated.How big must the sample size n be so that the standard deviation of the sample mean
  is equal to 1.4 (i.e. ,
  = 1.4)?
A)n = 11
B)n = 161
C)n = 115
D)n = 36
E)n = 21
of the sample values calculated.How big must the sample size n be so that the standard deviation of the sample mean is equal to 1.4 (i.e. , = 1.4)?A)n = 11
B)n = 161
C)n = 115
D)n = 36
E)n = 21
Question
Chocolate bars produced by a certain machine are labeled 8.0 ounces.The distribution of the actual weights of these chocolate bars is claimed to be Normal with a mean of 8.1 ounces and a standard deviation of 0.1 ounces.A quality control manager initially plans to take a simple random sample of size n from the production line.If he were to double his sample size (to 2n),by what factor would the standard deviation of the sampling distribution of  change?
A)1/2
B)
C)
D)2
change?A)1/2
B)
C)
D)2
Question
Let X represent the SAT total score of an entering freshman at University X.The random variable X is known to have a N(1200,90)distribution.Let Y represent the SAT total score of an entering freshman at University Y.The random variable Y is known to have a N(1215,110)distribution.A random sample of 100 freshmen is obtained from each university.Let  = the sample mean of the 100 scores from University X,and
  = the sample mean of the 100 scores from University Y.What is the distribution of the difference in sample means between University X and University Y:
  -
-  ?
?
A)N(-15,-20)
B)N(-15,14.2)
C)N(-15,142.1)
D)N(-15,200)
= the sample mean of the 100 scores from University X,and = the sample mean of the 100 scores from University Y.What is the distribution of the difference in sample means between University X and University Y: - ?A)N(-15,-20)
B)N(-15,14.2)
C)N(-15,142.1)
D)N(-15,200)
Question
The length of time it takes to get through the security checks at a very large urban airport is a random variable with a mean of  20.6 minutes and a standard deviation of 11ec949d_bc0d_7f39_be2b_43474a185cb2_TB5065_00 8.4 minutes.A simple random sample of 36 airline passengers is to be observed going through security.For the passengers in the SRS,what is the approximate probability that the mean length of time for them to get through security will be less than 18 min?
A)0.378
B)0.186
C)0.031
D)0.314
E)Not within ± 0.005 of any of the above
20.6 minutes and a standard deviation of 11ec949d_bc0d_7f39_be2b_43474a185cb2_TB5065_00 8.4 minutes.A simple random sample of 36 airline passengers is to be observed going through security.For the passengers in the SRS,what is the approximate probability that the mean length of time for them to get through security will be less than 18 min?A)0.378
B)0.186
C)0.031
D)0.314
E)Not within ± 0.005 of any of the above
Question
Suppose a simple random sample is selected from a population with a mean if and a variance of 2.The central limit theorem tells us that
A)the sample mean gets closer to the population mean as the sample size increases.
B)if the sample size n is sufficiently large,the sample will be approximately Normal.
C)the mean of will be if the sample size n is sufficiently large.
D)if the sample size is sufficiently large,the distribution of will be approximately Normal with a mean of and a standard deviation of
 .
.
E)the distribution of will be Normal only if the population from which the sample is selected is also Normal.
A)the sample mean
gets closer to the population mean as the sample size increases.B)if the sample size n is sufficiently large,the sample will be approximately Normal.
C)the mean of
will be if the sample size n is sufficiently large.D)if the sample size is sufficiently large,the distribution of
will be approximately Normal with a mean of and a standard deviation of .E)the distribution of
will be Normal only if the population from which the sample is selected is also Normal. Question
Let X represent the SAT total score of an entering freshman at University X.The random variable X is known to have a N(1200,90)distribution.Let Y represent the SAT total score of an entering freshman at University Y.The random variable Y is known to have a N(1215,110)distribution.A random sample of 100 freshmen is obtained from each university.Let  = the sample mean of the 100 scores from University X,and
  = the sample mean of the 100 scores from University Y.What is the probability that
  will be less than 1190?
A)0.0116
B)0.1335
C)0.4090
D)0.4562
= the sample mean of the 100 scores from University X,and = the sample mean of the 100 scores from University Y.What is the probability that will be less than 1190?A)0.0116
B)0.1335
C)0.4090
D)0.4562
Question
A sample of size n is selected at random from a population that has mean and standard deviation .The sample mean  will be determined from the observations in the sample.Which of the following statements about the sample mean
  is/are TRUE?
A)The mean of is the same as the population mean (i.e. ,).
B)The variance of is
is
 .
.
C)The standard deviation of decreases as the sample size grows larger.
D)All of the above are true.
E)Only A and B are true.
will be determined from the observations in the sample.Which of the following statements about the sample mean is/are TRUE?A)The mean of
is the same as the population mean (i.e. ,).B)The variance of
is .C)The standard deviation of
decreases as the sample size grows larger.D)All of the above are true.
E)Only A and B are true.
Question
The length of time it takes to get through the security checks at a very large urban airport is a random variable with a mean of = 20.6 minutes and a standard deviation of = 8.4 minutes.A simple random sample of 36 airline passengers is to be observed going through security.What is the mean  of the sampling distribution of the sample mean
  ?
?
A)8.4 minutes
B)20.6 minutes
C)1.4 minute
D)It is close to 20.6 minutes,but we can't be certain without having the data to determine it.
E)Without knowing the distribution,we don't know what it will be.
of the sampling distribution of the sample mean ?A)8.4 minutes
B)20.6 minutes
C)1.4 minute
D)It is close to 20.6 minutes,but we can't be certain without having the data to determine it.
E)Without knowing the distribution,we don't know what it will be.
Question
Question
Question
Question
Question
Question
Question
Question
Question
Question
Question
Question
Thousands of batteries are produced every day in a certain manufacturing plant.The quality control specialist is interested in how long it takes for each battery to fail when used in a moderately sized appliance,like a portable radio or CD player.The quality control specialist will take a simple random sample of 2000 batteries produced at this plant over the next four days.These batteries will be put into a variety of moderately sized appliances and the average  of all failure times will be computed.Which of the following probability distributions is most appropriate to model the average time until failure of these 2000 batteries?
A)The uniform distribution
B)The Normal distribution
C)The binomial distribution
D)The Weibull distribution
of all failure times will be computed.Which of the following probability distributions is most appropriate to model the average time until failure of these 2000 batteries?A)The uniform distribution
B)The Normal distribution
C)The binomial distribution
D)The Weibull distribution
Question
A random variable X is Normally distributed with mean  = 75 and
  = 8.Let Y be a second Normally distributed random variable with mean
  = 70 and
  = 12.It is also known that X and Y are independent of one another.Let W be a random variable that is the difference between X and Y (i.e. ,W = X - Y).What is the probability that W is greater than -5.5 (i.e. ,P{W > -5.5})?
A)0.233
B)0.512
C)0.767
D)0.488
E)Not within ± 0.005 of any of the above
= 75 and = 8.Let Y be a second Normally distributed random variable with mean = 70 and = 12.It is also known that X and Y are independent of one another.Let W be a random variable that is the difference between X and Y (i.e. ,W = X - Y).What is the probability that W is greater than -5.5 (i.e. ,P{W > -5.5})?A)0.233
B)0.512
C)0.767
D)0.488
E)Not within ± 0.005 of any of the above
Question
Question
Question
Question
Question
Question
A random variable X is Normally distributed with mean  = 75 and
  = 8.Let Y be a second Normally distributed random variable with mean
  = 70 and
  = 12.It is also known that X and Y are independent of one another.Let W be a random variable that is the difference between X and Y (i.e. ,W = X - Y).What can be said about the distribution of W?
A)W is N(0,20)
B)W is N(5,20)
C)W is N(5,-4)
D)W is N(5,14.4)
E)W is N(0,14.4)
= 75 and = 8.Let Y be a second Normally distributed random variable with mean = 70 and = 12.It is also known that X and Y are independent of one another.Let W be a random variable that is the difference between X and Y (i.e. ,W = X - Y).What can be said about the distribution of W?A)W is N(0,20)
B)W is N(5,20)
C)W is N(5,-4)
D)W is N(5,14.4)
E)W is N(0,14.4)
Question

Unlock Deck
Sign up to unlock the cards in this deck!
Unlock Deck
Unlock Deck
1/77
Play
Full screen (f)
Deck 5: Sampling Distributions
1
A study,conducted by Jackson et al.and published in the journal Cancer Causes and Control in 2009,examined 33,938 women aged 40 to 84 years old who resided in California and who reported having had a mammogram within the last 2 years.The researchers were interested in characteristics of women who routinely obtain mammograms,as suggested by the American Cancer Society,to detect breast cancer.The table below provides a column that refers to the sample size and provides characteristics of the 33,938 women who were included in the study who reported having had a mammogram. The data in the sample size column can be considered
A)statistics.
B)a parameter.
C)the population.
D)None of the above
The data in the sample size column can be consideredA)statistics.
B)a parameter.
C)the population.
D)None of the above
statistics.
2
A study,conducted by Jackson et al.and published in the journal Cancer Causes and Control in 2009,examined 33,938 women aged 40 to 84 years old who resided in California and who reported having had a mammogram within the last 2 years.The researchers were interested in characteristics of women who routinely obtain mammograms,as suggested by the American Cancer Society,to detect breast cancer.The table below provides a column that refers to the sample size and provides characteristics of the 33,938 women who were included in the study who reported having had a mammogram. The proportion of the sample that were Latina is an example of a
A)statistic.
B)parameter.
C)sample.
D)population.
The proportion of the sample that were Latina is an example of aA)statistic.
B)parameter.
C)sample.
D)population.
statistic.
3
A study,conducted by Jackson et al.and published in the journal Cancer Causes and Control in 2009,examined 33,938 women aged 40 to 84 years old who resided in California and who reported having had a mammogram within the last 2 years.The researchers were interested in characteristics of women who routinely obtain mammograms,as suggested by the American Cancer Society,to detect breast cancer.The table below provides a column that refers to the sample size and provides characteristics of the 33,938 women who were included in the study who reported having had a mammogram. What is the value of the statistic, ,that represents the proportion of women in California who have less than a high school education?
A)3599/33,938
B)33,938/3599
C)3599
D)None of the above
What is the value of the statistic, ,that represents the proportion of women in California who have less than a high school education?A)3599/33,938
B)33,938/3599
C)3599
D)None of the above
3599/33,938
4
Suppose you are going to roll a six-sided die 60 times and record ,the proportion of times that an even number (2,4,or 6)is showing.Suppose you decide to roll the die 200 times instead of 60 times.How will this affect the center and spread of the sampling distribution of ?
A)Both the center and the spread will remain the same.
B)The center will remain the same,but the spread will increase.
C)The center will remain the same,but the spread will decrease.
D)Both the center and the spread will decrease.
,the proportion of times that an even number (2,4,or 6)is showing.Suppose you decide to roll the die 200 times instead of 60 times.How will this affect the center and spread of the sampling distribution of ?A)Both the center and the spread will remain the same.
B)The center will remain the same,but the spread will increase.
C)The center will remain the same,but the spread will decrease.
D)Both the center and the spread will decrease.
Unlock Deck
Unlock for access to all 77 flashcards in this deck.
Unlock Deck
k this deck
5
Does giving an incentive really work on improving exam scores? For example,consider the following treatments to measure the use of incentives.
Treatment 1: No incentive
Treatment 2: Incentive given to all
Treatment 3: Incentive given only if a certain score is received
For this experiment,assume all subjects are seniors at a university.To reduce bias,how should you select the items to use in your study?
Treatment 1: No incentive
Treatment 2: Incentive given to all
Treatment 3: Incentive given only if a certain score is received
For this experiment,assume all subjects are seniors at a university.To reduce bias,how should you select the items to use in your study?
Unlock Deck
Unlock for access to all 77 flashcards in this deck.
Unlock Deck
k this deck
6
Suppose you want to determine if there are differences in the average prices among items at three local supermarket chains.To reduce bias,how should you select the items to use in your study?
A)Choose items which you know are commonly purchased.
B)Randomly select an appropriate number of times from a list of all possible items in the supermarket.
C)Choose only brand-name items.
A)Choose items which you know are commonly purchased.
B)Randomly select an appropriate number of times from a list of all possible items in the supermarket.
C)Choose only brand-name items.
Unlock Deck
Unlock for access to all 77 flashcards in this deck.
Unlock Deck
k this deck
7
A call-in poll conducted by USA Today concluded that Americans love Donald Trump.This conclusion was based on data collected from 7800 calls made by USA Today readers.USA Today reported that of the 7800 calls,6435 calls were supportive of Donald Trump.This results in a percentage of 82.5%.Of the 6435 supportive calls,about half came from female callers.Which value(s)can be labeled as statistics?
A)7800 and 6435
B)6435 and 82.5%
C)6435,82.5%,and 50%
D)82.5% and 50%
A)7800 and 6435
B)6435 and 82.5%
C)6435,82.5%,and 50%
D)82.5% and 50%
Unlock Deck
Unlock for access to all 77 flashcards in this deck.
Unlock Deck
k this deck
8
The number of undergraduates at Johns Hopkins University is approximately 2000,while the number at Ohio State University is approximately 40,000.A simple random sample of 50 undergraduates at Johns Hopkins University will be obtained to estimate the proportion of all Johns Hopkins students who feel that drinking is a problem among college students.A simple random sample of 50 undergraduates at Ohio State University will be obtained to estimate the proportion of all Ohio State students who feel that drinking is a problem among college students.What can we conclude about the sampling variability in the sample proportion, ,calculated from the sample at Johns Hopkins as compared to that in the sample proportion from Ohio State?
A)The sample proportion from Johns Hopkins will have less sampling variability than that from Ohio State.
B)The sample proportion from Johns Hopkins will have more sampling variability than that from Ohio State.
C)The sample proportion from Johns Hopkins will have about the same sampling variability as that from Ohio State.
D)It is impossible to make any statements about the sampling variability of the two samples because the students surveyed were different.
,calculated from the sample at Johns Hopkins as compared to that in the sample proportion from Ohio State?A)The sample proportion from Johns Hopkins will have less sampling variability than that from Ohio State.
B)The sample proportion from Johns Hopkins will have more sampling variability than that from Ohio State.
C)The sample proportion from Johns Hopkins will have about the same sampling variability as that from Ohio State.
D)It is impossible to make any statements about the sampling variability of the two samples because the students surveyed were different.
Unlock Deck
Unlock for access to all 77 flashcards in this deck.
Unlock Deck
k this deck
9
Suppose you are going to roll a six-sided die 60 times and record ,the proportion of times that an even number (2,4,or 6)is showing.At approximately what value should the sampling distribution of be centered?
A)1/6
B)1/3
C)1/2
D)30
,the proportion of times that an even number (2,4,or 6)is showing.At approximately what value should the sampling distribution of be centered?A)1/6
B)1/3
C)1/2
D)30
Unlock Deck
Unlock for access to all 77 flashcards in this deck.
Unlock Deck
k this deck
10
The number of undergraduates at Johns Hopkins University is approximately 2000,while the number at Ohio State University is approximately 40,000.Suppose,instead,that at both schools a simple random sample of about 3% of the undergraduates will be taken.What can we conclude about the sampling variability for the sample proportion from Johns Hopkins as compared to that from Ohio State?
A)The sample proportion from Johns Hopkins will have less sampling variability than that from Ohio State.
B)The sample proportion from Johns Hopkins will have more sampling variability than that from Ohio State.
C)The sample proportion from Johns Hopkins will have about the same sampling variability as that from Ohio State.
D)It is impossible to make any statements about the sampling variability of the two samples because the students surveyed were different.
Unlock Deck
Unlock for access to all 77 flashcards in this deck.
Unlock Deck
k this deck
11
A study,conducted by Jackson et al.and published in the journal Cancer Causes and Control in 2009,examined 33,938 women aged 40 to 84 years old who resided in California and who reported having had a mammogram within the last 2 years.The researchers were interested in characteristics of women who routinely obtain mammograms,as suggested by the American Cancer Society,to detect breast cancer.The table below provides a column that refers to the sample size and provides characteristics of the 33,938 women who were included in the study who reported having had a mammogram. What is the value of the parameter,p,that represents the proportion of women in California who have less than a high school education?
A)3599/33,938
B)33,938/3599
C)3599
D)None of the above
What is the value of the parameter,p,that represents the proportion of women in California who have less than a high school education?A)3599/33,938
B)33,938/3599
C)3599
D)None of the above
Unlock Deck
Unlock for access to all 77 flashcards in this deck.
Unlock Deck
k this deck
12
A public opinion poll in Ohio wants to determine whether registered voters in the state approve of a measure to ban smoking in all public areas.They select a simple random sample of 50 registered voters from each county in the state and ask whether they approve or disapprove of the measure.The proportion of registered voters in the state who approve of banning smoking in public areas is an example of _________.
A)a sample proportion
B)a statistic
C)a parameter
D)an unbiased statistic
A)a sample proportion
B)a statistic
C)a parameter
D)an unbiased statistic
Unlock Deck
Unlock for access to all 77 flashcards in this deck.
Unlock Deck
k this deck
13
A study,conducted by Jackson et al.and published in the journal Cancer Causes and Control in 2009,examined 33,938 women aged 40 to 84 years old who resided in California and who reported having had a mammogram within the last 2 years.The researchers were interested in characteristics of women who routinely obtain mammograms,as suggested by the American Cancer Society,to detect breast cancer.The table below provides a column that refers to the sample size and provides characteristics of the 33,938 women who were included in the study who reported having had a mammogram. The margin of error for the white respondents is likely _____ the African American respondents.
A)lower than
B)higher than
C)the same as
D)as biased as
The margin of error for the white respondents is likely _____ the African American respondents.A)lower than
B)higher than
C)the same as
D)as biased as
Unlock Deck
Unlock for access to all 77 flashcards in this deck.
Unlock Deck
k this deck
14
A study,conducted by Jackson et al.and published in the journal Cancer Causes and Control in 2009,examined 33,938 women aged 40 to 84 years old who resided in California and who reported having had a mammogram within the last 2 years.The researchers were interested in characteristics of women who routinely obtain mammograms,as suggested by the American Cancer Society,to detect breast cancer.The table below provides a column that refers to the sample size and provides characteristics of the 33,938 women who were included in the study who reported having had a mammogram. Having such a low number of the respondents being African American would create _____ variability in their responses.
A)high
B)low
C)no
D)biased
Having such a low number of the respondents being African American would create _____ variability in their responses.A)high
B)low
C)no
D)biased
Unlock Deck
Unlock for access to all 77 flashcards in this deck.
Unlock Deck
k this deck
15
A free cholesterol screening program is set up in the downtown area during lunch hour.Individuals can walk in and have their cholesterol measured for free.One hundred seventy-three people use the service,and their average cholesterol is 217 mg/dL.The value 217 is an example of _________.
A)a sample proportion
B)a statistic
C)a parameter
D)an unbiased parameter
A)a sample proportion
B)a statistic
C)a parameter
D)an unbiased parameter
Unlock Deck
Unlock for access to all 77 flashcards in this deck.
Unlock Deck
k this deck
16
On a chilly spring afternoon,10 lab sections of a statistics class all have full attendance.The 10 lab sections each have the same number of students enrolled in it.A class evaluation is about to be administered to some of the students.It has been decided to first randomly select 3 of the 10 lab sections and then give the evaluation to a simple random sample of one-fourth of the students in those sections.Among the students answering the survey,77% said they enjoy the statistics class.Which statement(s)correctly describe the value 77%?
A)A sample proportion
B)A statistic
C)A parameter
D)A stratum
A)A sample proportion
B)A statistic
C)A parameter
D)A stratum
Unlock Deck
Unlock for access to all 77 flashcards in this deck.
Unlock Deck
k this deck
17
A study,conducted by Jackson et al.and published in the journal Cancer Causes and Control in 2009,examined 33,938 women aged 40 to 84 years old who resided in California and who reported having had a mammogram within the last 2 years.The researchers were interested in characteristics of women who routinely obtain mammograms,as suggested by the American Cancer Society,to detect breast cancer.The table below provides a column that refers to the sample size and provides characteristics of the 33,938 women who were included in the study who reported having had a mammogram. Having such a large number of the respondents being white would create _____ variability in their responses.
A)high
B)low
C)no
D)biased
Having such a large number of the respondents being white would create _____ variability in their responses.A)high
B)low
C)no
D)biased
Unlock Deck
Unlock for access to all 77 flashcards in this deck.
Unlock Deck
k this deck
18
A study,conducted by Jackson et al.and published in the journal Cancer Causes and Control in 2009,examined 33,938 women aged 40 to 84 years old who resided in California and who reported having had a mammogram within the last 2 years.The researchers were interested in characteristics of women who routinely obtain mammograms,as suggested by the American Cancer Society,to detect breast cancer.The table below provides a column that refers to the sample size and provides characteristics of the 33,938 women who were included in the study who reported having had a mammogram. What proportion of the sample had a household income below $35K?
A)13,164/33,938
B)33,938/13,164
C)13,164
D)33,938
What proportion of the sample had a household income below $35K?A)13,164/33,938
B)33,938/13,164
C)13,164
D)33,938
Unlock Deck
Unlock for access to all 77 flashcards in this deck.
Unlock Deck
k this deck
19
The number of undergraduates at Johns Hopkins University is approximately 2000,while the number at Ohio State University is approximately 40,000.Suppose the actual proportion of undergraduates at Johns Hopkins University who feel drinking is a problem among college students is 67%.A simple random sample of 50 undergraduates at Johns Hopkins University found that 60% of those sampled felt that drinking was a problem among college students.Which value(s)can be labeled as a parameter(s)?
A)60%
B)67%
C)60% and 67%
D)50
A)60%
B)67%
C)60% and 67%
D)50
Unlock Deck
Unlock for access to all 77 flashcards in this deck.
Unlock Deck
k this deck
20
A study,conducted by Jackson et al.and published in the journal Cancer Causes and Control in 2009,examined 33,938 women aged 40 to 84 years old who resided in California and who reported having had a mammogram within the last 2 years.The researchers were interested in characteristics of women who routinely obtain mammograms,as suggested by the American Cancer Society,to detect breast cancer.The table below provides a column that refers to the sample size and provides characteristics of the 33,938 women who were included in the study who reported having had a mammogram. Are the results of the study likely biased toward one race/ethnicity group?
A)No,not as long as valid sampling process was used.
B)Yes,because most of the women in the study were white.
C)Yes,because the study included too many race/ethnicity groups.
D)None of the above
Are the results of the study likely biased toward one race/ethnicity group?A)No,not as long as valid sampling process was used.
B)Yes,because most of the women in the study were white.
C)Yes,because the study included too many race/ethnicity groups.
D)None of the above
Unlock Deck
Unlock for access to all 77 flashcards in this deck.
Unlock Deck
k this deck
21
The scores of individual students on the American College Testing (ACT),a college readiness assessment,have a Normal distribution with a mean of 18.6 and a standard deviation of 6.0.At Northside High,36 seniors take the test.Assume the scores at this school have the same distribution as national scores.What is the sampling distribution of the sample mean score for a random sample of 36 students?
A)Approximately Normal,but the approximation is poor
B)Approximately Normal,and the approximation is good
C)Exactly Normal
D)Neither Normal nor non-Normal-it depends on the particular 36 students selected
A)Approximately Normal,but the approximation is poor
B)Approximately Normal,and the approximation is good
C)Exactly Normal
D)Neither Normal nor non-Normal-it depends on the particular 36 students selected
Unlock Deck
Unlock for access to all 77 flashcards in this deck.
Unlock Deck
k this deck
22
The proportion of supermarket customers who do not buy store-brand products is to be estimated.Which of the following scenarios would lead to a sampling distribution of the sample proportion with the lowest variability?
A)Sample 100 customers from the roughly 2000 customers who shop at one store location.
B)Sample 100 customers from the roughly 20,000 customers who shop at the stores citywide.
C)Sample 200 customers from the roughly 2000 customers who shop at one store location.
D)Sample 300 customers from the roughly 20,000 customers who shop at the stores citywide.
Unlock Deck
Unlock for access to all 77 flashcards in this deck.
Unlock Deck
k this deck
23
Which histograms display a sampling distribution that is unbiased for estimating the proportion of women at a large university,which is known to be 45%?
A)
B)
C)
D)
A)
B)
C)
D)
Unlock Deck
Unlock for access to all 77 flashcards in this deck.
Unlock Deck
k this deck
24
For the following scenario,determine if the numbers in boldface type are statistics or parameters. A company manufactures cardboard containers for packaging frozen fruit juices.The manufacturing process forms the containers by joining cardboard stock to a metal bottom.The container can be inspected to determine if there might be leaks along the cardboard seam or where the metal bottom is attached.It is known from long experience that 18% of cans produced by this process are defective.A random sample of 50 cans was selected from the production process on Monday,and it was found that 12% of the selected cans were defective.Because this seemed to indicate an improvement,another sample was selected of the same size on Tuesday,and in it 21% of the cans were defective.The numbers 12%,18%,and 21% are,respectively,a
A)statistic,statistic,and parameter.
B)statistic,statistic,and statistic.
C)parameter,statistic,and parameter.
D)parameter,parameter,and statistic.
E)statistic,parameter,and statistic.
A)statistic,statistic,and parameter.
B)statistic,statistic,and statistic.
C)parameter,statistic,and parameter.
D)parameter,parameter,and statistic.
E)statistic,parameter,and statistic.
Unlock Deck
Unlock for access to all 77 flashcards in this deck.
Unlock Deck
k this deck
25
The proportion of supermarket customers who do not buy store-brand products is to be estimated.Suppose 500 customers are selected from the roughly 20,000 customers who shop at the stores citywide.The sample proportion of supermarket customers who do not buy store-brand products equals 33.5%.Which value(s)can be labeled as statistic(s)?
A)20,000
B)500 and 20,000
C)33.5%
D)20,000 and 33.5%
A)20,000
B)500 and 20,000
C)33.5%
D)20,000 and 33.5%
Unlock Deck
Unlock for access to all 77 flashcards in this deck.
Unlock Deck
k this deck
26
The scores of individual students on the American College Testing (ACT),college readiness assessment,have a Normal distribution with a mean of 18.6 and a standard deviation of 6.0.At Northside High,36 seniors take the test.Assume the scores at this school have the same distribution as national scores.What is the mean of the sampling distribution of the sample mean score for a random sample of 36 students?
A)1.0
B)3.1
C)6.0
D)18.6
A)1.0
B)3.1
C)6.0
D)18.6
Unlock Deck
Unlock for access to all 77 flashcards in this deck.
Unlock Deck
k this deck
27
Hoping to attract more shoppers,a city is planning to build a new public parking garage downtown.The city plans to pay for the structure through parking fees.The consultant,who is advising the city on this project,has selected a simple random sample of 44 weekdays and calculated the average amount in fees collected from neighboring parking structures.The sample mean was $967.Which of the following scenarios would lead to the smallest margin of error?
A)Sample fewer days,so that the sample mean may be lower than $967 and the margin of error will be smaller as well.
B)Sample fewer days-a smaller sample size will automatically lead to a smaller margin of error.
C)Sample more days-with more days we have more data and our estimate is expected to be more accurate,leading to a smaller margin of error.
D)Stay with a sample size of 44 days-this sample size was used for a reason,which was most likely to reduce the margin of error.
Unlock Deck
Unlock for access to all 77 flashcards in this deck.
Unlock Deck
k this deck
28
Which of the following statements best describes a sampling distribution?
A)It is the distribution of the values of a particular variable that are observed in a random sample.
B)It is the distribution of the values of a variable in the population from which the sample is taken.
C)It is the distribution of the values of a statistic calculated from 1000 simple random samples displayed in a histogram.
D)It is the distribution of the values of a statistic that resembles the Normal distribution when the sample size is large.
E)It is the distribution of the values taken by a statistic in all possible samples of the same size from the same population.
Unlock Deck
Unlock for access to all 77 flashcards in this deck.
Unlock Deck
k this deck
29
Every year around Christmas time,many parents take their children to a mall to have their child's picture taken with Santa.The Centennial Mall management has calculated,based on years of experience,that about 40% of all children cry when they sit on Santa's lap.Suppose 80 children were randomly selected from this year's crowd.Of these 80 children,45% cried.If repeated samples of 80 children were to be selected,what is the center of the sampling distribution of the percentage of sampled children who cry when seated on Santa's lap?
A)40%
B)45%
C)80
D)Somewhere between 40% and 45%
A)40%
B)45%
C)80
D)Somewhere between 40% and 45%
Unlock Deck
Unlock for access to all 77 flashcards in this deck.
Unlock Deck
k this deck
30
A simple random sample of 50 students is taken from a local community college,which has a total of about 1500 students.Another simple random sample of 50 students is taken from a large state university,which has a total of approximately 20,000 students.The sampled students each answer a one-question survey which reads,"About how many MP3 songs do you own?" The sample average number of MP3 songs owned is calculated for the two sets of students.What can we conclude about the sampling variability in the sample average number of MP3 songs of the students sampled from the small community college as compared to that in the sample average of the students sampled from the large state university?
A)The sample mean from the small community college has less sampling variability than that from the large state university because there are fewer students at the small community college.
B)The sample mean from the small community college has more sampling variability than that from the large state university because there are more students at the large state university.
C)The sample mean from the small community college has about the same sampling variability as that from the large state university because the sample sizes are equal.
D)It is impossible to make any statements about the sampling variability of the two sample means because the students surveyed came from different schools.
Unlock Deck
Unlock for access to all 77 flashcards in this deck.
Unlock Deck
k this deck
31
The scores of individual students on the American College Testing (ACT),college readiness assessment,have a Normal distribution with a mean of 18.6 and a standard deviation of 6.0.At Northside High,36 seniors take the test.Assume the scores at this school have the same distribution as national scores.What is the standard deviation of the sampling distribution of the sample mean score for a random sample of 36 students?
A)1.0
B)3.1
C)6.0
D)18.6
A)1.0
B)3.1
C)6.0
D)18.6
Unlock Deck
Unlock for access to all 77 flashcards in this deck.
Unlock Deck
k this deck
32
The number of undergraduates at Johns Hopkins University is approximately 2000,while the number at Ohio State University is approximately 40,000.Suppose the actual proportion of undergraduates at Johns Hopkins University who feel drinking is a problem among college students is 67%.What is the mean of the sampling distribution of the percentage of students who feel drinking is a problem in repeated simple random samples of 50 Johns Hopkins undergraduates?
A)60%
B)65%
C)67%
D)70%
A)60%
B)65%
C)67%
D)70%
Unlock Deck
Unlock for access to all 77 flashcards in this deck.
Unlock Deck
k this deck
33
Consider a Poisson distribution with a mean of 4.What is the probability that X < 3?
A).238
B)0
C).433
D)None of the above
A).238
B)0
C).433
D)None of the above
Unlock Deck
Unlock for access to all 77 flashcards in this deck.
Unlock Deck
k this deck
34
A population of graduate students at a large university was being studied through the use of a sample survey.The researcher was trying to estimate the mean debt carried by the students through student loans and the proportion of all students that carry a student loan.A stratified random sample of 350 students was selected from the various schools within the university.The sample results showed that 30% held a student loan and the mean debt was $18,450.Which of the following statements is TRUE?
A)The result,30%,is a statistic and the mean debt,$18,450,is the value of the parameter.
B)The mean debt held by all students is a parameter,and the 30% who hold student loans is the value of a parameter.
C)The mean debt of all students,the proportion holding a loan,and the values 30% and $18,450 are all examples of parameters.
D)The mean debt of all students and the proportion holding student loans are both parameters,but the values 30% and $18,450 are statistics.
E)The mean debt of all students is a parameter,and its value is $18,450.The proportion holding a student loan is also a parameter whose value is 30%.
Unlock Deck
Unlock for access to all 77 flashcards in this deck.
Unlock Deck
k this deck
35
The figure below shows the Poisson distribution with a mean of 4.The Poisson distribution is an example of _________.
A)continuous probability distribution
B)discrete probability distribution
A)continuous probability distribution
B)discrete probability distribution
Unlock Deck
Unlock for access to all 77 flashcards in this deck.
Unlock Deck
k this deck
36
Should you have a cup of coffee to make you more alert when studying for a big test? A study on the effect of caffeine involved asking volunteers to take a memory test 20 minutes after drinking cola.Some volunteers were randomly assigned to drink caffeine-free cola,some were assigned regular cola (with caffeine),and others were assigned a mixture of the two (getting a half dose of caffeine).For each volunteer,a test score (the number of items recalled correctly)was recorded.The volunteers were not told which type of cola they had been given,but the researchers for the study prepared the cups of cola right on the spot (out of sight of the volunteers).The memory test had a total of 25 items on it.The average number of items recalled was 15 for the caffeine-free group,17 for the mixture group,and 16 for the regular cola group.Are the values 15,16,and 17 statistics or parameters?
Unlock Deck
Unlock for access to all 77 flashcards in this deck.
Unlock Deck
k this deck
37
A news program is doing a report on a controversial court case.Daniel VanHowen is being prosecuted for killing a woman in the park,but all the evidence is circumstantial.Right before sentencing,the TV program decides to poll the TV-viewing audience.They wish to estimate the proportion of all people who think Mr.VanHowen is guilty.They decide to post a question on their Web site and ask the TV-viewing audience to answer it.The TV program decides to announce during the program that these opinions only reflect the TV-viewing,computer-using audience.They close the poll after 10 minutes.They had 2371 responses,of which 1542 think that Mr.VanHowen is guilty.What could the news programs have done to reduce the margin of error of the sample percentage of viewers who think that Mr.VanHowen is guilty?
Unlock Deck
Unlock for access to all 77 flashcards in this deck.
Unlock Deck
k this deck
38
A sample is to be selected from a large population using simple random sampling.The proportion of subjects in the sample that have a given characteristic is to be calculated.Which of the following best describes the sample proportion?
A)It is a parameter.
B)It is a statistic,which is unbiased for the population parameter only if the population is at least 100 times larger than the sample.
C)It is a statistic that is unbiased,and its variability does not depend on the population size provided the population is at least 100 times larger than the sample.
D)It is a lurking variable whose value is unknown.
E)It is a statistic,but its behavior cannot be determined because only one sample is to be taken.
Unlock Deck
Unlock for access to all 77 flashcards in this deck.
Unlock Deck
k this deck
39
Binomial distributions represent _______ random variables.
A)discrete
B)continuous
C)None of the above
A)discrete
B)continuous
C)None of the above
Unlock Deck
Unlock for access to all 77 flashcards in this deck.
Unlock Deck
k this deck
40
A researcher is planning to carry out a sample survey in order to estimate the proportion of people in a very large population of interest who have shopped online in the previous 6 months.A simple random sample is to be selected but there is debate about whether to select an SRS of size 500 or of size 1000.With respect to the sample proportion,which statement best describes what can be expected to happen using these two different sample sizes?
A)The statistic will be more biased in the sample of size 500,but the variability of the statistic will be smaller.
B)Using the larger sample size will reduce the bias of the statistic,but the spread of the sampling distribution will be greater.
C)The statistic from either sample size will be unbiased,but the sampling distribution of the statistic from the sample of size 1000 will show greater variability.
D)The statistic from either sample size will be unbiased,but the sampling distribution of the statistic from the sample of size 1000 will show less variability.
E)The sample size has no effect on the sampling distribution of the statistic because the population size is very large.
Unlock Deck
Unlock for access to all 77 flashcards in this deck.
Unlock Deck
k this deck
41
A population variable has a distribution with a mean of = 50 and a variance of 2 = 225.From this population a simple random sample of n observations is to be selected and the mean of the sample values calculated.If the population variable is known to be Normally distributed and the sample size used is to be n = 16,what is the probability that the sample mean will be between 48.35 and 55.74,that is,P(48.35 55.74)?
A)0.393
B)0.607
C)0.937
D)0.330
E)Not within ± 0.010 of any of the above
of the sample values calculated.If the population variable is known to be Normally distributed and the sample size used is to be n = 16,what is the probability that the sample mean will be between 48.35 and 55.74,that is,P(48.35 55.74)?A)0.393
B)0.607
C)0.937
D)0.330
E)Not within ± 0.010 of any of the above
Unlock Deck
Unlock for access to all 77 flashcards in this deck.
Unlock Deck
k this deck
42
In the construction industry,compressive strength of concrete is a crucial characteristic.Suppose for a particular residential construction job the concrete tested after 3 days should have a mean compression strength of = 3000 psi with a standard deviation of = 50 psi.It is known that compressive strength of concrete is Normally distributed.On a construction site,a sample of n = 5 specimens is selected and tested after 3 days.If the concrete has the desired characteristics,what is the probability that the sample mean will be larger than 3060 psi?
A)0.996
B)0.004
C)0.885
D)0.115
E)This can't be determined because the sample size n = 5 is much too small to rely on the Normal distribution for calculation of the required probability.
will be larger than 3060 psi?A)0.996
B)0.004
C)0.885
D)0.115
E)This can't be determined because the sample size n = 5 is much too small to rely on the Normal distribution for calculation of the required probability.
Unlock Deck
Unlock for access to all 77 flashcards in this deck.
Unlock Deck
k this deck
43
The length of time it takes to get through the security checks at a very large urban airport is a random variable with a mean of = 20.6 minutes and a standard deviation of = 8.4 minutes.A simple random sample of 36 airline passengers is to be observed going through security.What is the variance of the sampling distribution of the sample mean ?
A)8.4 minutes
B)20.6 minutes
C)1.4 minute
D)None of the above
E)It is close to 8.4 minutes,but we can't be certain without having the data to determine it.
of the sampling distribution of the sample mean ?A)8.4 minutes
B)20.6 minutes
C)1.4 minute
D)None of the above
E)It is close to 8.4 minutes,but we can't be certain without having the data to determine it.
Unlock Deck
Unlock for access to all 77 flashcards in this deck.
Unlock Deck
k this deck
44
The following histogram shows the distribution of 1000 sample observations from a population with a mean of = 4 and a variance of 2 = 8. Suppose a simple random sample of 100 observations is to be selected from the population and the sample average is calculated.Which of the following statements about the distribution of is/are FALSE?
A)The distribution of will have a mean of 4.
B)The distribution will be approximately Normal.
C)Because the distribution shown in the histogram above is clearly skewed to the right,the shape of the distribution of will also show skewness to the right.
D)Even though the distribution of the population variable appears to be skewed to the right,the distribution of will be approximately symmetric around = 4.
E)The standard deviation of the distribution of will be 0.283.
Suppose a simple random sample of 100 observations is to be selected from the population and the sample average is calculated.Which of the following statements about the distribution of is/are FALSE?A)The distribution of
will have a mean of 4.B)The distribution
will be approximately Normal.C)Because the distribution shown in the histogram above is clearly skewed to the right,the shape of the distribution of
will also show skewness to the right.D)Even though the distribution of the population variable appears to be skewed to the right,the distribution of
will be approximately symmetric around = 4.E)The standard deviation of the distribution of
will be 0.283. Unlock Deck
Unlock for access to all 77 flashcards in this deck.
Unlock Deck
k this deck
45
Chocolate bars produced by a certain machine are labeled 8.0 ounces.The distribution of the actual weights of these chocolate bars is claimed to be Normal with a mean of 8.1 ounces and a standard deviation of 0.1 ounces.If the quality control manager takes a simple random sample of 10 chocolate bars from the production line,what is the probability that the sample mean weight of the 10 sampled chocolate bars will be less than 8.0 ounces?
A)0
B)0.00078
C)0.0316
D)0.1587
A)0
B)0.00078
C)0.0316
D)0.1587
Unlock Deck
Unlock for access to all 77 flashcards in this deck.
Unlock Deck
k this deck
46
The weights of medium oranges packaged by an orchard are Normally distributed with a mean of 14 ounces and a standard deviation of 2 ounces.Ten medium oranges will be randomly selected from a package.What is the sampling distribution of the sample mean weight of a random sample of 10 medium oranges?
A)N(14,2)
B)N(14,0.63)
C)N(14,0.2)
D)N(1.4,0.2)
A)N(14,2)
B)N(14,0.63)
C)N(14,0.2)
D)N(1.4,0.2)
Unlock Deck
Unlock for access to all 77 flashcards in this deck.
Unlock Deck
k this deck
47
Chocolate bars produced by a certain machine are labeled 8.0 ounces.The distribution of the actual weights of these chocolate bars is claimed to be Normal with a mean of 8.1 ounces and a standard deviation of 0.1 ounces.The quality control manager plans to take a simple random sample of size n from the production line.How big should n be so that the sampling distribution of has a standard deviation of 0.01 ounces?
A)10
B)100
C)1000
D)This can't be determined unless we know the population follows a Normal distribution.
has a standard deviation of 0.01 ounces?A)10
B)100
C)1000
D)This can't be determined unless we know the population follows a Normal distribution.
Unlock Deck
Unlock for access to all 77 flashcards in this deck.
Unlock Deck
k this deck
48
Let X represent the SAT total score of an entering freshman at University X.The random variable X is known to have a N(1200,90)distribution.Let Y represent the SAT total score of an entering freshman at University Y.The random variable Y is known to have a N(1215,110)distribution.A random sample of 100 freshmen is obtained from each university.Let = the sample mean of the 100 scores from University X,and = the sample mean of the 100 scores from University Y.What is the probability that will be greater than ?
A)0.0475
B)0.0869
C)0.1456
D)0.2266
= the sample mean of the 100 scores from University X,and = the sample mean of the 100 scores from University Y.What is the probability that will be greater than ?A)0.0475
B)0.0869
C)0.1456
D)0.2266
Unlock Deck
Unlock for access to all 77 flashcards in this deck.
Unlock Deck
k this deck
49
Let X represent the SAT total score of an entering freshman at University X.The random variable X is known to have a N(1200,90)distribution.Let Y represent the SAT total score of an entering freshman at University Y.The random variable Y is known to have a N(1215,110)distribution.A random sample of 100 freshmen is obtained from each university.Let = the sample mean of the 100 scores from University X,and = the sample mean of the 100 scores from University Y.What is the probability that will be less than 1190?
A)0.0116
B)0.1335
C)0.4090
D)0.4562
= the sample mean of the 100 scores from University X,and = the sample mean of the 100 scores from University Y.What is the probability that will be less than 1190?A)0.0116
B)0.1335
C)0.4090
D)0.4562
Unlock Deck
Unlock for access to all 77 flashcards in this deck.
Unlock Deck
k this deck
50
A population variable has a distribution with a mean of = 50 and a variance of 2 = 225.From this population a simple random sample of n observations is to be selected and the mean of the sample values calculated.How big must the sample size n be so that the standard deviation of the sample mean is equal to 1.4 (i.e. , = 1.4)?
A)n = 11
B)n = 161
C)n = 115
D)n = 36
E)n = 21
of the sample values calculated.How big must the sample size n be so that the standard deviation of the sample mean is equal to 1.4 (i.e. , = 1.4)?A)n = 11
B)n = 161
C)n = 115
D)n = 36
E)n = 21
Unlock Deck
Unlock for access to all 77 flashcards in this deck.
Unlock Deck
k this deck
51
Chocolate bars produced by a certain machine are labeled 8.0 ounces.The distribution of the actual weights of these chocolate bars is claimed to be Normal with a mean of 8.1 ounces and a standard deviation of 0.1 ounces.A quality control manager initially plans to take a simple random sample of size n from the production line.If he were to double his sample size (to 2n),by what factor would the standard deviation of the sampling distribution of change?
A)1/2
B)
C)
D)2
change?A)1/2
B)
C)
D)2
Unlock Deck
Unlock for access to all 77 flashcards in this deck.
Unlock Deck
k this deck
52
Let X represent the SAT total score of an entering freshman at University X.The random variable X is known to have a N(1200,90)distribution.Let Y represent the SAT total score of an entering freshman at University Y.The random variable Y is known to have a N(1215,110)distribution.A random sample of 100 freshmen is obtained from each university.Let = the sample mean of the 100 scores from University X,and = the sample mean of the 100 scores from University Y.What is the distribution of the difference in sample means between University X and University Y: - ?
A)N(-15,-20)
B)N(-15,14.2)
C)N(-15,142.1)
D)N(-15,200)
= the sample mean of the 100 scores from University X,and = the sample mean of the 100 scores from University Y.What is the distribution of the difference in sample means between University X and University Y: - ?A)N(-15,-20)
B)N(-15,14.2)
C)N(-15,142.1)
D)N(-15,200)
Unlock Deck
Unlock for access to all 77 flashcards in this deck.
Unlock Deck
k this deck
53
The length of time it takes to get through the security checks at a very large urban airport is a random variable with a mean of 20.6 minutes and a standard deviation of 11ec949d_bc0d_7f39_be2b_43474a185cb2_TB5065_00 8.4 minutes.A simple random sample of 36 airline passengers is to be observed going through security.For the passengers in the SRS,what is the approximate probability that the mean length of time for them to get through security will be less than 18 min?
A)0.378
B)0.186
C)0.031
D)0.314
E)Not within ± 0.005 of any of the above
20.6 minutes and a standard deviation of 11ec949d_bc0d_7f39_be2b_43474a185cb2_TB5065_00 8.4 minutes.A simple random sample of 36 airline passengers is to be observed going through security.For the passengers in the SRS,what is the approximate probability that the mean length of time for them to get through security will be less than 18 min?A)0.378
B)0.186
C)0.031
D)0.314
E)Not within ± 0.005 of any of the above
Unlock Deck
Unlock for access to all 77 flashcards in this deck.
Unlock Deck
k this deck
54
Suppose a simple random sample is selected from a population with a mean if and a variance of 2.The central limit theorem tells us that
A)the sample mean gets closer to the population mean as the sample size increases.
B)if the sample size n is sufficiently large,the sample will be approximately Normal.
C)the mean of will be if the sample size n is sufficiently large.
D)if the sample size is sufficiently large,the distribution of will be approximately Normal with a mean of and a standard deviation of
.
E)the distribution of will be Normal only if the population from which the sample is selected is also Normal.
A)the sample mean
gets closer to the population mean as the sample size increases.B)if the sample size n is sufficiently large,the sample will be approximately Normal.
C)the mean of
will be if the sample size n is sufficiently large.D)if the sample size is sufficiently large,the distribution of
will be approximately Normal with a mean of and a standard deviation of .E)the distribution of
will be Normal only if the population from which the sample is selected is also Normal. Unlock Deck
Unlock for access to all 77 flashcards in this deck.
Unlock Deck
k this deck
55
Let X represent the SAT total score of an entering freshman at University X.The random variable X is known to have a N(1200,90)distribution.Let Y represent the SAT total score of an entering freshman at University Y.The random variable Y is known to have a N(1215,110)distribution.A random sample of 100 freshmen is obtained from each university.Let = the sample mean of the 100 scores from University X,and = the sample mean of the 100 scores from University Y.What is the probability that will be less than 1190?
A)0.0116
B)0.1335
C)0.4090
D)0.4562
= the sample mean of the 100 scores from University X,and = the sample mean of the 100 scores from University Y.What is the probability that will be less than 1190?A)0.0116
B)0.1335
C)0.4090
D)0.4562
Unlock Deck
Unlock for access to all 77 flashcards in this deck.
Unlock Deck
k this deck
56
A sample of size n is selected at random from a population that has mean and standard deviation .The sample mean will be determined from the observations in the sample.Which of the following statements about the sample mean is/are TRUE?
A)The mean of is the same as the population mean (i.e. ,).
B)The variance of is
.
C)The standard deviation of decreases as the sample size grows larger.
D)All of the above are true.
E)Only A and B are true.
will be determined from the observations in the sample.Which of the following statements about the sample mean is/are TRUE?A)The mean of
is the same as the population mean (i.e. ,).B)The variance of
is .C)The standard deviation of
decreases as the sample size grows larger.D)All of the above are true.
E)Only A and B are true.
Unlock Deck
Unlock for access to all 77 flashcards in this deck.
Unlock Deck
k this deck
57
The length of time it takes to get through the security checks at a very large urban airport is a random variable with a mean of = 20.6 minutes and a standard deviation of = 8.4 minutes.A simple random sample of 36 airline passengers is to be observed going through security.What is the mean of the sampling distribution of the sample mean ?
A)8.4 minutes
B)20.6 minutes
C)1.4 minute
D)It is close to 20.6 minutes,but we can't be certain without having the data to determine it.
E)Without knowing the distribution,we don't know what it will be.
of the sampling distribution of the sample mean ?A)8.4 minutes
B)20.6 minutes
C)1.4 minute
D)It is close to 20.6 minutes,but we can't be certain without having the data to determine it.
E)Without knowing the distribution,we don't know what it will be.
Unlock Deck
Unlock for access to all 77 flashcards in this deck.
Unlock Deck
k this deck
58
The weights of extra-large eggs have a Normal distribution with a mean of 1 ounces and a standard deviation of 0.1 ounces.What is the probability that a carton of a dozen eggs weighs more than 13 ounces?
A)0.0000
B)0.0019
C)0.1814
D)0.2033
A)0.0000
B)0.0019
C)0.1814
D)0.2033
Unlock Deck
Unlock for access to all 77 flashcards in this deck.
Unlock Deck
k this deck
59
The weights of extra-large eggs have a Normal distribution with a mean of 1 ounces and a standard deviation of 0.1 ounces.What is the sampling distribution of the sample mean weight of the eggs in a randomly selected carton of a dozen eggs?
A)N(1,0.029)
B)N(1,0.1)
C)N(12,0.1)
D)N(12,1)
A)N(1,0.029)
B)N(1,0.1)
C)N(12,0.1)
D)N(12,1)
Unlock Deck
Unlock for access to all 77 flashcards in this deck.
Unlock Deck
k this deck
60
The weights of medium oranges packaged by an orchard are Normally distributed with a mean of 14 ounces and a standard deviation of 2 ounces.Ten medium oranges will be randomly selected from a package.What is the sampling distribution of the number of oranges in the sample that weigh more than 14 ounces?
A)N(14,2)
B)N(14,0.63)
C)B(14,0.2)
D)B(10,0.5)
A)N(14,2)
B)N(14,0.63)
C)B(14,0.2)
D)B(10,0.5)
Unlock Deck
Unlock for access to all 77 flashcards in this deck.
Unlock Deck
k this deck
61
Thousands of batteries are produced every day in a certain manufacturing plant.The quality control specialist is interested in how long it takes for each battery to fail when used in a moderately sized appliance,like a portable radio or CD player.Which of the following probability distributions is most appropriate to model the time until failure of these batteries?
A)The uniform distribution
B)The Normal distribution
C)The binomial distribution
D)The Weibull distribution
A)The uniform distribution
B)The Normal distribution
C)The binomial distribution
D)The Weibull distribution
Unlock Deck
Unlock for access to all 77 flashcards in this deck.
Unlock Deck
k this deck
62
The distribution of the amount of money undergraduate students spend on books for a term is slightly right-skewed,with a mean of $400 and a standard deviation of $80.If a student is selected at random,what is the probability that this student spends more than $425 on books?
A)0.1125
B)0.3773
C)0.6227
D)This can't be determined from the information given.
A)0.1125
B)0.3773
C)0.6227
D)This can't be determined from the information given.
Unlock Deck
Unlock for access to all 77 flashcards in this deck.
Unlock Deck
k this deck
63
During the summer months,the prices of nonsmoking rooms with a king-sized bed in hotels in a certain area are roughly Normally distributed with a mean of $131.80 and a standard deviation of $29.12.What percentage of nonsmoking rooms with a king-sized bed cost more than $150?
A)0.77%
B)11.25%
C)26.60%
D)36.78%
A)0.77%
B)11.25%
C)26.60%
D)36.78%
Unlock Deck
Unlock for access to all 77 flashcards in this deck.
Unlock Deck
k this deck
64
A gasoline tank for a certain car is designed to hold 15 gallons of gas.Suppose that the actual capacity of a randomly selected tank has a distribution that is approximately Normal with a mean of 15.0 gallons and a standard deviation of 0.15 gallons.What proportion of tanks will hold between 14.75 and 15.10 gallons of gas?
A)0.35
B)0.6563
C)0.6997
D)0.9833
A)0.35
B)0.6563
C)0.6997
D)0.9833
Unlock Deck
Unlock for access to all 77 flashcards in this deck.
Unlock Deck
k this deck
65
During the summer months,the prices of nonsmoking rooms with a king-sized bed in hotels in a certain area are roughly Normally distributed with a mean of $131.80 and a standard deviation of $29.12.A travel agent randomly selects prices of nonsmoking rooms with a king-sized bed from 15 hotels in the area.What is the probability that their average cost will be more than $150?
A)0.0077
B)0.1125
C)0.2660
D)0.3678
A)0.0077
B)0.1125
C)0.2660
D)0.3678
Unlock Deck
Unlock for access to all 77 flashcards in this deck.
Unlock Deck
k this deck
66
Birth weights of babies born to full-term pregnancies follow roughly a Normal distribution.At Meadowbrook Hospital,the mean weight of babies born to full-term pregnancies is 7 pounds with a standard deviation of 14 ounces (1 pound = 16 ounces). Dr.Watts (who works at Meadowbrook Hospital)has four deliveries (all for full-term pregnancies)coming up during the night.Assume that the birth weights of these four babies can be viewed as a simple random sample.What is the probability that all four babies will weigh more than 7.5 pounds?
A)0.0065
B)0.1265
C)0.2839
D)0.4858
A)0.0065
B)0.1265
C)0.2839
D)0.4858
Unlock Deck
Unlock for access to all 77 flashcards in this deck.
Unlock Deck
k this deck
67
A length of chain is to be constructed by placing 36 component links end to end.The length of a link produced by a production process is known to be a random variable with a mean of = 2.5 centimeters and a standard deviation of = 0.2 centimeters.The 36 links are chosen at random from this process to produce the chain.The mean and standard deviation of the length of chain are,respectively,_________.
A)90 centimeters and 7.2 centimeters
B)36 centimeters and 1.2 centimeters
C)90 centimeters and 2.7 centimeters
D)90 centimeters and 1.2 centimeters
E)36 centimeters and 7.2 centimeters
A)90 centimeters and 7.2 centimeters
B)36 centimeters and 1.2 centimeters
C)90 centimeters and 2.7 centimeters
D)90 centimeters and 1.2 centimeters
E)36 centimeters and 7.2 centimeters
Unlock Deck
Unlock for access to all 77 flashcards in this deck.
Unlock Deck
k this deck
68
Birth weights of babies born to full-term pregnancies follow roughly a Normal distribution.At Meadowbrook Hospital,the mean weight of babies born to full-term pregnancies is 7 pounds with a standard deviation of 14 ounces (1 pound = 16 ounces). What is the probability that the average weight of the four babies will be more than 7.5 pounds?
A)0.0065
B)0.1265
C)0.2839
D)0.4858
A)0.0065
B)0.1265
C)0.2839
D)0.4858
Unlock Deck
Unlock for access to all 77 flashcards in this deck.
Unlock Deck
k this deck
69
Thousands of batteries are produced every day in a certain manufacturing plant.The quality control specialist is interested in how long it takes for each battery to fail when used in a moderately sized appliance,like a portable radio or CD player.The quality control specialist will take a simple random sample of 2000 batteries produced at this plant over the next four days.These batteries will be put into a variety of moderately sized appliances and the average of all failure times will be computed.Which of the following probability distributions is most appropriate to model the average time until failure of these 2000 batteries?
A)The uniform distribution
B)The Normal distribution
C)The binomial distribution
D)The Weibull distribution
of all failure times will be computed.Which of the following probability distributions is most appropriate to model the average time until failure of these 2000 batteries?A)The uniform distribution
B)The Normal distribution
C)The binomial distribution
D)The Weibull distribution
Unlock Deck
Unlock for access to all 77 flashcards in this deck.
Unlock Deck
k this deck
70
A random variable X is Normally distributed with mean = 75 and = 8.Let Y be a second Normally distributed random variable with mean = 70 and = 12.It is also known that X and Y are independent of one another.Let W be a random variable that is the difference between X and Y (i.e. ,W = X - Y).What is the probability that W is greater than -5.5 (i.e. ,P{W > -5.5})?
A)0.233
B)0.512
C)0.767
D)0.488
E)Not within ± 0.005 of any of the above
= 75 and = 8.Let Y be a second Normally distributed random variable with mean = 70 and = 12.It is also known that X and Y are independent of one another.Let W be a random variable that is the difference between X and Y (i.e. ,W = X - Y).What is the probability that W is greater than -5.5 (i.e. ,P{W > -5.5})?A)0.233
B)0.512
C)0.767
D)0.488
E)Not within ± 0.005 of any of the above
Unlock Deck
Unlock for access to all 77 flashcards in this deck.
Unlock Deck
k this deck
71
A gasoline tank for a certain car is designed to hold 15 gallons of gas.Suppose that the actual capacity of a randomly selected tank has a distribution that is approximately Normal with a mean of 15.0 gallons and a standard deviation of 0.15 gallons.The manufacturer of this gasoline tank considers the largest 2% of these tanks too large to put on the market.How large does a tank have to be to be considered too large?
A)15 gallons
B)15.31 gallons
C)15.72 gallons
D)16 gallons
A)15 gallons
B)15.31 gallons
C)15.72 gallons
D)16 gallons
Unlock Deck
Unlock for access to all 77 flashcards in this deck.
Unlock Deck
k this deck
72
A gasoline tank for a certain car is designed to hold 15 gallons of gas.Suppose that the actual capacity of a randomly selected tank has a distribution that is approximately Normal with a mean of 15.0 gallons and a standard deviation of 0.15 gallons.If four tanks are randomly selected,what is the probability that their average capacity will be between 14.75 and 15.10 gallons?
A)0.2397
B)0.6808
C)0.9084
D)0.9962
A)0.2397
B)0.6808
C)0.9084
D)0.9962
Unlock Deck
Unlock for access to all 77 flashcards in this deck.
Unlock Deck
k this deck
73
A gasoline tank for a certain car is designed to hold 15 gallons of gas.Suppose that the actual capacity of a randomly selected tank has a distribution that is approximately Normal with a mean of 15.0 gallons and a standard deviation of 0.15 gallons.If a simple random sample of four tanks is selected,and their capacities can be considered independent,what is the probability that all four will hold between 14.75 and 15.10 gallons of gas?
A)0.2397
B)0.6808
C)0.9084
D)2.7988
A)0.2397
B)0.6808
C)0.9084
D)2.7988
Unlock Deck
Unlock for access to all 77 flashcards in this deck.
Unlock Deck
k this deck
74
The distribution of the amount of money undergraduate students spend on books for a term is slightly right-skewed,with a mean of $400 and a standard deviation of $80.In a simple random sample of 100 undergraduate students,what is the expected value of the sample mean amount of money spent on books?
A)$400
B)Anywhere between $320 and $480
C)Anywhere between $392 and $408
D)This can't be determined from the information given.
A)$400
B)Anywhere between $320 and $480
C)Anywhere between $392 and $408
D)This can't be determined from the information given.
Unlock Deck
Unlock for access to all 77 flashcards in this deck.
Unlock Deck
k this deck
75
The distribution of the amount of money undergraduate students spend on books for a term is slightly right-skewed,with a mean of $400 and a standard deviation of $80.If a simple random sample of 100 undergraduate students is selected,what is the probability that these students spend,on average,more than $425 on books?
A)0.00089
B)0.2353
C)0.3773
D)This can't be determined from the information given.
A)0.00089
B)0.2353
C)0.3773
D)This can't be determined from the information given.
Unlock Deck
Unlock for access to all 77 flashcards in this deck.
Unlock Deck
k this deck
76
A random variable X is Normally distributed with mean = 75 and = 8.Let Y be a second Normally distributed random variable with mean = 70 and = 12.It is also known that X and Y are independent of one another.Let W be a random variable that is the difference between X and Y (i.e. ,W = X - Y).What can be said about the distribution of W?
A)W is N(0,20)
B)W is N(5,20)
C)W is N(5,-4)
D)W is N(5,14.4)
E)W is N(0,14.4)
= 75 and = 8.Let Y be a second Normally distributed random variable with mean = 70 and = 12.It is also known that X and Y are independent of one another.Let W be a random variable that is the difference between X and Y (i.e. ,W = X - Y).What can be said about the distribution of W?A)W is N(0,20)
B)W is N(5,20)
C)W is N(5,-4)
D)W is N(5,14.4)
E)W is N(0,14.4)
Unlock Deck
Unlock for access to all 77 flashcards in this deck.
Unlock Deck
k this deck
77
Birth weights of babies born to full-term pregnancies follow roughly a Normal distribution.At Meadowbrook Hospital,the mean weight of babies born to full-term pregnancies is 7 pounds with a standard deviation of 14 ounces (1 pound = 16 ounces). Rachel is one of Dr.Watts's patients.Rachel had an ultrasound 3 weeks ago and the doctors established that the baby already weighed 7 pounds at that point.She is about to deliver her baby (full term).What is the probability that the baby will be more than 8 pounds?
A)0.0065
B)0.1265
C)0.2531
D)0.4858
A)0.0065
B)0.1265
C)0.2531
D)0.4858
Unlock Deck
Unlock for access to all 77 flashcards in this deck.
Unlock Deck
k this deck
Unlock Deck
Unlock for access to all 77 flashcards in this deck.


