Deck 15: Forecasting
Full screen (f)
Question
Question
Question
Question
Question
Question
Question
Question
Question
Question
Question
Question
Question
Question
Question
Question
Question
Question
Question
Question
Question
Question
Question
Question
Question
Question
Question
Question
Question
Question
Question
Question
Question
Question
Question
Question
Question
Question
Question
Question
Question
Question
Question
Question
Given the following data on the number of pints of ice cream sold at a local ice cream store for a 6-period time frame:
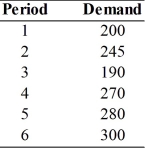
Compute a 5-period moving average for period 6.
Compute a 5-period moving average for period 6.
Question
Question
Question
Given the following data on the number of pints of ice cream sold at a local ice cream store for a 6-period time frame:
Compute a 3-period moving average for period 6.
Compute a 3-period moving average for period 6.
Question
Question
Question
Question
Question
Question
Given the following data on the number of pints of ice cream sold at a local ice cream store for a 6-period time frame:
Compute a 3-period moving average for period 4.
Compute a 3-period moving average for period 4.
Question
Question
Question
Question
Given the following data on the number of pints of ice cream sold at a local ice cream store for a 6-period time frame:
Compute a 5-period moving average for period 7.
Compute a 5-period moving average for period 7.
Question
Question
Question
Given the following data on the number of pints of ice cream sold at a local ice cream store for a 6-period time frame:
Compute a 3-period moving average for period 7.
Compute a 3-period moving average for period 7.
Question
The following sales data are available for 2003-2008:
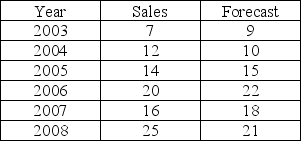
Calculate the average error.
Calculate the average error.
Question
Sally has been running the following number of ads in the local newspaper to help attract customers into her store. She has also been keeping track of customers who have come into the store as a result of the ads, as well as the amount of money they spend.
This is the data from the last 4 weeks:
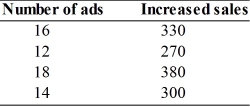
Determine the equation that relates ads and increased sales.
This is the data from the last 4 weeks:
Determine the equation that relates ads and increased sales.
Question
Question
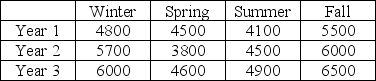
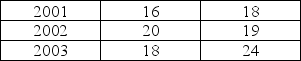
Quarterly sales is given for the past 3 years. Determine the seasonal factors for each quarter.
Question
Question
Sally has been running the following number of ads in the local newspaper to help attract customers into her store. She has also been keeping track of customers who have come into the store as a result of the ads, as well as the amount of money they spend.
This is the data from the last 4 weeks:
If Sally runs 15 ads, how much will sales increase?
This is the data from the last 4 weeks:
If Sally runs 15 ads, how much will sales increase?
Question
Recent past demand for product ZXT is given in the following table.
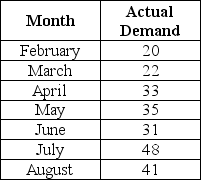
Determine the forecasted demand for April and May based on adjusted exponential smoothing with α = .2, β = .3, a February forecast of 20, and T=0.
Determine the forecasted demand for April and May based on adjusted exponential smoothing with α = .2, β = .3, a February forecast of 20, and T=0.
Question
Question
The following data summarizes the historical demand for a product.
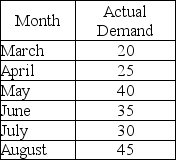
Use exponential smoothing with α = .2 and a smoothed forecast for July of 32 to determine August and September's smoothed forecasts.
Use exponential smoothing with α = .2 and a smoothed forecast for July of 32 to determine August and September's smoothed forecasts.
Question
Robert has the following accounts on money spent on gambling and winnings:
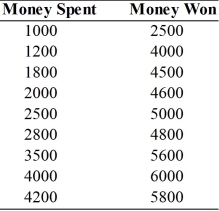
Develop a regression equation that relates the money Robert spends and the money he wins.
Develop a regression equation that relates the money Robert spends and the money he wins.
Question
Assume that the forecasted demand for 2006 is 15. Use the following data set and exponential smoothing with α = 0.4 and determine the forecasted demand for 2009. 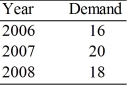
Question
Robert wants to know if there is a relation between money spent on gambling and winnings. 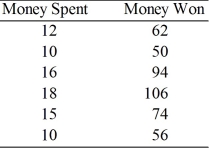
What is the coefficient of determination?
What is the coefficient of determination?
Question
Question
Question
Given the following data, compute the MAD for the forecast.
Year Demand Forecast
Year Demand Forecast
Question
Question
Question
Question
Question
The following sales data are available for 2003-2008. 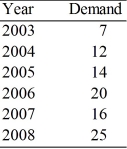
Determine a 4-year weighted moving average forecast for 2009, where weights are
W1 = .1, W2 = .2, W3 = .2 and W4 = .5.
Determine a 4-year weighted moving average forecast for 2009, where weights are
W1 = .1, W2 = .2, W3 = .2 and W4 = .5.

Unlock Deck
Sign up to unlock the cards in this deck!
Unlock Deck
Unlock Deck
1/133
Play
Full screen (f)
Deck 15: Forecasting
1
Seasonal patterns are observed only during the four seasons - winter, spring, summer, and fall.
False
2
Time series is a category of statistical techniques that uses historical data to predict future behavior.
True
3
Shorter-period moving averages react more slowly to recent demand changes than do longer-period moving averages.
False
4
Adjusted exponential smoothing is an exponential smoothing forecast adjusted for seasonality.
Unlock Deck
Unlock for access to all 133 flashcards in this deck.
Unlock Deck
k this deck
5
Moving averages are good for stable demand with no pronounced behavioral patterns.
Unlock Deck
Unlock for access to all 133 flashcards in this deck.
Unlock Deck
k this deck
6
The basic types of forecasting methods include time series, regression, and qualitative methods.
Unlock Deck
Unlock for access to all 133 flashcards in this deck.
Unlock Deck
k this deck
7
Longer-period moving averages react more slowly to recent demand changes than do shorter-period moving averages.
Unlock Deck
Unlock for access to all 133 flashcards in this deck.
Unlock Deck
k this deck
8
Regression methods attempt to develop a mathematical relationship between the item being forecast and factors that cause it to behave the way it does.
Unlock Deck
Unlock for access to all 133 flashcards in this deck.
Unlock Deck
k this deck
9
Random variations are movements that are not predictable and follow no pattern.
Unlock Deck
Unlock for access to all 133 flashcards in this deck.
Unlock Deck
k this deck
10
Time series methods assume that what has occurred in the past will continue to occur in the future.
Unlock Deck
Unlock for access to all 133 flashcards in this deck.
Unlock Deck
k this deck
11
A trend is a gradual, long-term, up-or-down movement of demand.
Unlock Deck
Unlock for access to all 133 flashcards in this deck.
Unlock Deck
k this deck
12
Irregular variations exhibit no pattern.
Unlock Deck
Unlock for access to all 133 flashcards in this deck.
Unlock Deck
k this deck
13
Qualitative methods use management judgment, expertise, and opinion to make forecasts.
Unlock Deck
Unlock for access to all 133 flashcards in this deck.
Unlock Deck
k this deck
14
Technological forecasting helps determine the technological feasibility of new products by surveying large numbers of consumers.
Unlock Deck
Unlock for access to all 133 flashcards in this deck.
Unlock Deck
k this deck
15
In a weighted moving average, weights must sum to 1.
Unlock Deck
Unlock for access to all 133 flashcards in this deck.
Unlock Deck
k this deck
16
The Delphi method develops a consensus forecast about what will occur in the future.
Unlock Deck
Unlock for access to all 133 flashcards in this deck.
Unlock Deck
k this deck
17
A seasonal pattern is an up-and-down repetitive movement within a trend occurring periodically.
Unlock Deck
Unlock for access to all 133 flashcards in this deck.
Unlock Deck
k this deck
18
Qualitative methods are the least common type of forecasting method for the long-term strategic planning process.
Unlock Deck
Unlock for access to all 133 flashcards in this deck.
Unlock Deck
k this deck
19
A cycle is an up-or-down movement in demand that repeats itself in less than 1 year.
Unlock Deck
Unlock for access to all 133 flashcards in this deck.
Unlock Deck
k this deck
20
Data cannot exhibit both trend and cyclical patterns.
Unlock Deck
Unlock for access to all 133 flashcards in this deck.
Unlock Deck
k this deck
21
If average forecast error is positive, it indicates that the forecast is biased high.
Unlock Deck
Unlock for access to all 133 flashcards in this deck.
Unlock Deck
k this deck
22
A(n) ________ is an up-and-down repetitive movement within a trend occurring periodically.
Unlock Deck
Unlock for access to all 133 flashcards in this deck.
Unlock Deck
k this deck
23
Daily operations are assisted by ________-range forecasting
Unlock Deck
Unlock for access to all 133 flashcards in this deck.
Unlock Deck
k this deck
24
In the regression equation y=a+bx, the slope of the equation is x.
Unlock Deck
Unlock for access to all 133 flashcards in this deck.
Unlock Deck
k this deck
25
The dependent variable in linear regression is usually designated as the x variable.
Unlock Deck
Unlock for access to all 133 flashcards in this deck.
Unlock Deck
k this deck
26
Regression is used to relate one variable to one or more variables.
Unlock Deck
Unlock for access to all 133 flashcards in this deck.
Unlock Deck
k this deck
27
A(n) ________ forecast typically encompass a period longer than one year.
Unlock Deck
Unlock for access to all 133 flashcards in this deck.
Unlock Deck
k this deck
28
One problem with multiple regression is ________, which is a measure of the amount of "overlapping" information about the dependent variable that's provided by several independent variables.
Unlock Deck
Unlock for access to all 133 flashcards in this deck.
Unlock Deck
k this deck
29
Knowledgeable individuals bring their opinions to bear in ________, a qualitative method of forecasting.
Unlock Deck
Unlock for access to all 133 flashcards in this deck.
Unlock Deck
k this deck
30
A long-term wave in a demand pattern that undulates gracefully over a period of greater than a year is a(n) ________.
Unlock Deck
Unlock for access to all 133 flashcards in this deck.
Unlock Deck
k this deck
31
The major types of forecasting methods are ________, ________, and ________.
Unlock Deck
Unlock for access to all 133 flashcards in this deck.
Unlock Deck
k this deck
32
Exponential smoothing forecasts are more sensitive or reactive to the changes in demand as the value of the smoothing constant, α, ________.
Unlock Deck
Unlock for access to all 133 flashcards in this deck.
Unlock Deck
k this deck
33
A(n) ________ forecast encompasses the immediate future, is concerned with daily activities of the firm and does not go beyond one or two months in to the future.
Unlock Deck
Unlock for access to all 133 flashcards in this deck.
Unlock Deck
k this deck
34
________ relates demand to two or more independent variables.
Unlock Deck
Unlock for access to all 133 flashcards in this deck.
Unlock Deck
k this deck
35
Correlation measures the strength of relationship between the x and y variables and the closer it is to 1 or -1, the greater the proof that the level of x determines the level of y.
Unlock Deck
Unlock for access to all 133 flashcards in this deck.
Unlock Deck
k this deck
36
________ error is the sum of the forecast errors.
Unlock Deck
Unlock for access to all 133 flashcards in this deck.
Unlock Deck
k this deck
37
Unpredictable movements in demand that follow no pattern are ________.
Unlock Deck
Unlock for access to all 133 flashcards in this deck.
Unlock Deck
k this deck
38
The coefficient of determination provides a measure of how the level of the independent variable in a regression equation explains the level of the dependent variable in the equation.
Unlock Deck
Unlock for access to all 133 flashcards in this deck.
Unlock Deck
k this deck
39
________ is a gradual, long-term, upward or downward movement of demand.
Unlock Deck
Unlock for access to all 133 flashcards in this deck.
Unlock Deck
k this deck
40
The closer the value of α is to zero, the ________ will be the dampening or smoothing effect.
Unlock Deck
Unlock for access to all 133 flashcards in this deck.
Unlock Deck
k this deck
41
Daily highs in Sacramento for the past week (from least to most recent) were:
95, 102, 101, 96, 95, 90 and 92. Develop a forecast for today using a 2-day moving average.
95, 102, 101, 96, 95, 90 and 92. Develop a forecast for today using a 2-day moving average.
Unlock Deck
Unlock for access to all 133 flashcards in this deck.
Unlock Deck
k this deck
42
Using the exponential smoothing factor 0.3, how many check-ins can be forecasted for January? Assume the forecast for December was 122 rooms.
Unlock Deck
Unlock for access to all 133 flashcards in this deck.
Unlock Deck
k this deck
43
Longer-period moving averages react more ________ to recent demand changes than do shorter period moving averages.
Unlock Deck
Unlock for access to all 133 flashcards in this deck.
Unlock Deck
k this deck
44
Given the following data on the number of pints of ice cream sold at a local ice cream store for a 6-period time frame:
Compute a 5-period moving average for period 6.
Compute a 5-period moving average for period 6.
Unlock Deck
Unlock for access to all 133 flashcards in this deck.
Unlock Deck
k this deck
45
The ________ is the sum of the absolute value of forecasting errors divided by the number of periods in which a forecast was made.
Unlock Deck
Unlock for access to all 133 flashcards in this deck.
Unlock Deck
k this deck
46
MAPD measures ________.
Unlock Deck
Unlock for access to all 133 flashcards in this deck.
Unlock Deck
k this deck
47
Given the following data on the number of pints of ice cream sold at a local ice cream store for a 6-period time frame:
Compute a 3-period moving average for period 6.
Compute a 3-period moving average for period 6.
Unlock Deck
Unlock for access to all 133 flashcards in this deck.
Unlock Deck
k this deck
48
Using a 3-month moving average, how many check-ins can be forecasted for January?
Unlock Deck
Unlock for access to all 133 flashcards in this deck.
Unlock Deck
k this deck
49
Daily highs in Sacramento for the past week (from least to most recent) were:
95, 102, 101, 96, 95, 90 and 92. Develop a forecast for today using a 3-day moving average.
95, 102, 101, 96, 95, 90 and 92. Develop a forecast for today using a 3-day moving average.
Unlock Deck
Unlock for access to all 133 flashcards in this deck.
Unlock Deck
k this deck
50
________ measures the strength of the relationship between two variables.
Unlock Deck
Unlock for access to all 133 flashcards in this deck.
Unlock Deck
k this deck
51
The ________ is the percentage of variation in the dependent variable that results from the independent variable.
Unlock Deck
Unlock for access to all 133 flashcards in this deck.
Unlock Deck
k this deck
52
Given the following data on hotel check-ins for a 6-month period:
July: 70 rooms
August: 105 rooms
September: 90 rooms
October: 120 rooms
November: 110 rooms
December: 115 rooms
-What is the 3-month moving average forecast for January?
July: 70 rooms
August: 105 rooms
September: 90 rooms
October: 120 rooms
November: 110 rooms
December: 115 rooms
-What is the 3-month moving average forecast for January?
Unlock Deck
Unlock for access to all 133 flashcards in this deck.
Unlock Deck
k this deck
53
Given the following data on the number of pints of ice cream sold at a local ice cream store for a 6-period time frame:
Compute a 3-period moving average for period 4.
Compute a 3-period moving average for period 4.
Unlock Deck
Unlock for access to all 133 flashcards in this deck.
Unlock Deck
k this deck
54
________ are the movements or fluctuation in demand that exhibit no pattern and occur on a random basis.
Unlock Deck
Unlock for access to all 133 flashcards in this deck.
Unlock Deck
k this deck
55
The ________ is the average of the sum of the squared errors.
Unlock Deck
Unlock for access to all 133 flashcards in this deck.
Unlock Deck
k this deck
56
________ is a type of exponential smoothing that can also include trend.
Unlock Deck
Unlock for access to all 133 flashcards in this deck.
Unlock Deck
k this deck
57
Given the following data on the number of pints of ice cream sold at a local ice cream store for a 6-period time frame:
Compute a 5-period moving average for period 7.
Compute a 5-period moving average for period 7.
Unlock Deck
Unlock for access to all 133 flashcards in this deck.
Unlock Deck
k this deck
58
Daily highs in Sacramento for the past week (from least to most recent) were:
95, 102, 101, 96, 95, 90 and 92. Develop a forecast for today using a weighted moving average, with a weights of .6, .3, and .1, where the highest weights are applied to the most recent data.
95, 102, 101, 96, 95, 90 and 92. Develop a forecast for today using a weighted moving average, with a weights of .6, .3, and .1, where the highest weights are applied to the most recent data.
Unlock Deck
Unlock for access to all 133 flashcards in this deck.
Unlock Deck
k this deck
59
Given the following data on hotel check-ins for a 6-month period:
July: 70 rooms
August: 105 rooms
September: 90 rooms
October: 120 rooms
November: 110 rooms
December: 115 rooms
-With alpha = 0.2, what is the simple exponential smoothing forecast for October? Assume the forecast for July was 80 rooms.
July: 70 rooms
August: 105 rooms
September: 90 rooms
October: 120 rooms
November: 110 rooms
December: 115 rooms
-With alpha = 0.2, what is the simple exponential smoothing forecast for October? Assume the forecast for July was 80 rooms.
Unlock Deck
Unlock for access to all 133 flashcards in this deck.
Unlock Deck
k this deck
60
Given the following data on the number of pints of ice cream sold at a local ice cream store for a 6-period time frame:
Compute a 3-period moving average for period 7.
Compute a 3-period moving average for period 7.
Unlock Deck
Unlock for access to all 133 flashcards in this deck.
Unlock Deck
k this deck
61
The following sales data are available for 2003-2008:
Calculate the average error.
Calculate the average error.
Unlock Deck
Unlock for access to all 133 flashcards in this deck.
Unlock Deck
k this deck
62
Sally has been running the following number of ads in the local newspaper to help attract customers into her store. She has also been keeping track of customers who have come into the store as a result of the ads, as well as the amount of money they spend.
This is the data from the last 4 weeks:
Determine the equation that relates ads and increased sales.
This is the data from the last 4 weeks:
Determine the equation that relates ads and increased sales.
Unlock Deck
Unlock for access to all 133 flashcards in this deck.
Unlock Deck
k this deck
63
Simple exponential smoothing is being used to forecast demand. The previous forecast of 66 turned out to be four units less than actual demand. If the next forecast is 66.6, what is the value of the smoothing constant, α?
Unlock Deck
Unlock for access to all 133 flashcards in this deck.
Unlock Deck
k this deck
64
Quarterly sales is given for the past 3 years. Determine the seasonal factors for each quarter.
Unlock Deck
Unlock for access to all 133 flashcards in this deck.
Unlock Deck
k this deck
65
Robert has the following accounts on money spent on gambling and winnings:
-Determine the correlation coefficient and the coefficient of determination.
-Determine the correlation coefficient and the coefficient of determination.
Unlock Deck
Unlock for access to all 133 flashcards in this deck.
Unlock Deck
k this deck
66
Sally has been running the following number of ads in the local newspaper to help attract customers into her store. She has also been keeping track of customers who have come into the store as a result of the ads, as well as the amount of money they spend.
This is the data from the last 4 weeks:
If Sally runs 15 ads, how much will sales increase?
This is the data from the last 4 weeks:
If Sally runs 15 ads, how much will sales increase?
Unlock Deck
Unlock for access to all 133 flashcards in this deck.
Unlock Deck
k this deck
67
Recent past demand for product ZXT is given in the following table.
Determine the forecasted demand for April and May based on adjusted exponential smoothing with α = .2, β = .3, a February forecast of 20, and T=0.
Determine the forecasted demand for April and May based on adjusted exponential smoothing with α = .2, β = .3, a February forecast of 20, and T=0.
Unlock Deck
Unlock for access to all 133 flashcards in this deck.
Unlock Deck
k this deck
68
If the forecast is 14 and the actual value is 15, then the error this period is
Unlock Deck
Unlock for access to all 133 flashcards in this deck.
Unlock Deck
k this deck
69
The following data summarizes the historical demand for a product.
Use exponential smoothing with α = .2 and a smoothed forecast for July of 32 to determine August and September's smoothed forecasts.
Use exponential smoothing with α = .2 and a smoothed forecast for July of 32 to determine August and September's smoothed forecasts.
Unlock Deck
Unlock for access to all 133 flashcards in this deck.
Unlock Deck
k this deck
70
Robert has the following accounts on money spent on gambling and winnings:
Develop a regression equation that relates the money Robert spends and the money he wins.
Develop a regression equation that relates the money Robert spends and the money he wins.
Unlock Deck
Unlock for access to all 133 flashcards in this deck.
Unlock Deck
k this deck
71
Assume that the forecasted demand for 2006 is 15. Use the following data set and exponential smoothing with α = 0.4 and determine the forecasted demand for 2009.
Unlock Deck
Unlock for access to all 133 flashcards in this deck.
Unlock Deck
k this deck
72
Robert wants to know if there is a relation between money spent on gambling and winnings.
What is the coefficient of determination?
What is the coefficient of determination?
Unlock Deck
Unlock for access to all 133 flashcards in this deck.
Unlock Deck
k this deck
73
The following sales data are available for 2003-2008:
Determine a 4-year moving average forecast for 2008 and 2009.
Determine a 4-year moving average forecast for 2008 and 2009.
Unlock Deck
Unlock for access to all 133 flashcards in this deck.
Unlock Deck
k this deck
74
If the forecast is 33 and the actual value is 44, then the error this period is ________.
Unlock Deck
Unlock for access to all 133 flashcards in this deck.
Unlock Deck
k this deck
75
Given the following data, compute the MAD for the forecast.
Year Demand Forecast
Year Demand Forecast
Unlock Deck
Unlock for access to all 133 flashcards in this deck.
Unlock Deck
k this deck
76
Recent past demand for product ZXT is given in the following table.
-Use simple exponential smoothing with alpha = .4 and determine the forecasted demand for August and September. Assume that the smoothed forecast for July is 38.
-Use simple exponential smoothing with alpha = .4 and determine the forecasted demand for August and September. Assume that the smoothed forecast for July is 38.
Unlock Deck
Unlock for access to all 133 flashcards in this deck.
Unlock Deck
k this deck
77
If the absolute errors were calculated for 5 periods and the sum of the absolute deviation is 60, what is the value of the MAD?
Unlock Deck
Unlock for access to all 133 flashcards in this deck.
Unlock Deck
k this deck
78
Recent past demand for product ZXT is given in the following table.
-Base on a three-month weighted moving average with weights w1 = .1, w2 = .4, and w3 = .5 (most recent), determine the forecasted demand for August and September. What is the forecast error in August?
-Base on a three-month weighted moving average with weights w1 = .1, w2 = .4, and w3 = .5 (most recent), determine the forecasted demand for August and September. What is the forecast error in August?
Unlock Deck
Unlock for access to all 133 flashcards in this deck.
Unlock Deck
k this deck
79
If the forecast is 25 and the actual value is 25, then the error this period is ________.
Unlock Deck
Unlock for access to all 133 flashcards in this deck.
Unlock Deck
k this deck
80
The following sales data are available for 2003-2008.
Determine a 4-year weighted moving average forecast for 2009, where weights are
W1 = .1, W2 = .2, W3 = .2 and W4 = .5.
Determine a 4-year weighted moving average forecast for 2009, where weights are
W1 = .1, W2 = .2, W3 = .2 and W4 = .5.
Unlock Deck
Unlock for access to all 133 flashcards in this deck.
Unlock Deck
k this deck
Unlock Deck
Unlock for access to all 133 flashcards in this deck.


