Deck 2: Describing Data With Numerical Measures
Full screen (f)
Question
Question
Question
Question
Question
Question
Question
Question
Question
Question
Question
Question
Question
Question
Question
Question
Question
Question
Question
Question
Question
Question
Question
The expression 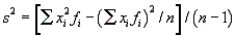 ;
;  is recognizable as the formula for which of the following measures?
A) the sample variance, computed from ungrouped data
B) the population variance, computed from ungrouped data
C) the sample variance, computed from grouped data
D) the population variance, computed from grouped data
; is recognizable as the formula for which of the following measures?A) the sample variance, computed from ungrouped data
B) the population variance, computed from ungrouped data
C) the sample variance, computed from grouped data
D) the population variance, computed from grouped data
Question
Question
Question
Question
Question
According to Tchebysheff's Theorem, which of the following bounds will delimit the fraction of observations falling within k (where  ) standard deviations of the mean?
A) at most, 1 -
B) at least
C) at most, 1 -
D) at least 1 -
) standard deviations of the mean?A) at most, 1 -
B) at least
C) at most, 1 -
D) at least 1 -
Question
Question
Question
Question
Question
Question
Question
Question
Question
The expression  where
where  is recognizable as the formula for which of the following measures?
A) the population mean, computed from ungrouped data
B) the sample mean, computed from ungrouped data
C) the population mean, computed from grouped data
D) the sample mean, computed from grouped data
where is recognizable as the formula for which of the following measures?A) the population mean, computed from ungrouped data
B) the sample mean, computed from ungrouped data
C) the population mean, computed from grouped data
D) the sample mean, computed from grouped data
Question
Question
Question
Question
A sample of 600 values produced the following summary statistics: 

 and
and  Given this information, which of the following values constitutes the lower fence on a box plot?
A) -4.60
B) 26.80
C) 75.80
D) 102.60
and Given this information, which of the following values constitutes the lower fence on a box plot?A) -4.60
B) 26.80
C) 75.80
D) 102.60
Question
A sample of 50 values produced the following summary statistics: 

 and
and  Based on this information, what are the left and right ends, respectively, of the box plot using whiskers?
A) 5.3 and 32.0
B) 10 and 14.6
C) 10 and 16.7
D) 14.6 and 16.7
and Based on this information, what are the left and right ends, respectively, of the box plot using whiskers?A) 5.3 and 32.0
B) 10 and 14.6
C) 10 and 16.7
D) 14.6 and 16.7
Question
Question
Question
Question
Question
Question
Question
Question
Question
The following summary statistics were computed from a sample of size 250: 

 and
and  Given this information, which of the following statements is correct?
A) The distribution of the data is slightly right-skewed.
B) The distribution of the data is symmetric.
C) A data value of 1 is an outlier.
D) A data value of 25 is an outlier.
and Given this information, which of the following statements is correct?A) The distribution of the data is slightly right-skewed.
B) The distribution of the data is symmetric.
C) A data value of 1 is an outlier.
D) A data value of 25 is an outlier.
Question
Question
Question
If, from a set of data, the sample mean  was found to be 15 but the sample median was only 9, then the data set would be said to be skewed to the right.
was found to be 15 but the sample median was only 9, then the data set would be said to be skewed to the right. Question
Question
Question
Question
Question
A sample of 600 values produced the following summary statistics: 

 and
and  Given this information, which of the following values is the upper fence on a box plot of this data set?
A) -4.60
B) 26.80
C) 75.80
D) 102.60
and Given this information, which of the following values is the upper fence on a box plot of this data set?A) -4.60
B) 26.80
C) 75.80
D) 102.60
Question
Question
Question
Question
Question
Question
Question
Question
Question
Question
Question
Question
Question
Question
Question
Question
Question
Question
Question
Question
The larger the values of the sample variance,  , and the sample standard deviation, s, the greater the variability in the data.
, and the sample standard deviation, s, the greater the variability in the data. Question

Unlock Deck
Sign up to unlock the cards in this deck!
Unlock Deck
Unlock Deck
1/235
Play
Full screen (f)
Deck 2: Describing Data With Numerical Measures
1
In a histogram, what may one conclude about the proportion of the total area that must be to the left of the median?
A) It is exactly 0.50.
B) It is less than 0.50 if the distribution is skewed to the left.
C) It is more than 0.50 if the distribution is skewed to the right.
D) It is between 0.25 and 0.75 if the distribution is symmetric.
A) It is exactly 0.50.
B) It is less than 0.50 if the distribution is skewed to the left.
C) It is more than 0.50 if the distribution is skewed to the right.
D) It is between 0.25 and 0.75 if the distribution is symmetric.
A
2
Which of the following statements about the mean is NOT always correct?
A) The sum of the deviations from the mean is 0.
B) Half the observations are on either side of the mean.
C) The mean is a measure of the middle of a distribution.
D) The value of the mean times the number of observations equals the sum of all of the observations.
A) The sum of the deviations from the mean is 0.
B) Half the observations are on either side of the mean.
C) The mean is a measure of the middle of a distribution.
D) The value of the mean times the number of observations equals the sum of all of the observations.
B
3
The following data represent a sample of 10 scores on a 20-point statistics quiz: 16, 16, 16, 16, 16, 18, 18, 20, 20, and 20. After the mean, median, range, and variance were calculated for the scores, it was discovered that one of the scores of 20 should have been an 18. Which of the following pairs of measures will change when the calculations are redone using the correct scores?
A) mean and range
B) median and range
C) mean and variance
D) median and variance
A) mean and range
B) median and range
C) mean and variance
D) median and variance
C
4
A random sample from an unknown population had a sample standard deviation of zero. From this piece of information, which one of the following is a reasonable conclusion?
A) The sample range must be zero.
B) An error was made in computing the sample standard deviation. It must always be greater than zero.
C) The population standard deviation must be zero.
D) The population standard deviation must be less than zero
A) The sample range must be zero.
B) An error was made in computing the sample standard deviation. It must always be greater than zero.
C) The population standard deviation must be zero.
D) The population standard deviation must be less than zero
Unlock Deck
Unlock for access to all 235 flashcards in this deck.
Unlock Deck
k this deck
5
Which of the following best describes the relationship between the population mean and the sample mean?
A) The population mean is always larger than the sample mean.
B) The population mean is always smaller than the sample mean.
C) The population mean is always larger than or equal to the sample mean.
D) The population mean can be smaller than, larger than, or equal to the sample mean.
A) The population mean is always larger than the sample mean.
B) The population mean is always smaller than the sample mean.
C) The population mean is always larger than or equal to the sample mean.
D) The population mean can be smaller than, larger than, or equal to the sample mean.
Unlock Deck
Unlock for access to all 235 flashcards in this deck.
Unlock Deck
k this deck
6
Which of the following is a meaningful measure of centre when the data are qualitative?
A) the mean
B) the median
C) the mode
D) the quartile
A) the mean
B) the median
C) the mode
D) the quartile
Unlock Deck
Unlock for access to all 235 flashcards in this deck.
Unlock Deck
k this deck
7
Which of the following statements describes the variance of a data set?
A) The variance is a mean of absolute deviations.
B) The variance is a mean of positive and negative deviations.
C) The variance is a mean of squared deviations.
D) The variance is a mean of only the positive deviations.
A) The variance is a mean of absolute deviations.
B) The variance is a mean of positive and negative deviations.
C) The variance is a mean of squared deviations.
D) The variance is a mean of only the positive deviations.
Unlock Deck
Unlock for access to all 235 flashcards in this deck.
Unlock Deck
k this deck
8
The following 10 scores were obtained on a 20-point quiz: 4, 5, 8, 9, 11, 13, 15, 18, 18, and 20. The teacher computed the usual descriptive measures of centre and variability for these data, and then discovered an error was made. One of the 18s should have been a 16. Which pair of the following measures, calculated on the corrected data, would change from the original computation?
A) mean and standard deviation
B) mean and median
C) range and median
D) mean and range
A) mean and standard deviation
B) mean and median
C) range and median
D) mean and range
Unlock Deck
Unlock for access to all 235 flashcards in this deck.
Unlock Deck
k this deck
9
Which of the following is NOT a measure of variability?
A) the variance
B) the standard deviation
C) the mean
D) the range
A) the variance
B) the standard deviation
C) the mean
D) the range
Unlock Deck
Unlock for access to all 235 flashcards in this deck.
Unlock Deck
k this deck
10
Which of the following is a property of a symmetric distribution?
A) The mean is greater than the median.
B) The mean and median are equal.
C) The mean is less than the median.
D) The mean is less than the mode.
A) The mean is greater than the median.
B) The mean and median are equal.
C) The mean is less than the median.
D) The mean is less than the mode.
Unlock Deck
Unlock for access to all 235 flashcards in this deck.
Unlock Deck
k this deck
11
If two data sets have the same range, which of the following characteristics do these data sets also share?
A) The distances from the smallest to the largest observations in both sets will be the same.
B) The smallest and largest observations will be the same in both sets.
C) They will have the same variance.
D) They will have the same interquartile range.
A) The distances from the smallest to the largest observations in both sets will be the same.
B) The smallest and largest observations will be the same in both sets.
C) They will have the same variance.
D) They will have the same interquartile range.
Unlock Deck
Unlock for access to all 235 flashcards in this deck.
Unlock Deck
k this deck
12
Which of the following statements applies to this set of data values: 17, 15, 16, 14, 17, 18, and 22?
A) The mean, median, and mode are all equal.
B) Only the mean and median are equal.
C) Only the mean and mode are equal.
D) Only the median and mode are equal.
A) The mean, median, and mode are all equal.
B) Only the mean and median are equal.
C) Only the mean and mode are equal.
D) Only the median and mode are equal.
Unlock Deck
Unlock for access to all 235 flashcards in this deck.
Unlock Deck
k this deck
13
If a store manager selected a sample of customers and computed the mean income for this sample, what has he computed?
A) a parameter
B) a statistic
C) a qualitative value
D) a categorical value
A) a parameter
B) a statistic
C) a qualitative value
D) a categorical value
Unlock Deck
Unlock for access to all 235 flashcards in this deck.
Unlock Deck
k this deck
14
A sample of 26 observations has a standard deviation of 4. What is the sum of the squared deviations from the sample mean?
A) 21
B) 25
C) 100
D) 400
A) 21
B) 25
C) 100
D) 400
Unlock Deck
Unlock for access to all 235 flashcards in this deck.
Unlock Deck
k this deck
15
Consider this data set: 5, 6, 7, 11, and 15. Which of the following values equals its mean?
A) 7.0
B) 7.1
C) 8.1
D) 8.8
A) 7.0
B) 7.1
C) 8.1
D) 8.8
Unlock Deck
Unlock for access to all 235 flashcards in this deck.
Unlock Deck
k this deck
16
In a histogram, what may be said of the proportion of the total area that must be to the right of the mean?
A) It is less than 0.50 if the distribution is skewed to the left.
B) It is always exactly 0.50.
C) It is more than 0.50 if the distribution is skewed to the right.
D) It is exactly 0.50 only if the distribution is symmetric.
A) It is less than 0.50 if the distribution is skewed to the left.
B) It is always exactly 0.50.
C) It is more than 0.50 if the distribution is skewed to the right.
D) It is exactly 0.50 only if the distribution is symmetric.
Unlock Deck
Unlock for access to all 235 flashcards in this deck.
Unlock Deck
k this deck
17
Which of the following can be used to summarize data about qualitative variables?
A) measures of centre
B) measures of variability
C) proportions
D) measures of relative standing
A) measures of centre
B) measures of variability
C) proportions
D) measures of relative standing
Unlock Deck
Unlock for access to all 235 flashcards in this deck.
Unlock Deck
k this deck
18
Which of the following refers to numbers that indicate the spread or scatter of observations in a data set?
A) measures of centre
B) measures of location
C) measures of variability
D) measures of shape
A) measures of centre
B) measures of location
C) measures of variability
D) measures of shape
Unlock Deck
Unlock for access to all 235 flashcards in this deck.
Unlock Deck
k this deck
19
The average score for a class of 35 students was 70. The 20 male students in the class averaged 73. What was the average score for the 15 female students in the class?
A) 60
B) 66
C) 70
D) 73
A) 60
B) 66
C) 70
D) 73
Unlock Deck
Unlock for access to all 235 flashcards in this deck.
Unlock Deck
k this deck
20
Which of the following represents a disadvantage of using the sample range to measure dispersion?
A) It produces spreads that are not meaningful for data analysis.
B) The largest or smallest observation (or both) may be an outlier.
C) The sample range is not measured in the same units as the data.
D) The sample range is measured in the same units as the data.
A) It produces spreads that are not meaningful for data analysis.
B) The largest or smallest observation (or both) may be an outlier.
C) The sample range is not measured in the same units as the data.
D) The sample range is measured in the same units as the data.
Unlock Deck
Unlock for access to all 235 flashcards in this deck.
Unlock Deck
k this deck
21
Incomes of workers in an automobile company in Ontario are known to be right-skewed, with a mean equal to $36,200. Applying Tchebysheff's Theorem, at least 8/9 of all incomes are in the range of $29,600 to $42,800. What is the standard deviation of those incomes from that mean?
A) $2,200
B) $4,755
C) $6,500
D) $6,700
A) $2,200
B) $4,755
C) $6,500
D) $6,700
Unlock Deck
Unlock for access to all 235 flashcards in this deck.
Unlock Deck
k this deck
22
A university placement office conducted a survey of 100 engineers who had graduated from a local university. For these engineers, the mean salary was computed to be $72,000 with a standard deviation of $8,000. Which of the following best characterizes the percentage of these engineers who earn either more than $96,000 or less than $48,000?
A) approximately 2.3%
B) at least 5.6% (1/18 of the engineers)
C) at most 5.6% (1/18 of the engineers)
D) at most 11.1% (1/9 of the engineers)
A) approximately 2.3%
B) at least 5.6% (1/18 of the engineers)
C) at most 5.6% (1/18 of the engineers)
D) at most 11.1% (1/9 of the engineers)
Unlock Deck
Unlock for access to all 235 flashcards in this deck.
Unlock Deck
k this deck
23
The expression ; is recognizable as the formula for which of the following measures?
A) the sample variance, computed from ungrouped data
B) the population variance, computed from ungrouped data
C) the sample variance, computed from grouped data
D) the population variance, computed from grouped data
; is recognizable as the formula for which of the following measures?A) the sample variance, computed from ungrouped data
B) the population variance, computed from ungrouped data
C) the sample variance, computed from grouped data
D) the population variance, computed from grouped data
Unlock Deck
Unlock for access to all 235 flashcards in this deck.
Unlock Deck
k this deck
24
Which one of these values represents the upper quartile of the data set 10, 12, 16, 7, 9, 7, 41, and 14?
A) 7
B) 8
C) 15.5
D) 24
A) 7
B) 8
C) 15.5
D) 24
Unlock Deck
Unlock for access to all 235 flashcards in this deck.
Unlock Deck
k this deck
25
Which of the following summary measures is most affected by outliers?
A) the first quartile
B) the second quartile
C) the third quartile
D) the variance
A) the first quartile
B) the second quartile
C) the third quartile
D) the variance
Unlock Deck
Unlock for access to all 235 flashcards in this deck.
Unlock Deck
k this deck
26
You are given a distribution of measurements that is approximately mound-shaped. According to the Empirical Rule, what would be the approximate percentage of measurements in a data set that will fall within two standard deviations of their mean?
A) 99%
B) 95%
C) 90%
D) 68%
A) 99%
B) 95%
C) 90%
D) 68%
Unlock Deck
Unlock for access to all 235 flashcards in this deck.
Unlock Deck
k this deck
27
The distribution of actual volumes of tomato soup in 450 mL cans is thought to be bell-shaped, with a mean of 450 mL and a standard deviation equal to 8 mL. Based on this information, between what two values could we expect 95% of all cans to contain?
A) 430 and 470 mL
B) 432 and 468 mL
C) 434 and 466 mL
D) 440 and 460 mL
A) 430 and 470 mL
B) 432 and 468 mL
C) 434 and 466 mL
D) 440 and 460 mL
Unlock Deck
Unlock for access to all 235 flashcards in this deck.
Unlock Deck
k this deck
28
According to Tchebysheff's Theorem, which of the following bounds will delimit the fraction of observations falling within k (where ) standard deviations of the mean?
A) at most, 1 -
B) at least
C) at most, 1 -
D) at least 1 -
) standard deviations of the mean?A) at most, 1 -
B) at least
C) at most, 1 -
D) at least 1 -
Unlock Deck
Unlock for access to all 235 flashcards in this deck.
Unlock Deck
k this deck
29
Which of the following is a characteristic of a population mean?
A) It will always be larger than the mean of a sample selected from that population.
B) It will always be larger than the population median.
C) It will usually differ in value from the mean of a sample selected from that population.
D) It will always be smaller than the population median.
A) It will always be larger than the mean of a sample selected from that population.
B) It will always be larger than the population median.
C) It will usually differ in value from the mean of a sample selected from that population.
D) It will always be smaller than the population median.
Unlock Deck
Unlock for access to all 235 flashcards in this deck.
Unlock Deck
k this deck
30
Which of the following randomly selected measurements, x, might be considered a potential outlier if it were to be selected from the given population?
A) x = 0 from a population with= 0 and= 2
B) x = -5 from a population with= 1 and= 4
C) x = 7 from a population with= 3 and= 2
D) x = 4 from a population with= 0 and= 1
A) x = 0 from a population with= 0 and= 2
B) x = -5 from a population with= 1 and= 4
C) x = 7 from a population with= 3 and= 2
D) x = 4 from a population with= 0 and= 1
Unlock Deck
Unlock for access to all 235 flashcards in this deck.
Unlock Deck
k this deck
31
According to Tchebysheff's Theorem, what is the percentage of measurements in a data set that will fall within three standard deviations of the mean?
A) 16%
B) at least 68%
C) 75%
D) at least 89%
A) 16%
B) at least 68%
C) 75%
D) at least 89%
Unlock Deck
Unlock for access to all 235 flashcards in this deck.
Unlock Deck
k this deck
32
Which of the following is the most frequently used measure of variation?
A) the mean
B) the range
C) the variance
D) the standard deviation
A) the mean
B) the range
C) the variance
D) the standard deviation
Unlock Deck
Unlock for access to all 235 flashcards in this deck.
Unlock Deck
k this deck
33
Expressed in percentiles, how is the interquartile range defined?
A) It is the difference between the 20% and 70% values.
B) It is the difference between the 20% and 80% values.
C) It is the difference between the 25% and 75% values.
D) It is the difference between the 45% and 95% values.
A) It is the difference between the 20% and 70% values.
B) It is the difference between the 20% and 80% values.
C) It is the difference between the 25% and 75% values.
D) It is the difference between the 45% and 95% values.
Unlock Deck
Unlock for access to all 235 flashcards in this deck.
Unlock Deck
k this deck
34
Which of these values represents a lower quartile for the data set 23, 24, 21, and 20?
A) 20.25
B) 22.0
C) 22.5
D) 23.5
A) 20.25
B) 22.0
C) 22.5
D) 23.5
Unlock Deck
Unlock for access to all 235 flashcards in this deck.
Unlock Deck
k this deck
35
The lengths of screws produced by a machine are normally distributed, with a mean of 3 cm and a standard deviation of 0.2 cm. What can we conclude from this?
A) Approximately 68% of all screws have lengths between 2.8 and 3.2 cm.
B) Approximately 95% of all screws have lengths between 2.8 and 3.2 cm.
C) Just about all screws have lengths between 2.8 and 3.2 cm.
D) Just about all screws have lengths between 2.9 and 3.1 cm.
A) Approximately 68% of all screws have lengths between 2.8 and 3.2 cm.
B) Approximately 95% of all screws have lengths between 2.8 and 3.2 cm.
C) Just about all screws have lengths between 2.8 and 3.2 cm.
D) Just about all screws have lengths between 2.9 and 3.1 cm.
Unlock Deck
Unlock for access to all 235 flashcards in this deck.
Unlock Deck
k this deck
36
Scores on a chemistry exam were mound-shaped with a mean score of 90 and a standard deviation of 64. Scores on a statistics exam were also mound-shaped, with a mean score of 70 and a standard deviation of 16. A student who took both exams achieved a grade of 102 on the chemistry exam and a grade of 77 on the statistics exam. Which of these may be inferred from the information given?
A) The student did relatively better on the chemistry exam than on the statistics exam, compared to the other students in each class.
B) The student did relatively better on the statistics exam than on the chemistry exam, compared to the other students in the two classes.
C) The student's scores on both exams are similar when accounting for the scores of the other students in the two classes.
D) Without more information it is impossible to say which of the student's exam scores indicates the better performance.
Unlock Deck
Unlock for access to all 235 flashcards in this deck.
Unlock Deck
k this deck
37
The expression where is recognizable as the formula for which of the following measures?
A) the population mean, computed from ungrouped data
B) the sample mean, computed from ungrouped data
C) the population mean, computed from grouped data
D) the sample mean, computed from grouped data
where is recognizable as the formula for which of the following measures?A) the population mean, computed from ungrouped data
B) the sample mean, computed from ungrouped data
C) the population mean, computed from grouped data
D) the sample mean, computed from grouped data
Unlock Deck
Unlock for access to all 235 flashcards in this deck.
Unlock Deck
k this deck
38
Which of the following measures is NOT affected by extreme values in the data?
A) the mean
B) the median
C) the variance
D) the range
A) the mean
B) the median
C) the variance
D) the range
Unlock Deck
Unlock for access to all 235 flashcards in this deck.
Unlock Deck
k this deck
39
A sample of students who have taken a calculus test has a mean score of 78.2, a mode of 67, and a median score of 67. Based on this information, what may one deduce about the distribution of the test scores?
A) It is symmetric.
B) It is right-skewed.
C) It is left-skewed.
D) It is bimodal.
A) It is symmetric.
B) It is right-skewed.
C) It is left-skewed.
D) It is bimodal.
Unlock Deck
Unlock for access to all 235 flashcards in this deck.
Unlock Deck
k this deck
40
Suppose that a particular statistical population can be described, at least roughly, by the normal curve. Which of the following can we use to estimate the percentages of all population values that lie within specified numbers of standard deviations from the mean?
A) Tchebysheff's Theorem
B) the Empirical Rule
C) the interquartile range
D) a box plot
A) Tchebysheff's Theorem
B) the Empirical Rule
C) the interquartile range
D) a box plot
Unlock Deck
Unlock for access to all 235 flashcards in this deck.
Unlock Deck
k this deck
41
A sample of 600 values produced the following summary statistics: and Given this information, which of the following values constitutes the lower fence on a box plot?
A) -4.60
B) 26.80
C) 75.80
D) 102.60
and Given this information, which of the following values constitutes the lower fence on a box plot?A) -4.60
B) 26.80
C) 75.80
D) 102.60
Unlock Deck
Unlock for access to all 235 flashcards in this deck.
Unlock Deck
k this deck
42
A sample of 50 values produced the following summary statistics: and Based on this information, what are the left and right ends, respectively, of the box plot using whiskers?
A) 5.3 and 32.0
B) 10 and 14.6
C) 10 and 16.7
D) 14.6 and 16.7
and Based on this information, what are the left and right ends, respectively, of the box plot using whiskers?A) 5.3 and 32.0
B) 10 and 14.6
C) 10 and 16.7
D) 14.6 and 16.7
Unlock Deck
Unlock for access to all 235 flashcards in this deck.
Unlock Deck
k this deck
43
Jessica has been keeping track of what she spends to eat out. Last week's expenditures for meals eaten out were $15.69, $15.95, $16.19, $20.91, $17.49, $24.53, and $17.66. The mean amount Jessica spends on meals is $18.35.
Unlock Deck
Unlock for access to all 235 flashcards in this deck.
Unlock Deck
k this deck
44
Numerical descriptive measures computed from sample measurements are called statistics.
Unlock Deck
Unlock for access to all 235 flashcards in this deck.
Unlock Deck
k this deck
45
If a data set has 15 values that have been sorted in ascending order, which value in the data set will be at the 25th percentile?
A) the fourth value
B) the third value
C) the second value
D) the first value
A) the fourth value
B) the third value
C) the second value
D) the first value
Unlock Deck
Unlock for access to all 235 flashcards in this deck.
Unlock Deck
k this deck
46
A student scores 89, 75, 94, and 88 on four exams during the semester and 97 on the final exam. If the final is weighted double and the four others weighted equally, the student's final average would be 90.
Unlock Deck
Unlock for access to all 235 flashcards in this deck.
Unlock Deck
k this deck
47
Lily's score on her biochemistry text placed her at the 97th percentile. What does this mean?
A) Lily's score has a z-score of 0.97.
B) Lily was in the bottom 3% of the students who took the test.
C) Lily scored as high as or higher than 97% of the students who took the test.
D) Lily's score has a z-score of -0.97.
A) Lily's score has a z-score of 0.97.
B) Lily was in the bottom 3% of the students who took the test.
C) Lily scored as high as or higher than 97% of the students who took the test.
D) Lily's score has a z-score of -0.97.
Unlock Deck
Unlock for access to all 235 flashcards in this deck.
Unlock Deck
k this deck
48
The mode of a data set or a distribution of measurements, if it exists, is unique.
Unlock Deck
Unlock for access to all 235 flashcards in this deck.
Unlock Deck
k this deck
49
Numerical descriptive measures computed from population measurements are called parameters.
Unlock Deck
Unlock for access to all 235 flashcards in this deck.
Unlock Deck
k this deck
50
Two classes, one with 15 students and the other with 25 students, took the same test and averaged 85 points and 75 points, respectively. If the two classes were combined, the overall average score of the 40 students would be 80 points.
Unlock Deck
Unlock for access to all 235 flashcards in this deck.
Unlock Deck
k this deck
51
The following summary statistics were computed from a sample of size 250: and Given this information, which of the following statements is correct?
A) The distribution of the data is slightly right-skewed.
B) The distribution of the data is symmetric.
C) A data value of 1 is an outlier.
D) A data value of 25 is an outlier.
and Given this information, which of the following statements is correct?A) The distribution of the data is slightly right-skewed.
B) The distribution of the data is symmetric.
C) A data value of 1 is an outlier.
D) A data value of 25 is an outlier.
Unlock Deck
Unlock for access to all 235 flashcards in this deck.
Unlock Deck
k this deck
52
When data have been grouped (as in a frequency table, a relative frequency histogram, etc.), the class with the highest frequency is called the modal class, and the midpoint of that class is taken to be the mode.
Unlock Deck
Unlock for access to all 235 flashcards in this deck.
Unlock Deck
k this deck
53
What percentage of all observations in a data set lie between the 30th percentile and the third quartile?
A) 30%
B) 45%
C) 75%
D) 79%
A) 30%
B) 45%
C) 75%
D) 79%
Unlock Deck
Unlock for access to all 235 flashcards in this deck.
Unlock Deck
k this deck
54
If, from a set of data, the sample mean was found to be 15 but the sample median was only 9, then the data set would be said to be skewed to the right.
was found to be 15 but the sample median was only 9, then the data set would be said to be skewed to the right. Unlock Deck
Unlock for access to all 235 flashcards in this deck.
Unlock Deck
k this deck
55
The mode is generally used to describe large data sets.
Unlock Deck
Unlock for access to all 235 flashcards in this deck.
Unlock Deck
k this deck
56
If the distribution of sales is thought to be symmetric with very little variation, then what may one conclude about the box plot that represents the data set?
A) The whiskers on a box plot the box should be about half as long as the box is wide.
B) The width of the box will be very wide but the whiskers will be very short.
C) The left and right edges will be approximately at equal distance from the second quartile.
D) The width of the box will be very short, but the whiskers will be very long.
Unlock Deck
Unlock for access to all 235 flashcards in this deck.
Unlock Deck
k this deck
57
Which of the following describes a graphical device that displays the highest and lowest values in a data set, as well as the upper quartile, the middle value, and the lower quartile?
A) a box plot
B) a five-number summary
C) a dotplot
D) a stem-and-leaf plot
A) a box plot
B) a five-number summary
C) a dotplot
D) a stem-and-leaf plot
Unlock Deck
Unlock for access to all 235 flashcards in this deck.
Unlock Deck
k this deck
58
In a mound-shaped distribution, there is no difference in the values of the mean and the median.
Unlock Deck
Unlock for access to all 235 flashcards in this deck.
Unlock Deck
k this deck
59
A sample of 600 values produced the following summary statistics: and Given this information, which of the following values is the upper fence on a box plot of this data set?
A) -4.60
B) 26.80
C) 75.80
D) 102.60
and Given this information, which of the following values is the upper fence on a box plot of this data set?A) -4.60
B) 26.80
C) 75.80
D) 102.60
Unlock Deck
Unlock for access to all 235 flashcards in this deck.
Unlock Deck
k this deck
60
A data sample has a mean of 87 and a median of 117. The distribution of the data is positively skewed.
Unlock Deck
Unlock for access to all 235 flashcards in this deck.
Unlock Deck
k this deck
61
In all cases, the sum of the deviations of the measurements from their mean is 0.
Unlock Deck
Unlock for access to all 235 flashcards in this deck.
Unlock Deck
k this deck
62
The sample variance is approximately the average of the squared deviations of the measurements from their mean.
Unlock Deck
Unlock for access to all 235 flashcards in this deck.
Unlock Deck
k this deck
63
The value of the standard deviation will always exceed that of the variance.
Unlock Deck
Unlock for access to all 235 flashcards in this deck.
Unlock Deck
k this deck
64
The median is a measure of centre that divides an ordered array of data into two halves. If the data are arranged in ascending order from smallest to largest, all the observations below the median are smaller than or equal to it, while all the observations above the median are larger than or equal to it.
Unlock Deck
Unlock for access to all 235 flashcards in this deck.
Unlock Deck
k this deck
65
The value of the mean times the number of observations equals the sum of all of the observations.
Unlock Deck
Unlock for access to all 235 flashcards in this deck.
Unlock Deck
k this deck
66
The standard deviation is the positive square root of the variance.
Unlock Deck
Unlock for access to all 235 flashcards in this deck.
Unlock Deck
k this deck
67
The standard deviation is expressed in terms of the original units of measurement, but the variance is not.
Unlock Deck
Unlock for access to all 235 flashcards in this deck.
Unlock Deck
k this deck
68
In a histogram, the proportion of the total area that must be to the left of the median is less than 0.50 if the distribution is skewed to the left.
Unlock Deck
Unlock for access to all 235 flashcards in this deck.
Unlock Deck
k this deck
69
In order to measure the variability in the same units as the original observations, we compute the sample variance.
Unlock Deck
Unlock for access to all 235 flashcards in this deck.
Unlock Deck
k this deck
70
The mode is the sum of a data set's minimum and maximum values, divided by 2.
Unlock Deck
Unlock for access to all 235 flashcards in this deck.
Unlock Deck
k this deck
71
The sample variance calculated with a divisor of n gives a better estimate of the population variance, 2, than does the sample variance, s2, with a divisor of n - 1.
Unlock Deck
Unlock for access to all 235 flashcards in this deck.
Unlock Deck
k this deck
72
Measures of centre are values around which observations tend to cluster and which describe the location of what, in some sense, might be called the "centre" of a data set.
Unlock Deck
Unlock for access to all 235 flashcards in this deck.
Unlock Deck
k this deck
73
A sample of 20 observations has a standard deviation of 4. The sum of the squared deviations from the sample mean is 320.
Unlock Deck
Unlock for access to all 235 flashcards in this deck.
Unlock Deck
k this deck
74
The mean is one of the most frequently used measures of variability.
Unlock Deck
Unlock for access to all 235 flashcards in this deck.
Unlock Deck
k this deck
75
Measures of variability describe typical values in the data.
Unlock Deck
Unlock for access to all 235 flashcards in this deck.
Unlock Deck
k this deck
76
The value of the standard deviation may be either positive or negative, while the value of the variance will always be positive or zero.
Unlock Deck
Unlock for access to all 235 flashcards in this deck.
Unlock Deck
k this deck
77
If the variability of a set of data is very small, then the sample variance may be negative.
Unlock Deck
Unlock for access to all 235 flashcards in this deck.
Unlock Deck
k this deck
78
The range is considered the weakest measure of variability.
Unlock Deck
Unlock for access to all 235 flashcards in this deck.
Unlock Deck
k this deck
79
The larger the values of the sample variance, , and the sample standard deviation, s, the greater the variability in the data.
, and the sample standard deviation, s, the greater the variability in the data. Unlock Deck
Unlock for access to all 235 flashcards in this deck.
Unlock Deck
k this deck
80
When all the numbers in the data set are the same, the standard deviation, s, must be zero.
Unlock Deck
Unlock for access to all 235 flashcards in this deck.
Unlock Deck
k this deck
Unlock Deck
Unlock for access to all 235 flashcards in this deck.


