Deck 9: The Is Curve
Full screen (f)
Question
Question
Question
Question
Question
Question
Question
Question
Question
Question
Question
Question
Question
Question
Question
Question
Question
Question
Question
Question
Question
Question
Question
Question
Table 1
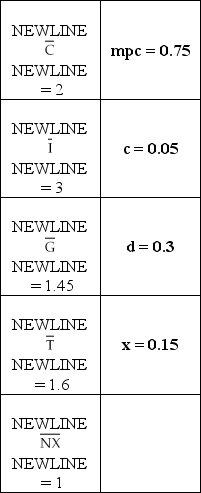
Given the values in the table above, equilibrium output Y = ________ when the real interest rate r = 4.
A) 26.6
B) 0.65
C) 17
D) 5.65
E) none of the above
Given the values in the table above, equilibrium output Y = ________ when the real interest rate r = 4.
A) 26.6
B) 0.65
C) 17
D) 5.65
E) none of the above
Question
Table 1
Given the values in the table above, if the real interest rate rises from 5 to 6, the change in household saving is ________.
A) negative 0.5
B) negative 1.55
C) negative 0.45
D) 1.55
E) none of the above
Given the values in the table above, if the real interest rate rises from 5 to 6, the change in household saving is ________.
A) negative 0.5
B) negative 1.55
C) negative 0.45
D) 1.55
E) none of the above
Question
Question
Table 1
Given the values in the table above, the IS curve is ________.
A) Y = 34.6 - 2r
B) Y = 8.65 - 2r
C) Y = 25 - 2r
D) Y = 8.33 - 0.67r
E) none of the above
Given the values in the table above, the IS curve is ________.
A) Y = 34.6 - 2r
B) Y = 8.65 - 2r
C) Y = 25 - 2r
D) Y = 8.33 - 0.67r
E) none of the above
Question
Question
Question
Question
Question
Question
IS Graph 1 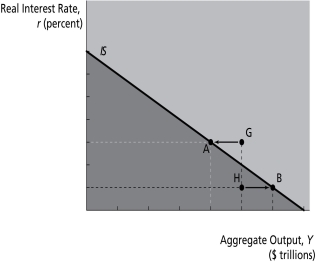
On the graph above, assuming that G = 0 and NX = 0, saving is above planned investment at point ________.
A) A
B) B
C) G
D) H
E) none of the above
On the graph above, assuming that G = 0 and NX = 0, saving is above planned investment at point ________.
A) A
B) B
C) G
D) H
E) none of the above
Question
Question
Question
Question
Question
Table 1
Given the values in the table above, the real interest rate r = ________ when equilibrium output Y = 15.
A) 9.8
B) 5
C) 3.18
D) 10
E) none of the above
Given the values in the table above, the real interest rate r = ________ when equilibrium output Y = 15.
A) 9.8
B) 5
C) 3.18
D) 10
E) none of the above
Question
Table 1
Given the values in the table above, consumption is ________ when equilibrium output is 15.
A) 12.3
B) 11.8
C) 12.05
D) 11.55
E) none of the above
Given the values in the table above, consumption is ________ when equilibrium output is 15.
A) 12.3
B) 11.8
C) 12.05
D) 11.55
E) none of the above
Question
IS Graph 1
On the graph above, output is above planned expenditures at point ________.
A) A
B) B
C) G
D) H
E) none of the above
On the graph above, output is above planned expenditures at point ________.
A) A
B) B
C) G
D) H
E) none of the above
Question
Question
IS Graph 1
On the graph above, assuming that G = 0 and NX = 0, the labeled point at which saving is lowest is point ________.
A) A
B) B
C) G
D) H
E) not inferable from the information given
On the graph above, assuming that G = 0 and NX = 0, the labeled point at which saving is lowest is point ________.
A) A
B) B
C) G
D) H
E) not inferable from the information given
Question
Question
Question
Question
Question
Question
Question
Question
Question
Question
Question
IS Graph 1
On the graph above, the labeled point at which investment -- planned plus unplanned -- is highest is point ________.
A) A
B) B
C) G
D) H
E) not inferable from the information given
On the graph above, the labeled point at which investment -- planned plus unplanned -- is highest is point ________.
A) A
B) B
C) G
D) H
E) not inferable from the information given
Question
IS Graph 1
On the graph above, unplanned inventory investment is negative at point ________.
A) A
B) B
C) G
D) H
E) none of the above
On the graph above, unplanned inventory investment is negative at point ________.
A) A
B) B
C) G
D) H
E) none of the above
Question
Question
Question
Question
Table 2
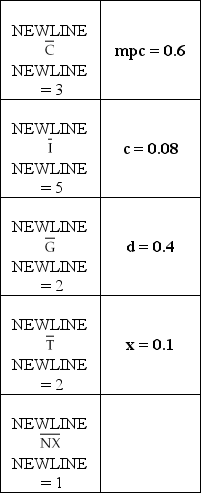
Using the values in the table above, and assuming that the real interest rate equals 4, calculate equilibrium values for consumption, household saving, investment, and net exports. Use these values to confirm that the goods market is in equilibrium.
Using the values in the table above, and assuming that the real interest rate equals 4, calculate equilibrium values for consumption, household saving, investment, and net exports. Use these values to confirm that the goods market is in equilibrium.
Question
Question
Question
Question
Question
Question
IS Graph 2 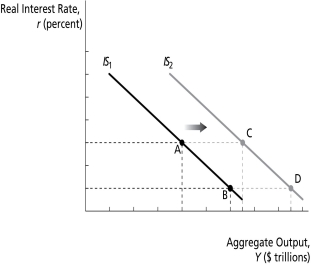
On the graph above, a possible cause of the rightward shift of the IS curve is an increase in ________.
A) foreign demand for domestic goods
B) taxes
C) domestic demand for foreign goods
D) the exchange rate
E) none of the above
On the graph above, a possible cause of the rightward shift of the IS curve is an increase in ________.
A) foreign demand for domestic goods
B) taxes
C) domestic demand for foreign goods
D) the exchange rate
E) none of the above
Question
IS Graph 2
On the graph above, if the economy is at point A when the real interest rate falls, the economy's new situation might be indicated by point ________.
A) A
B) B
C) C
D) D
E) none of the above
On the graph above, if the economy is at point A when the real interest rate falls, the economy's new situation might be indicated by point ________.
A) A
B) B
C) C
D) D
E) none of the above
Question
Question
Question
IS Graph 2
On the graph above, the amount of inventory depletion will be greatest if the economy is moving from point ________ to point ________.
A) A; D
B) D; A
C) D; C
D) B; A
E) B; C
On the graph above, the amount of inventory depletion will be greatest if the economy is moving from point ________ to point ________.
A) A; D
B) D; A
C) D; C
D) B; A
E) B; C
Question
IS Graph 2
On the graph above, if the U.S. economy is at point B in 2009, then the economy in 2010 is best represented by point ________.
A) A
B) B
C) C
D) D
E) any of the labeled points is as good as the others
On the graph above, if the U.S. economy is at point B in 2009, then the economy in 2010 is best represented by point ________.
A) A
B) B
C) C
D) D
E) any of the labeled points is as good as the others
Question
Question
Question
IS Graph 2
On the graph above, unplanned inventory investment occurs if the economy is moving from point ________ to point ________.
A) D; C
B) C; B
C) B; A
D) all of the above
E) none of the above
On the graph above, unplanned inventory investment occurs if the economy is moving from point ________ to point ________.
A) D; C
B) C; B
C) B; A
D) all of the above
E) none of the above
Question
Question
Question
Question
Question
Question
Question
Question

Unlock Deck
Sign up to unlock the cards in this deck!
Unlock Deck
Unlock Deck
1/86
Play
Full screen (f)
Deck 9: The Is Curve
1
When the U.S. real interest rate rises ________.
A) U.S. dollar assets earn a lower return relative to foreign assets
B) makes U.S. exports more expensive in foreign currencies
C) imports will decrease
D) all of the above
E) none of the above
A) U.S. dollar assets earn a lower return relative to foreign assets
B) makes U.S. exports more expensive in foreign currencies
C) imports will decrease
D) all of the above
E) none of the above
makes U.S. exports more expensive in foreign currencies
2
Total planned expenditure (equals income) is 13,500, autonomous consumption expenditure is 600, the marginal propensity to consume is 0.8, government purchases are 2,700, taxes are 2,500 and planned investment spending is 2,900. Net exports is ________.
A) 3,840
B) negative 1,500
C) negative 1,380
D) negative 1,340
E) 2,100
A) 3,840
B) negative 1,500
C) negative 1,380
D) negative 1,340
E) 2,100
negative 1,500
3
Total aggregate demand includes ________.
A) planned investment spending
B) consumption expenditures
C) net exports
D) all of the above
E) none of the above
A) planned investment spending
B) consumption expenditures
C) net exports
D) all of the above
E) none of the above
all of the above
4
Planned investment spending ________.
A) is equal to planned fixed investment spending plus government investment
B) is unrelated to the real interest rate
C) is heavily influenced by expectations about the future
D) all of the above
E) none of the above
A) is equal to planned fixed investment spending plus government investment
B) is unrelated to the real interest rate
C) is heavily influenced by expectations about the future
D) all of the above
E) none of the above
Unlock Deck
Unlock for access to all 86 flashcards in this deck.
Unlock Deck
k this deck
5
An increase in the real interest rate will cause an increase in ________.
A) saving
B) planned investment
C) net exports
D) all of the above
E) none of the above
A) saving
B) planned investment
C) net exports
D) all of the above
E) none of the above
Unlock Deck
Unlock for access to all 86 flashcards in this deck.
Unlock Deck
k this deck
6
The consumption function shows how ________.
A) the marginal propensity to consume varies with disposable income
B) income varies as a result of changes in consumption
C) consumption depends on the decision to save
D) all of the above
E) none of the above
A) the marginal propensity to consume varies with disposable income
B) income varies as a result of changes in consumption
C) consumption depends on the decision to save
D) all of the above
E) none of the above
Unlock Deck
Unlock for access to all 86 flashcards in this deck.
Unlock Deck
k this deck
7
When the U.S. real interest rate falls ________.
A) U.S. dollar assets earn a higher return relative to foreign assets
B) it makes U.S. exports more expensive in foreign currencies
C) imports will decrease
D) all of the above
E) none of the above
A) U.S. dollar assets earn a higher return relative to foreign assets
B) it makes U.S. exports more expensive in foreign currencies
C) imports will decrease
D) all of the above
E) none of the above
Unlock Deck
Unlock for access to all 86 flashcards in this deck.
Unlock Deck
k this deck
8
Consumption expenditure is 15,000, government purchases are 5,000, planned investment spending is 4,000 and net exports are 1,500. If total output is 25,000, then unplanned inventory investment is ________.
A) negative 500
B) 2,500
C) 3,500
D) 4,000
E) negative 450
A) negative 500
B) 2,500
C) 3,500
D) 4,000
E) negative 450
Unlock Deck
Unlock for access to all 86 flashcards in this deck.
Unlock Deck
k this deck
9
Planned expenditures ________.
A) are directly affected by government purchases
B) increase when there is a reduction in taxes
C) decrease when disposable income decreases
D) all of the above
E) none of the above
A) are directly affected by government purchases
B) increase when there is a reduction in taxes
C) decrease when disposable income decreases
D) all of the above
E) none of the above
Unlock Deck
Unlock for access to all 86 flashcards in this deck.
Unlock Deck
k this deck
10
An decrease in the real interest rate will cause an increase in ________.
A) consumption
B) planned investment
C) net exports
D) all of the above
E) none of the above
A) consumption
B) planned investment
C) net exports
D) all of the above
E) none of the above
Unlock Deck
Unlock for access to all 86 flashcards in this deck.
Unlock Deck
k this deck
11
When firms spend more on additional holdings of raw materials, parts and finished goods ________.
A) they are increasing their fixed investment
B) they are increasing their inventory investment
C) they are increasing their private consumption
D) all of the above
E) none of the above
A) they are increasing their fixed investment
B) they are increasing their inventory investment
C) they are increasing their private consumption
D) all of the above
E) none of the above
Unlock Deck
Unlock for access to all 86 flashcards in this deck.
Unlock Deck
k this deck
12
Fixed investment is typically ________.
A) smaller than inventory investment
B) calculated as the change in holdings of raw materials and finished goods
C) planned spending on equipment, structures, and new residential housing
D) all of the above
E) none of the above
A) smaller than inventory investment
B) calculated as the change in holdings of raw materials and finished goods
C) planned spending on equipment, structures, and new residential housing
D) all of the above
E) none of the above
Unlock Deck
Unlock for access to all 86 flashcards in this deck.
Unlock Deck
k this deck
13
What is the meaning of "animal spirits"? How do these relate to planned investment spending and to unplanned investment spending?
Unlock Deck
Unlock for access to all 86 flashcards in this deck.
Unlock Deck
k this deck
14
Investment spending ________.
A) is comprised of fixed and inventory investment
B) is negatively related to the real interest rate
C) is heavily influenced by what Keynes coined as "animal spirits"
D) all of the above
E) none of the above
A) is comprised of fixed and inventory investment
B) is negatively related to the real interest rate
C) is heavily influenced by what Keynes coined as "animal spirits"
D) all of the above
E) none of the above
Unlock Deck
Unlock for access to all 86 flashcards in this deck.
Unlock Deck
k this deck
15
When the U.S. real interest rate rises ________.
A) U.S. dollar assets earn a higher return relative to foreign assets
B) makes U.S. exports cheaper in foreign currencies
C) imports will decrease
D) all of the above
E) none of the above
A) U.S. dollar assets earn a higher return relative to foreign assets
B) makes U.S. exports cheaper in foreign currencies
C) imports will decrease
D) all of the above
E) none of the above
Unlock Deck
Unlock for access to all 86 flashcards in this deck.
Unlock Deck
k this deck
16
Planned investment spending ________.
A) is equal to planned fix investment spending plus the amount of inventory investment planned by firms
B) is closely related to the real interest rate
C) is heavily influenced by expectations about the future
D) all of the above
E) none of the above
A) is equal to planned fix investment spending plus the amount of inventory investment planned by firms
B) is closely related to the real interest rate
C) is heavily influenced by expectations about the future
D) all of the above
E) none of the above
Unlock Deck
Unlock for access to all 86 flashcards in this deck.
Unlock Deck
k this deck
17
Net exports ________.
A) are heavily determined by foreign demand for domestic goods
B) are heavily determined by domestic demand for domestic goods
C) are independent of domestic interest rate fluctuations
D) all of the above
E) none of the above
A) are heavily determined by foreign demand for domestic goods
B) are heavily determined by domestic demand for domestic goods
C) are independent of domestic interest rate fluctuations
D) all of the above
E) none of the above
Unlock Deck
Unlock for access to all 86 flashcards in this deck.
Unlock Deck
k this deck
18
Consumption expenditures decrease when ________.
A) the real interest rate falls
B) disposable income increases
C) autonomous consumption increases
D) all of the above
E) none of the above
A) the real interest rate falls
B) disposable income increases
C) autonomous consumption increases
D) all of the above
E) none of the above
Unlock Deck
Unlock for access to all 86 flashcards in this deck.
Unlock Deck
k this deck
19
If disposable income falls, consumption expenditure falls ________.
A) by an amount that depends on the real interest rate
B) so that planned expenditure remains constant
C) by an amount smaller than the decrease in disposable income
D) all of the above
E) none of the above
A) by an amount that depends on the real interest rate
B) so that planned expenditure remains constant
C) by an amount smaller than the decrease in disposable income
D) all of the above
E) none of the above
Unlock Deck
Unlock for access to all 86 flashcards in this deck.
Unlock Deck
k this deck
20
Total planned expenditure (equals total output) is 14,000 when autonomous consumption expenditure is 450. When autonomous consumption expenditure falls to 400, total planned expenditure (equals total output) is 13,800. The marginal propensity to consume is ________.
A) 0.89
B) 0.75
C) 0.99
D) 0.44
E) 0.03
A) 0.89
B) 0.75
C) 0.99
D) 0.44
E) 0.03
Unlock Deck
Unlock for access to all 86 flashcards in this deck.
Unlock Deck
k this deck
21
In the IS curve ________.
A) an increase in the interest rate constitutes an upward movement along the curve
B) an increase in aggregate consumption constitutes a downward movement along the curve
C) an increase in taxes constitutes a rightward shift of the curve
D) all of the above
E) none of the above
A) an increase in the interest rate constitutes an upward movement along the curve
B) an increase in aggregate consumption constitutes a downward movement along the curve
C) an increase in taxes constitutes a rightward shift of the curve
D) all of the above
E) none of the above
Unlock Deck
Unlock for access to all 86 flashcards in this deck.
Unlock Deck
k this deck
22
In the IS curve, if Y falls for any given level of the real interest rate ________.
A) consumption decreases
B) output increases
C) saving increases
D) all of the above
E) none of the above
A) consumption decreases
B) output increases
C) saving increases
D) all of the above
E) none of the above
Unlock Deck
Unlock for access to all 86 flashcards in this deck.
Unlock Deck
k this deck
23
In the IS curve, if Y falls for any given level of the real interest rate ________.
A) consumption increases
B) output increases
C) saving increases
D) all of the above
E) none of the above
A) consumption increases
B) output increases
C) saving increases
D) all of the above
E) none of the above
Unlock Deck
Unlock for access to all 86 flashcards in this deck.
Unlock Deck
k this deck
24
Table 1
Given the values in the table above, equilibrium output Y = ________ when the real interest rate r = 4.
A) 26.6
B) 0.65
C) 17
D) 5.65
E) none of the above
Given the values in the table above, equilibrium output Y = ________ when the real interest rate r = 4.
A) 26.6
B) 0.65
C) 17
D) 5.65
E) none of the above
Unlock Deck
Unlock for access to all 86 flashcards in this deck.
Unlock Deck
k this deck
25
Table 1
Given the values in the table above, if the real interest rate rises from 5 to 6, the change in household saving is ________.
A) negative 0.5
B) negative 1.55
C) negative 0.45
D) 1.55
E) none of the above
Given the values in the table above, if the real interest rate rises from 5 to 6, the change in household saving is ________.
A) negative 0.5
B) negative 1.55
C) negative 0.45
D) 1.55
E) none of the above
Unlock Deck
Unlock for access to all 86 flashcards in this deck.
Unlock Deck
k this deck
26
Acme Brands invested $5 million in 2010 on new equipment, spent $750 thousand to increase its inventory of intermediate components, and added $25 thousand to its inventory of finished goods. At year's end, the components inventory is found to be $200 thousand above its beginning-of-the- year level, and finished goods inventory is up $30 thousand over its starting level. Calculate planned investment, unplanned investment, and actual (total) investment.
Unlock Deck
Unlock for access to all 86 flashcards in this deck.
Unlock Deck
k this deck
27
Table 1
Given the values in the table above, the IS curve is ________.
A) Y = 34.6 - 2r
B) Y = 8.65 - 2r
C) Y = 25 - 2r
D) Y = 8.33 - 0.67r
E) none of the above
Given the values in the table above, the IS curve is ________.
A) Y = 34.6 - 2r
B) Y = 8.65 - 2r
C) Y = 25 - 2r
D) Y = 8.33 - 0.67r
E) none of the above
Unlock Deck
Unlock for access to all 86 flashcards in this deck.
Unlock Deck
k this deck
28
If aggregate output is below its equilibrium level ________.
A) there is an excess demand for goods
B) actual output is below planned expenditure
C) firms will tend to replenish their low inventories driving output up toward equilibrium
D) all of the above
E) none of the above
A) there is an excess demand for goods
B) actual output is below planned expenditure
C) firms will tend to replenish their low inventories driving output up toward equilibrium
D) all of the above
E) none of the above
Unlock Deck
Unlock for access to all 86 flashcards in this deck.
Unlock Deck
k this deck
29
The IS curve ________.
A) shows the relationship between aggregate output and the real interest rate when the goods market is in equilibrium
B) tells us that increases in autonomous consumption, investment, government purchases, or net exports raise output for any real interest rate
C) tells us that a decrease in taxes leads to increases in output for any given real interest rate
D) all of the above
E) none of the above
Unlock Deck
Unlock for access to all 86 flashcards in this deck.
Unlock Deck
k this deck
30
In the IS curve, if Y increases for any given level of the real interest rate ________.
A) consumption increases
B) output decreases
C) saving decreases
D) all of the above
E) none of the above
A) consumption increases
B) output decreases
C) saving decreases
D) all of the above
E) none of the above
Unlock Deck
Unlock for access to all 86 flashcards in this deck.
Unlock Deck
k this deck
31
The reason for the downward-sloping IS curve is that ________.
A) lower interest rates lead to higher saving and higher output
B) higher interest rates lead to higher saving and lower output
C) higher interest rates lead to lower saving and higher output
D) all of the above
E) none of the above
A) lower interest rates lead to higher saving and higher output
B) higher interest rates lead to higher saving and lower output
C) higher interest rates lead to lower saving and higher output
D) all of the above
E) none of the above
Unlock Deck
Unlock for access to all 86 flashcards in this deck.
Unlock Deck
k this deck
32
The reason for the downward-sloping IS curve is that ________.
A) lower interest rates lead to lower saving and lower output
B) lower interest rates lead to lower saving and higher output
C) higher interest rates lead to lower saving and higher output
D) all of the above
E) none of the above
A) lower interest rates lead to lower saving and lower output
B) lower interest rates lead to lower saving and higher output
C) higher interest rates lead to lower saving and higher output
D) all of the above
E) none of the above
Unlock Deck
Unlock for access to all 86 flashcards in this deck.
Unlock Deck
k this deck
33
IS Graph 1
On the graph above, assuming that G = 0 and NX = 0, saving is above planned investment at point ________.
A) A
B) B
C) G
D) H
E) none of the above
On the graph above, assuming that G = 0 and NX = 0, saving is above planned investment at point ________.
A) A
B) B
C) G
D) H
E) none of the above
Unlock Deck
Unlock for access to all 86 flashcards in this deck.
Unlock Deck
k this deck
34
The IS curve ________.
A) traces out the points at which the goods market is in equilibrium
B) tells us how consumption expenditures fall as the real interest rises
C) tells us that as the real interest rate rises planned expenditures go down leading to increases in savings that satisfy the goods market equilibrium
D) all of the above
E) none of the above
Unlock Deck
Unlock for access to all 86 flashcards in this deck.
Unlock Deck
k this deck
35
In the IS curve, a cut in taxes ________.
A) causes planned expenditures and hence equilibrium output to rise when the interest rate increases
B) causes planned expenditures and hence equilibrium output to fall when the interest rate increases
C) causes the equilibrium interest rates to fall
D) all of the above
E) none of the above
A) causes planned expenditures and hence equilibrium output to rise when the interest rate increases
B) causes planned expenditures and hence equilibrium output to fall when the interest rate increases
C) causes the equilibrium interest rates to fall
D) all of the above
E) none of the above
Unlock Deck
Unlock for access to all 86 flashcards in this deck.
Unlock Deck
k this deck
36
If aggregate output is above its equilibrium level ________.
A) there is an excess supply of goods
B) actual output is below planned expenditure
C) firms will tend to replenish their low inventories driving output up toward equilibrium
D) all of the above
E) none of the above
A) there is an excess supply of goods
B) actual output is below planned expenditure
C) firms will tend to replenish their low inventories driving output up toward equilibrium
D) all of the above
E) none of the above
Unlock Deck
Unlock for access to all 86 flashcards in this deck.
Unlock Deck
k this deck
37
The investment function implies that current output does not influence investment. Does that make sense?
Unlock Deck
Unlock for access to all 86 flashcards in this deck.
Unlock Deck
k this deck
38
Table 1
Given the values in the table above, the real interest rate r = ________ when equilibrium output Y = 15.
A) 9.8
B) 5
C) 3.18
D) 10
E) none of the above
Given the values in the table above, the real interest rate r = ________ when equilibrium output Y = 15.
A) 9.8
B) 5
C) 3.18
D) 10
E) none of the above
Unlock Deck
Unlock for access to all 86 flashcards in this deck.
Unlock Deck
k this deck
39
Table 1
Given the values in the table above, consumption is ________ when equilibrium output is 15.
A) 12.3
B) 11.8
C) 12.05
D) 11.55
E) none of the above
Given the values in the table above, consumption is ________ when equilibrium output is 15.
A) 12.3
B) 11.8
C) 12.05
D) 11.55
E) none of the above
Unlock Deck
Unlock for access to all 86 flashcards in this deck.
Unlock Deck
k this deck
40
IS Graph 1
On the graph above, output is above planned expenditures at point ________.
A) A
B) B
C) G
D) H
E) none of the above
On the graph above, output is above planned expenditures at point ________.
A) A
B) B
C) G
D) H
E) none of the above
Unlock Deck
Unlock for access to all 86 flashcards in this deck.
Unlock Deck
k this deck
41
In the text, the equivalence of the goods market equilibrium in the IS model to the equilibrium in which desired investment equals desired saving is demonstrated, assuming that both government purchases and net exports are zero. Demonstrate the equivalence when both G and NX are non-zero.
Unlock Deck
Unlock for access to all 86 flashcards in this deck.
Unlock Deck
k this deck
42
IS Graph 1
On the graph above, assuming that G = 0 and NX = 0, the labeled point at which saving is lowest is point ________.
A) A
B) B
C) G
D) H
E) not inferable from the information given
On the graph above, assuming that G = 0 and NX = 0, the labeled point at which saving is lowest is point ________.
A) A
B) B
C) G
D) H
E) not inferable from the information given
Unlock Deck
Unlock for access to all 86 flashcards in this deck.
Unlock Deck
k this deck
43
The 2009 fiscal stimulus package was passed ________.
A) to prevent the real interest rate from rising
B) to shift the IS curve to the left
C) to raise aggregate output at any interest rate
D) all of the above
E) none of the above
A) to prevent the real interest rate from rising
B) to shift the IS curve to the left
C) to raise aggregate output at any interest rate
D) all of the above
E) none of the above
Unlock Deck
Unlock for access to all 86 flashcards in this deck.
Unlock Deck
k this deck
44
The IS curve ________ when the real interest rate increases.
A) shifts to the right
B) shifts to the left
C) shifts up
D) all of the above
E) none of the above
A) shifts to the right
B) shifts to the left
C) shifts up
D) all of the above
E) none of the above
Unlock Deck
Unlock for access to all 86 flashcards in this deck.
Unlock Deck
k this deck
45
Qualitatively, an increase in government purchases has the same impact as an increase in autonomous ________.
A) consumption
B) investment
C) net exports
D) all of the above
E) none of the above
A) consumption
B) investment
C) net exports
D) all of the above
E) none of the above
Unlock Deck
Unlock for access to all 86 flashcards in this deck.
Unlock Deck
k this deck
46
The 2009 fiscal stimulus package did not work ________.
A) in that the IS curve did not shift to the right
B) because most of the intended increase in government spending took too long to kick in
C) because the increase in government spending was not enough to offset the decline in autonomous expenditure
D) all of the above
E) none of the above
A) in that the IS curve did not shift to the right
B) because most of the intended increase in government spending took too long to kick in
C) because the increase in government spending was not enough to offset the decline in autonomous expenditure
D) all of the above
E) none of the above
Unlock Deck
Unlock for access to all 86 flashcards in this deck.
Unlock Deck
k this deck
47
The IS curve shifts to the left when ________.
A) autonomous consumption increases
B) taxes decrease
C) autonomous investment decreases
D) all of the above
E) none of the above
A) autonomous consumption increases
B) taxes decrease
C) autonomous investment decreases
D) all of the above
E) none of the above
Unlock Deck
Unlock for access to all 86 flashcards in this deck.
Unlock Deck
k this deck
48
AAA
Unlock Deck
Unlock for access to all 86 flashcards in this deck.
Unlock Deck
k this deck
48
If the government cuts taxes ________.
A) disposable income falls
B) planned expenditures rise
C) the IS curve shifts to the left
D) all of the above
E) none of the above
A) disposable income falls
B) planned expenditures rise
C) the IS curve shifts to the left
D) all of the above
E) none of the above
Unlock Deck
Unlock for access to all 86 flashcards in this deck.
Unlock Deck
k this deck
49
If planned expenditure is below output, as the economy approaches equilibrium, ________.
A) planned expenditure is falling
B) output is rising
C) saving is rising
D) all of the above
E) none of the above
A) planned expenditure is falling
B) output is rising
C) saving is rising
D) all of the above
E) none of the above
Unlock Deck
Unlock for access to all 86 flashcards in this deck.
Unlock Deck
k this deck
50
If the government increases military spending ________.
A) the IS curve would shift to the left
B) output will decrease if interest rates remain fixed
C) the unemployment rate could fall
D) all of the above
E) none of the above
A) the IS curve would shift to the left
B) output will decrease if interest rates remain fixed
C) the unemployment rate could fall
D) all of the above
E) none of the above
Unlock Deck
Unlock for access to all 86 flashcards in this deck.
Unlock Deck
k this deck
51
If planned expenditure is below output, as the economy approaches equilibrium, ________.
A) planned expenditure is rising
B) output is rising
C) saving is rising
D) all of the above
E) none of the above
A) planned expenditure is rising
B) output is rising
C) saving is rising
D) all of the above
E) none of the above
Unlock Deck
Unlock for access to all 86 flashcards in this deck.
Unlock Deck
k this deck
52
IS Graph 1
On the graph above, the labeled point at which investment -- planned plus unplanned -- is highest is point ________.
A) A
B) B
C) G
D) H
E) not inferable from the information given
On the graph above, the labeled point at which investment -- planned plus unplanned -- is highest is point ________.
A) A
B) B
C) G
D) H
E) not inferable from the information given
Unlock Deck
Unlock for access to all 86 flashcards in this deck.
Unlock Deck
k this deck
53
IS Graph 1
On the graph above, unplanned inventory investment is negative at point ________.
A) A
B) B
C) G
D) H
E) none of the above
On the graph above, unplanned inventory investment is negative at point ________.
A) A
B) B
C) G
D) H
E) none of the above
Unlock Deck
Unlock for access to all 86 flashcards in this deck.
Unlock Deck
k this deck
54
If the government reduces spending ________.
A) the IS curve will shift to the right
B) output will increase if interest rates remain fixed
C) consumption will increase
D) all of the above
E) none of the above
A) the IS curve will shift to the right
B) output will increase if interest rates remain fixed
C) consumption will increase
D) all of the above
E) none of the above
Unlock Deck
Unlock for access to all 86 flashcards in this deck.
Unlock Deck
k this deck
55
The IS curve ________.
A) shifts to the right when autonomous consumption increases
B) shifts up when the real interest rate increases
C) shifts to the left when autonomous investment increases
D) all of the above
E) none of the above
A) shifts to the right when autonomous consumption increases
B) shifts up when the real interest rate increases
C) shifts to the left when autonomous investment increases
D) all of the above
E) none of the above
Unlock Deck
Unlock for access to all 86 flashcards in this deck.
Unlock Deck
k this deck
56
If the government raises taxes ________.
A) planned expenditures fall
B) equilibrium output falls
C) the IS curve shifts to the left
D) all of the above
E) none of the above
A) planned expenditures fall
B) equilibrium output falls
C) the IS curve shifts to the left
D) all of the above
E) none of the above
Unlock Deck
Unlock for access to all 86 flashcards in this deck.
Unlock Deck
k this deck
57
Table 2
Using the values in the table above, and assuming that the real interest rate equals 4, calculate equilibrium values for consumption, household saving, investment, and net exports. Use these values to confirm that the goods market is in equilibrium.
Using the values in the table above, and assuming that the real interest rate equals 4, calculate equilibrium values for consumption, household saving, investment, and net exports. Use these values to confirm that the goods market is in equilibrium.
Unlock Deck
Unlock for access to all 86 flashcards in this deck.
Unlock Deck
k this deck
58
The 2009 fiscal stimulus package did not work ________.
A) because rising interest rates nullified increased expenditures
B) because government spending rose too quickly and too briefly
C) but it probably prevented the IS curve from shifting further to the left
D) all of the above
E) none of the above
A) because rising interest rates nullified increased expenditures
B) because government spending rose too quickly and too briefly
C) but it probably prevented the IS curve from shifting further to the left
D) all of the above
E) none of the above
Unlock Deck
Unlock for access to all 86 flashcards in this deck.
Unlock Deck
k this deck
59
The IS curve shifts to the left when ________.
A) autonomous consumption increases
B) taxes increase
C) autonomous investment increases
D) all of the above
E) none of the above
A) autonomous consumption increases
B) taxes increase
C) autonomous investment increases
D) all of the above
E) none of the above
Unlock Deck
Unlock for access to all 86 flashcards in this deck.
Unlock Deck
k this deck
60
The IS curve shifts to the right when ________.
A) autonomous consumption decreases
B) taxes increase
C) autonomous investment increases
D) all of the above
E) none of the above
A) autonomous consumption decreases
B) taxes increase
C) autonomous investment increases
D) all of the above
E) none of the above
Unlock Deck
Unlock for access to all 86 flashcards in this deck.
Unlock Deck
k this deck
61
In the IS model, assuming that the real interest rate does not change, an increase in autonomous net exports causes total investment, planned plus unplanned, to ________.
A) fall, then rise back to its initial level
B) fall, then rise above its initial level
C) rise, then fall back to its initial level
D) all of the above
E) none of the above
A) fall, then rise back to its initial level
B) fall, then rise above its initial level
C) rise, then fall back to its initial level
D) all of the above
E) none of the above
Unlock Deck
Unlock for access to all 86 flashcards in this deck.
Unlock Deck
k this deck
62
A decrease in autonomous investment ________.
A) increases equilibrium output at any interest rate
B) causes a movement down along the IS curve
C) shifts the IS curve to the left
D) all of the above
E) none of the above
A) increases equilibrium output at any interest rate
B) causes a movement down along the IS curve
C) shifts the IS curve to the left
D) all of the above
E) none of the above
Unlock Deck
Unlock for access to all 86 flashcards in this deck.
Unlock Deck
k this deck
63
IS Graph 2
On the graph above, a possible cause of the rightward shift of the IS curve is an increase in ________.
A) foreign demand for domestic goods
B) taxes
C) domestic demand for foreign goods
D) the exchange rate
E) none of the above
On the graph above, a possible cause of the rightward shift of the IS curve is an increase in ________.
A) foreign demand for domestic goods
B) taxes
C) domestic demand for foreign goods
D) the exchange rate
E) none of the above
Unlock Deck
Unlock for access to all 86 flashcards in this deck.
Unlock Deck
k this deck
64
IS Graph 2
On the graph above, if the economy is at point A when the real interest rate falls, the economy's new situation might be indicated by point ________.
A) A
B) B
C) C
D) D
E) none of the above
On the graph above, if the economy is at point A when the real interest rate falls, the economy's new situation might be indicated by point ________.
A) A
B) B
C) C
D) D
E) none of the above
Unlock Deck
Unlock for access to all 86 flashcards in this deck.
Unlock Deck
k this deck
65
In the IS model, assuming that the real interest rate does not change, an increase in ________ leads to an increase in equilibrium saving by households.
A) autonomous investment
B) government purchases
C) autonomous net exports
D) all of the above
E) none of the above
A) autonomous investment
B) government purchases
C) autonomous net exports
D) all of the above
E) none of the above
Unlock Deck
Unlock for access to all 86 flashcards in this deck.
Unlock Deck
k this deck
66
In the IS model, assuming that the real interest rate does not change, an increase in autonomous ________ leads to a decrease in equilibrium saving.
A) investment
B) consumption
C) net exports
D) all of the above
E) none of the above
A) investment
B) consumption
C) net exports
D) all of the above
E) none of the above
Unlock Deck
Unlock for access to all 86 flashcards in this deck.
Unlock Deck
k this deck
67
IS Graph 2
On the graph above, the amount of inventory depletion will be greatest if the economy is moving from point ________ to point ________.
A) A; D
B) D; A
C) D; C
D) B; A
E) B; C
On the graph above, the amount of inventory depletion will be greatest if the economy is moving from point ________ to point ________.
A) A; D
B) D; A
C) D; C
D) B; A
E) B; C
Unlock Deck
Unlock for access to all 86 flashcards in this deck.
Unlock Deck
k this deck
68
IS Graph 2
On the graph above, if the U.S. economy is at point B in 2009, then the economy in 2010 is best represented by point ________.
A) A
B) B
C) C
D) D
E) any of the labeled points is as good as the others
On the graph above, if the U.S. economy is at point B in 2009, then the economy in 2010 is best represented by point ________.
A) A
B) B
C) C
D) D
E) any of the labeled points is as good as the others
Unlock Deck
Unlock for access to all 86 flashcards in this deck.
Unlock Deck
k this deck
69
An increase in autonomous investment ________.
A) increases equilibrium output at any interest rate
B) causes a movement down along the IS curve
C) shifts the IS curve to the left
D) all of the above
E) none of the above
A) increases equilibrium output at any interest rate
B) causes a movement down along the IS curve
C) shifts the IS curve to the left
D) all of the above
E) none of the above
Unlock Deck
Unlock for access to all 86 flashcards in this deck.
Unlock Deck
k this deck
70
In a stock market boom ________.
A) autonomous consumption might increase because stock holders might feel richer and consume more
B) autonomous investment might increase because a higher stock value for a firm helps firms raise funds for increased investment
C) the IS curve might shift to the right
D) all of the above
E) none of the above
Unlock Deck
Unlock for access to all 86 flashcards in this deck.
Unlock Deck
k this deck
71
IS Graph 2
On the graph above, unplanned inventory investment occurs if the economy is moving from point ________ to point ________.
A) D; C
B) C; B
C) B; A
D) all of the above
E) none of the above
On the graph above, unplanned inventory investment occurs if the economy is moving from point ________ to point ________.
A) D; C
B) C; B
C) B; A
D) all of the above
E) none of the above
Unlock Deck
Unlock for access to all 86 flashcards in this deck.
Unlock Deck
k this deck
72
In the IS model, assuming that the real interest rate does not change, an increase in ________ leads to an increase in equilibrium saving by households.
A) autonomous consumption
B) taxes
C) the price level
D) all of the above
E) none of the above
A) autonomous consumption
B) taxes
C) the price level
D) all of the above
E) none of the above
Unlock Deck
Unlock for access to all 86 flashcards in this deck.
Unlock Deck
k this deck
73
If people feel optimistic about the future of the economy ________.
A) autonomous consumption might increase
B) autonomous investment might increase
C) it might shift the IS curve to the right
D) all of the above
E) none of the above
A) autonomous consumption might increase
B) autonomous investment might increase
C) it might shift the IS curve to the right
D) all of the above
E) none of the above
Unlock Deck
Unlock for access to all 86 flashcards in this deck.
Unlock Deck
k this deck
74
In a stock market boom ________.
A) government spending will decrease
B) interest rates will decrease
C) saving is likely to decrease
D) all of the above
E) none of the above
A) government spending will decrease
B) interest rates will decrease
C) saving is likely to decrease
D) all of the above
E) none of the above
Unlock Deck
Unlock for access to all 86 flashcards in this deck.
Unlock Deck
k this deck
75
A decrease in autonomous investment ________.
A) decreases equilibrium output at any interest rate
B) lowers planned expenditures
C) shifts the IS curve to the left
D) all of the above
E) none of the above
A) decreases equilibrium output at any interest rate
B) lowers planned expenditures
C) shifts the IS curve to the left
D) all of the above
E) none of the above
Unlock Deck
Unlock for access to all 86 flashcards in this deck.
Unlock Deck
k this deck
76
A decrease in autonomous consumption ________.
A) lowers planned expenditures
B) raises equilibrium output for any level of the interest rate
C) causes a movement down along the IS curve
D) all of the above
E) none of the above
A) lowers planned expenditures
B) raises equilibrium output for any level of the interest rate
C) causes a movement down along the IS curve
D) all of the above
E) none of the above
Unlock Deck
Unlock for access to all 86 flashcards in this deck.
Unlock Deck
k this deck
77
An increase in autonomous consumption ________.
A) lowers planned expenditures
B) raises equilibrium output for any level of the interest rate
C) causes a movement down along the IS curve
D) all of the above
E) none of the above
A) lowers planned expenditures
B) raises equilibrium output for any level of the interest rate
C) causes a movement down along the IS curve
D) all of the above
E) none of the above
Unlock Deck
Unlock for access to all 86 flashcards in this deck.
Unlock Deck
k this deck
78
In the IS model, assuming that the real interest rate does not change, an increase in autonomous ________ leads to an increase in the equilibrium level of ________.
A) investment; consumption
B) consumption; investment
C) net exports; investment
D) all of the above
E) none of the above
A) investment; consumption
B) consumption; investment
C) net exports; investment
D) all of the above
E) none of the above
Unlock Deck
Unlock for access to all 86 flashcards in this deck.
Unlock Deck
k this deck
79
A decrease in autonomous consumption ________.
A) raises planned expenditures
B) lowers equilibrium output for any level of the interest rate
C) shifts the IS curve to the right
D) all of the above
E) none of the above
A) raises planned expenditures
B) lowers equilibrium output for any level of the interest rate
C) shifts the IS curve to the right
D) all of the above
E) none of the above
Unlock Deck
Unlock for access to all 86 flashcards in this deck.
Unlock Deck
k this deck
Unlock Deck
Unlock for access to all 86 flashcards in this deck.


