Deck 8: Probability Distributions and Statistics
Full screen (f)
Question
A coin is tossed four times. Let the random variable X denote the number of heads that occur. Let H denotes the outcome "heads" and T denotes the outcome "tails". Find the value assigned to each outcome of the experiment by the random variable X.
A)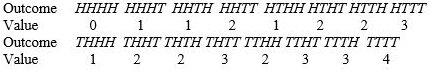
B)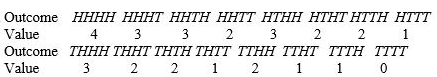
C)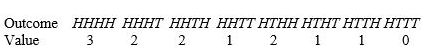
D)
A)
B)
C)
D)
Question
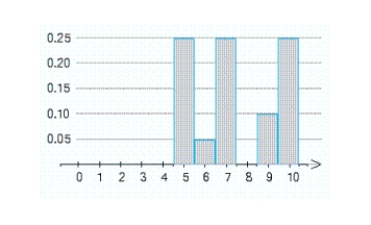
An examination consisting of ten true-or-false questions was taken by a class of 100 students. The probability distribution of the random variable X, where X denotes the number of questions answered correctly by a randomly chosen student, is represented by the accompanying histogram. The rectangle with base centered on the number 8 is missing. What should be the height of this rectangle? 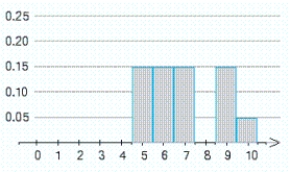
A) 0.35
B) 0.25
C) 0.4
D) 0.2
A) 0.35
B) 0.25
C) 0.4
D) 0.2
Question
Question
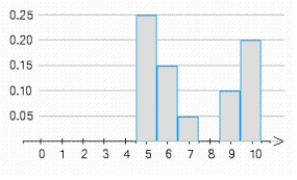
An examination consisting of ten true-or-false questions was taken by a class of 100 students. The probability distribution of the random variable X, where X denotes the number of questions answered correctly by a randomly chosen student, is represented by the accompanying histogram. The rectangle with base centered on the number 8 is missing. What should be the height of this rectangle? 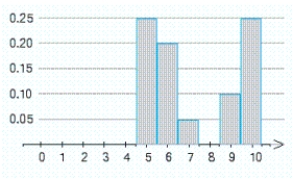
A) 0.15
B) 0.3
C) 0.25
D) 0.1
A) 0.15
B) 0.3
C) 0.25
D) 0.1
Question
Give the range of values that the random variable X may assume and classify the random variable as finite discrete, infinite discrete, or continuous.
X = The distance a commuter travels to work
A) . The random variable is infinite discrete.
B) . The random variable is continuous.
C) . The random variable is finite discrete.
X = The distance a commuter travels to work
A)
. The random variable is infinite discrete.B)
. The random variable is continuous.C)
. The random variable is finite discrete. Question
Question
The probability distribution of the random variable X is shown in the accompanying table:  Find
Find  ,
,  and
and  .
.
A)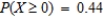


B)


C)


D)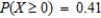


Find , and .A)
B)
C)
D)
Question
The probability distribution of the random variable X is shown in the accompanying table. 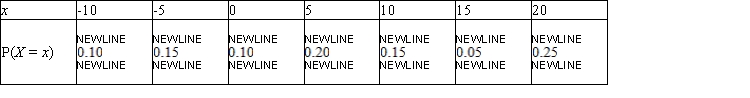
A) 0.35
B) 0.6
C) 0.55
D) 0.45
E) 0.3
A) 0.35
B) 0.6
C) 0.55
D) 0.45
E) 0.3
Question
Question
Let X denote the random variable that gives the sum of the faces that fall uppermost when two fair dice are cast. Find P ( X = 5 ).
A)
B)
C)
D)
A)
B)
C)
D)
Question
Question
Three cards are drawn from a well-shuffled deck of 52 playing cards. Let X denote the number of aces drawn. Find  .
.
A)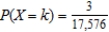
B)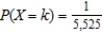
C)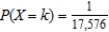
D)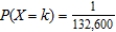
E)
. A)
B)
C)
D)
E)
Question
Give the range of values that the random variable X may assume and classify the random variable as finite discrete, infinite discrete, or continuous.
X = The number of hours a child watches television on a given day
A) , Finite Continuous
B) Any positive integer, Infinite discrete
C) , discrete
D) , Finite discrete
E) , Continuous
X = The number of hours a child watches television on a given day
A)
, Finite ContinuousB) Any positive integer, Infinite discrete
C)
, discreteD)
, Finite discreteE)
, Continuous Question
Question
Question
Question
An examination consisting of ten true-or-false questions was taken by a class of 100 students. The probability distribution of the random variable X, where X denotes the number of questions answered correctly by a randomly chosen student, is represented by the accompanying histogram. The rectangle with base centered on the number 8 is missing. What should be the height of this rectangle? 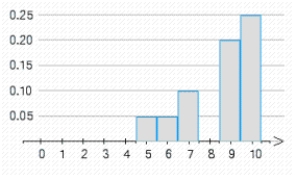
A) 0.3
B) 0.35
C) 0.45
D) 0.5
A) 0.3
B) 0.35
C) 0.45
D) 0.5
Question
Find the condition on the numbers a and b such that the table below gives the probability distribution of the random variable X. 
A)
B)
C)
D)
E)
A)
B)
C)
D)
E)
Question
Question
Determine whether the table gives the probability distribution of the random variable X. Explain your answer. 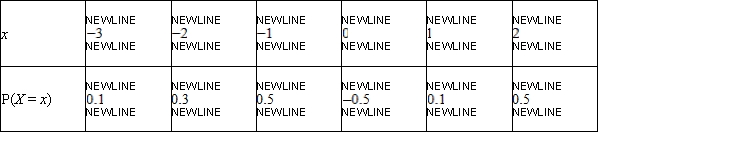
A) No, the sum of the probability assigned to the value of the random variable X is greater than 1.
B) No, the sum of the probability assigned to the value of the random variable X is not equal to 1.
C) No, the probability assigned to a value of the random variable X cannot be negative.
D) Yes, the sum of the probability assigned to the value of the random variable X is equal to 1.
E) No, the sum of the probability assigned to the value of the random variable X is less than 1.
Question
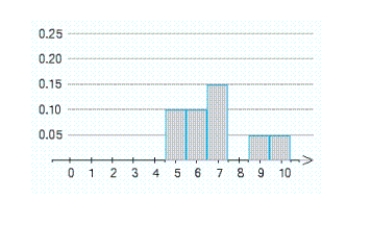
Suppose a probability distribution of a random variable X is represented by the accompanying histogram. Shade that part of the histogram whose area gives the probability  .
. 
A)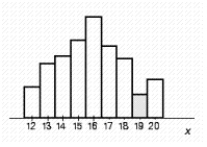
B)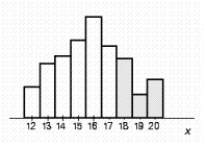
C)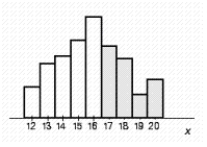
D)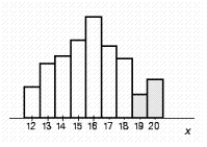
E)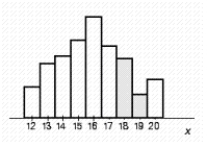
. A)
B)
C)
D)
E)
Question
An examination consisting of ten true-or-false questions was taken by a class of 100 students. The probability distribution of the random variable X, where X denotes the number of questions answered correctly by a randomly chosen student, is represented by the accompanying histogram. The rectangle with base centered on the number 8 is missing. What should be the height of this rectangle?
height = __________
height = __________
Question
Question
The probability distribution of the random variable X is shown in the accompanying table. 
Find the following, rounded to two decimal places, if necessary. __________
  __________
  __________
  __________
Find the following, rounded to two decimal places, if necessary.
__________ __________ __________ __________ Question
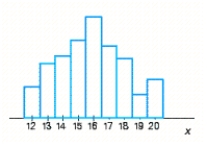
After the private screening of a new television pilot, audience members were asked to rate the new show on a scale of 1 to 10 (10 being the highest rating). From a group of 140 people, the accompanying responses were obtained. 
Let the random variable X denote the rating given to the show by a randomly chosen audience member. Find the probability distribution associated with these data. Round answer to the nearest thousandth.
A) 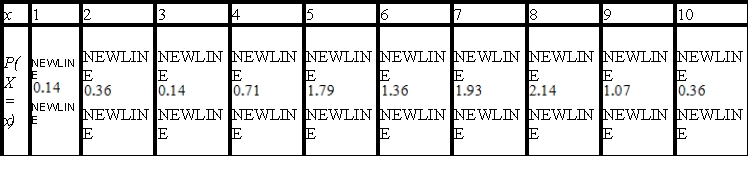
B) 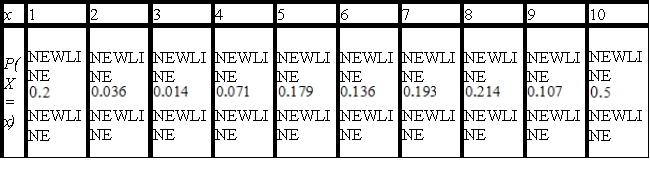
C) 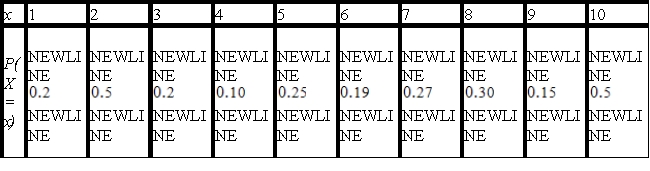
D) 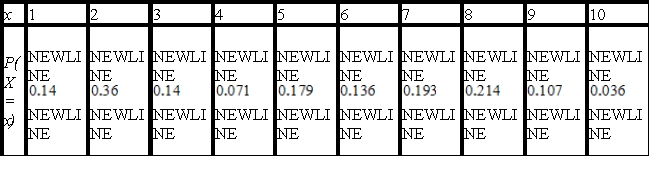
E) 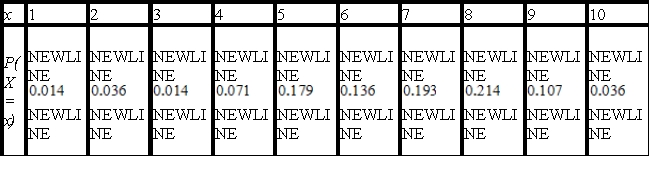
Let the random variable X denote the rating given to the show by a randomly chosen audience member. Find the probability distribution associated with these data. Round answer to the nearest thousandth.
A)
B)
C)
D)
E)
Question
The probability distribution of the random variable X is shown in the accompanying table.  Find the following, rounded to two decimal places if necessary.
  __________
  __________
  __________
Find the following, rounded to two decimal places if necessary. __________ __________ __________ Question
Question
Suppose a probability distribution of a random variable X is represented by the accompanying histogram. Shade that part of the histogram whose area gives the probability  .
. 
A) 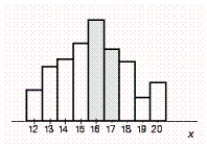
B)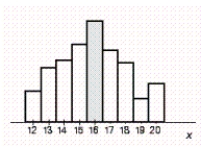
C)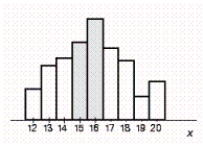
D)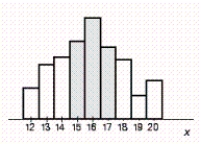
E)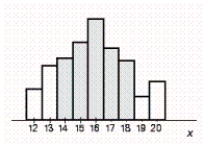
. A)
B)
C)
D)
E)
Question
Question
Four cards are drawn from a well-shuffled deck of 52 playing cards. Let X denote the number of aces drawn. Find  .
.
. Question
Question
Suppose a probability distribution of a random variable X is represented by the accompanying histogram. Shade that part of the histogram whose area gives the probability  .
. 
A) 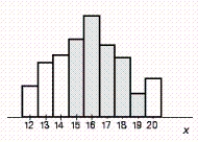
B)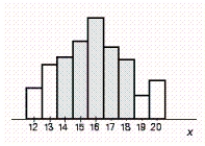
C)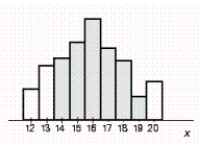
D)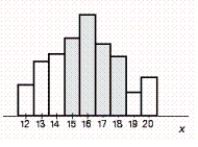
E)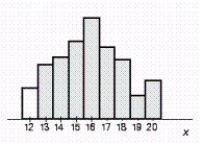
. A)
B)
C)
D)
E)
Question
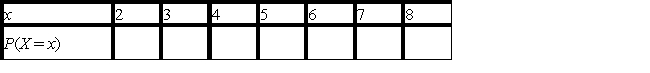
A survey was conducted by the Public Housing Authority in a certain community among 1,000 families to determine the distribution of families by size. The results follow. 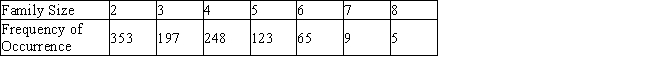 Find the probability distribution of the random variable X, where X denotes the number of persons in a randomly chosen family.


A) 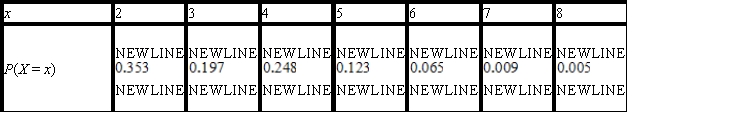
B) 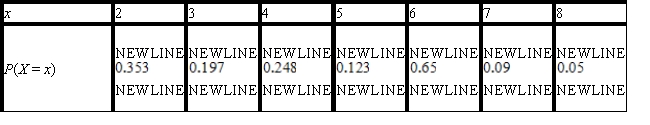
C) 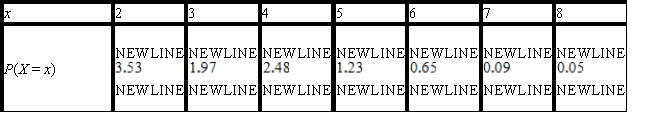
D) 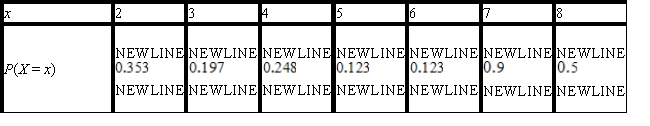
E) 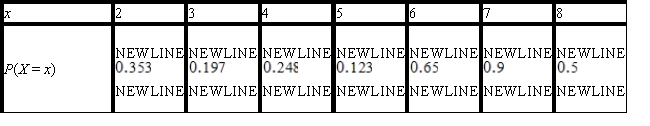
Find the probability distribution of the random variable X, where X denotes the number of persons in a randomly chosen family. A)
B)
C)
D)
E)
Question
Question
The rates paid by 30 financial institutions on a certain day for money market deposit accounts are shown in the accompanying table.  Let the random variable X denote the interest paid by a randomly chosen financial institution on its money market deposit accounts and find the probability distribution associated with these data.
Let the random variable X denote the interest paid by a randomly chosen financial institution on its money market deposit accounts and find the probability distribution associated with these data. Question
An examination consisting of ten true-or-false questions was taken by a class of 100 students. The probability distribution of the random variable X, where X denotes the number of questions answered correctly by a randomly chosen student, is represented by the accompanying histogram. The rectangle with base centered on the number 8 is missing. What should be the height of this rectangle?
height = __________
height = __________
Question
Question
Question
The following table gives the 2002 age distribution of U.S. population:  Let the random variable X denote a randomly chosen age group within the population. What percentage of the U.S. population is between 20 to 44 years old, inclusive?
A) 6.06%
B) 24.07%
C) 63.82%
D) 30.12%
E) 36.18%
Let the random variable X denote a randomly chosen age group within the population. What percentage of the U.S. population is between 20 to 44 years old, inclusive?A) 6.06%
B) 24.07%
C) 63.82%
D) 30.12%
E) 36.18%
Question
An examination consisting of ten true-or-false questions was taken by a class of 100 students. The probability distribution of the random variable X, where X denotes the number of questions answered correctly by a randomly chosen student, is represented by the accompanying histogram. The rectangle with base centered on the number 8 is missing. What should be the height of this rectangle?
height = __________
height = __________
Question
Based on past experience, the manager of the VideoRama Store has compiled the following table, which gives the probabilities that a customer who enters the VideoRama Store will buy 0, 1, 2, 3, or 4 videocassettes. How many videocassettes can a customer entering this store be expected to buy? 
A) E = 0.56
B) E = 0.66
C) E = 0.91
D) E = 0.86
A) E = 0.56
B) E = 0.66
C) E = 0.91
D) E = 0.86
Question
A bank has two automatic tellers at its main office and two at each of its three branches. The number of machines that break down on a given day, along with the corresponding probabilities, are shown in the following table: 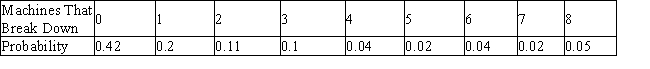 Find the expected number of machines that will break down on a given day.
A) E = 1.76
B) E = 1.54
C) E = 0.71
D) E = 1.19
Find the expected number of machines that will break down on a given day.A) E = 1.76
B) E = 1.54
C) E = 0.71
D) E = 1.19
Question
The daily earnings X of an employee who works on a commission basis are given by the following probability distribution. Find the employee's expected earnings. 
A) E(X) = 71.75
B) E(X) = 79.50
C) E(X) = 73.50
D) E(X) = 77.25
A) E(X) = 71.75
B) E(X) = 79.50
C) E(X) = 73.50
D) E(X) = 77.25
Question
Question
Question
Question
Question
Question
Find the expected value of a random variable X having the following probability distribution: 
A) E(X) = 0.79
B) E(X) = 1.07
C) E(X) = 0.73
D) E(X) = 0.86
A) E(X) = 0.79
B) E(X) = 1.07
C) E(X) = 0.73
D) E(X) = 0.86
Question
The number of accidents that occur at a certain intersection known as "Five Corners" on a Friday afternoon between the hours of 3 P.M. and 6 P.M., along with the corresponding probabilities, are shown in the following table. Find the expected number of accidents during the period in question. 
A) E = 0.081
B) E = 0.156
C) E = 0.106
D) E = 0.141
A) E = 0.081
B) E = 0.156
C) E = 0.106
D) E = 0.141
Question
Question
A panel of 50 economists was asked to predict the average prime interest rate for the upcoming year. The results of the survey follow:  Based on this survey, what does the panel expect the average prime interest rate to be next year?
A) E = 5.154
B) E = 5.374
C) E = 4.104
D) E = 5.724
Based on this survey, what does the panel expect the average prime interest rate to be next year?A) E = 5.154
B) E = 5.374
C) E = 4.104
D) E = 5.724
Question
Question
Question
Question
A panel of 64 economists was asked to predict the average unemployment rate for the upcoming year. The results of the survey follow: 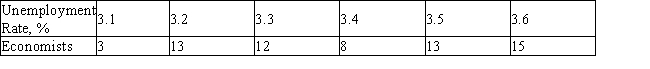 On the basis of this survey, what does the panel expect the average unemployment rate to be next year?
A) 2.82
B) 2.32
C) 2.68
D) 3.30
E) 3.39
On the basis of this survey, what does the panel expect the average unemployment rate to be next year?A) 2.82
B) 2.32
C) 2.68
D) 3.30
E) 3.39
Question
Question
The management of the Cambridge Company has projected the sales of its products (in millions of dollars) for the upcoming year, with the associated probabilities shown in the following table: 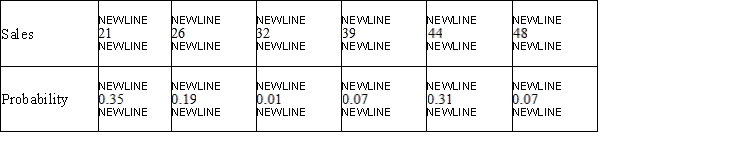 What does the management expect the sales to be next year?
A) 32.34
B) 15.34
C) 28.98
D) 29.61
E) 18.7
What does the management expect the sales to be next year?A) 32.34
B) 15.34
C) 28.98
D) 29.61
E) 18.7
Question
Question
Find the expected value of a random variable X having the following probability distribution: 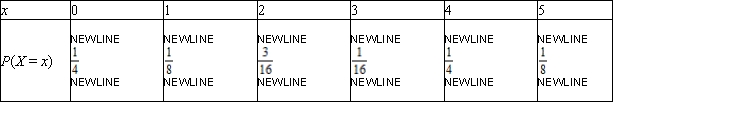
A) E(X) = 2.3125
B) E(X) = 1.0975
C) E(X) = 2.1875
D) E(X) = 2.3825
A) E(X) = 2.3125
B) E(X) = 1.0975
C) E(X) = 2.1875
D) E(X) = 2.3825
Question
If a player placed a $8 bet on red and a $5 bet on black in a single play in American roulette, what would be the expected value of his winnings? Round your answer to the nearest cent.
A) cents
cents
B) cents
cents
C) cents
cents
D) cents
cents
E) cents
cents
A)
centsB)
centsC)
centsD)
centsE)
cents Question
The number of accidents that occur at a certain intersection known as "Five Corners" on a Friday afternoon between the hours of 3 P.M. and 6 P.M., along with the corresponding probabilities, are shown in the following table. Find the expected number of accidents during the period in question. Give your answer to three decimal places, if necessary.  E = __________
E = __________ Question
Question
Question
Question
The daily earnings X of an employee who works on a commission basis are given by the following probability distribution. Find the employee's expected earnings. Give your answer to the nearest cent.  E (X) = $ __________
E (X) = $ __________ Question
A bank has two automatic tellers at its main office and two at each of its three branches. The number of machines that break down on a given day, along with the corresponding probabilities, are shown in the following table. Find the expected number of machines that will break down on a given day. Give your answer to two decimal places, if necessary. 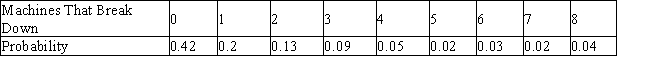 E = __________
E = __________ Question
Question
Question
Roger Hunt intends to purchase one of two car dealerships currently for sale in a certain city. Records obtained from each of the two dealers reveal that their weekly volume of sales, with corresponding probabilities, are as follows. Dahl Motors 
 Farthington Auto Sales
  The average profit/car at Dahl Motors is $367, and the average profit/car at Farthington Auto Sales is $439.
If Roger's objective is to purchase the dealership that generates the higher weekly profit, which dealership should he purchase? (Compare the expected weekly profit for each dealership.)
A) Farthington Auto Sales
B) Dahl Motors
C) either of the two
Farthington Auto Sales The average profit/car at Dahl Motors is $367, and the average profit/car at Farthington Auto Sales is $439.If Roger's objective is to purchase the dealership that generates the higher weekly profit, which dealership should he purchase? (Compare the expected weekly profit for each dealership.)
A) Farthington Auto Sales
B) Dahl Motors
C) either of the two
Question
Question
A panel of 50 economists was asked to predict the average prime interest rate for the upcoming year. The results of the survey follow. Based on this survey, what does the panel expect the average prime interest rate to be next year? Give your answer to three decimal places, if necessary.  E = __________
E = __________ Question
Based on past experience, the manager of the VideoRama Store has compiled the following table, which gives the probabilities that a customer who enters the VideoRama Store will buy 0, 1, 2, 3, or 4 videocassettes. How many videocassettes can a customer entering this store be expected to buy? Give your answer to two decimal places, if necessary.  E = __________
E = __________ Question
Question
In a lottery, 4,000 tickets are sold for $1 each. One first prize of $2,000, 1 second prize of $800, 3 third prizes of $120, and 10 consolation prizes of $12 are to be awarded. What are the expected net earnings of a person who buys one ticket?
A) cents
cents
B) cents
cents
C) cents
cents
D) cents
cents
E) cents
cents
A)
centsB)
centsC)
centsD)
centsE)
cents Question
Question
Find the expected value of a random variable X having the following probability distribution. Give your answer to two decimal places, if necessary.  E (X) = __________
E (X) = __________ Question
Find the expected value of a random variable X having the following probability distribution. Give your answer to four decimal places, if necessary. 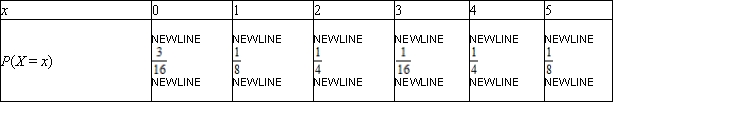 E (X) = __________
E (X) = __________ Question
Question

Unlock Deck
Sign up to unlock the cards in this deck!
Unlock Deck
Unlock Deck
1/263
Play
Full screen (f)
Deck 8: Probability Distributions and Statistics
1
A coin is tossed four times. Let the random variable X denote the number of heads that occur. Let H denotes the outcome "heads" and T denotes the outcome "tails". Find the value assigned to each outcome of the experiment by the random variable X.
A)
B)
C)
D)
A)
B)
C)
D)
2
An examination consisting of ten true-or-false questions was taken by a class of 100 students. The probability distribution of the random variable X, where X denotes the number of questions answered correctly by a randomly chosen student, is represented by the accompanying histogram. The rectangle with base centered on the number 8 is missing. What should be the height of this rectangle?
A) 0.35
B) 0.25
C) 0.4
D) 0.2
A) 0.35
B) 0.25
C) 0.4
D) 0.2
0.35
3
A die is cast repeatedly until a 4 falls uppermost. Let the random variable X denote the number of times the die is cast. What are the values that X may assume?
A) X may assume the values in the set S = {1, 2, 3, ...}
B) X may assume the values in the set S = {4}
C) X may assume the values in the set S = {1, 2, 3, 4, 5, 6}
A) X may assume the values in the set S = {1, 2, 3, ...}
B) X may assume the values in the set S = {4}
C) X may assume the values in the set S = {1, 2, 3, 4, 5, 6}
X may assume the values in the set S = {1, 2, 3, ...}
4
An examination consisting of ten true-or-false questions was taken by a class of 100 students. The probability distribution of the random variable X, where X denotes the number of questions answered correctly by a randomly chosen student, is represented by the accompanying histogram. The rectangle with base centered on the number 8 is missing. What should be the height of this rectangle?
A) 0.15
B) 0.3
C) 0.25
D) 0.1
A) 0.15
B) 0.3
C) 0.25
D) 0.1
Unlock Deck
Unlock for access to all 263 flashcards in this deck.
Unlock Deck
k this deck
5
Give the range of values that the random variable X may assume and classify the random variable as finite discrete, infinite discrete, or continuous.
X = The distance a commuter travels to work
A) . The random variable is infinite discrete.
B) . The random variable is continuous.
C) . The random variable is finite discrete.
X = The distance a commuter travels to work
A)
. The random variable is infinite discrete.B)
. The random variable is continuous.C)
. The random variable is finite discrete. Unlock Deck
Unlock for access to all 263 flashcards in this deck.
Unlock Deck
k this deck
6
Three balls are selected at random without replacement from an urn containing four white balls and six red balls. Let the random variable X denote the number of white balls drawn. List the outcomes of the experiment.
A) WWW, WWR, WRW, RWW, WRR, RWR, RRW
B) WWW, WWR, WRW, RWW
C) WWW, WWR, WRW, RWW, WRR, RWR, RRW, RRR
D) WRR, RWR, RRW, RRR
A) WWW, WWR, WRW, RWW, WRR, RWR, RRW
B) WWW, WWR, WRW, RWW
C) WWW, WWR, WRW, RWW, WRR, RWR, RRW, RRR
D) WRR, RWR, RRW, RRR
Unlock Deck
Unlock for access to all 263 flashcards in this deck.
Unlock Deck
k this deck
7
The probability distribution of the random variable X is shown in the accompanying table: Find , and .
A)
B)
C)
D)
Find , and .A)
B)
C)
D)
Unlock Deck
Unlock for access to all 263 flashcards in this deck.
Unlock Deck
k this deck
8
The probability distribution of the random variable X is shown in the accompanying table.
A) 0.35
B) 0.6
C) 0.55
D) 0.45
E) 0.3
A) 0.35
B) 0.6
C) 0.55
D) 0.45
E) 0.3
Unlock Deck
Unlock for access to all 263 flashcards in this deck.
Unlock Deck
k this deck
9
Cards are selected one at a time without replacement from a well-shuffled deck of 52 cards until an ace is drawn. Let X denote the random variable that gives the number of cards drawn. What values may X assume?
A) X may assume the values in the set S = {1, 2, ...,52}
B) X may assume the values in the set S = {1, 2, ...,47}
C) X may assume the values in the set S = {1, 2, ...,48}
D) X may assume the values in the set S = {1, 2, ...,49}
A) X may assume the values in the set S = {1, 2, ...,52}
B) X may assume the values in the set S = {1, 2, ...,47}
C) X may assume the values in the set S = {1, 2, ...,48}
D) X may assume the values in the set S = {1, 2, ...,49}
Unlock Deck
Unlock for access to all 263 flashcards in this deck.
Unlock Deck
k this deck
10
Let X denote the random variable that gives the sum of the faces that fall uppermost when two fair dice are cast. Find P ( X = 5 ).
A)
B)
C)
D)
A)
B)
C)
D)
Unlock Deck
Unlock for access to all 263 flashcards in this deck.
Unlock Deck
k this deck
11
Determine whether the statement is true or false. If it is true, explain why it is true. If it is false, give an example to show why it is false. The area of a histogram associated with a probability distribution is a number between 0 and 1.
A) False. The area is exactly equal to one.
B) True. This follows from the definition.
A) False. The area is exactly equal to one.
B) True. This follows from the definition.
Unlock Deck
Unlock for access to all 263 flashcards in this deck.
Unlock Deck
k this deck
12
Three cards are drawn from a well-shuffled deck of 52 playing cards. Let X denote the number of aces drawn. Find .
A)
B)
C)
D)
E)
. A)
B)
C)
D)
E)
Unlock Deck
Unlock for access to all 263 flashcards in this deck.
Unlock Deck
k this deck
13
Give the range of values that the random variable X may assume and classify the random variable as finite discrete, infinite discrete, or continuous.
X = The number of hours a child watches television on a given day
A) , Finite Continuous
B) Any positive integer, Infinite discrete
C) , discrete
D) , Finite discrete
E) , Continuous
X = The number of hours a child watches television on a given day
A)
, Finite ContinuousB) Any positive integer, Infinite discrete
C)
, discreteD)
, Finite discreteE)
, Continuous Unlock Deck
Unlock for access to all 263 flashcards in this deck.
Unlock Deck
k this deck
14
Give the range of values that the random variable X may assume and classify the random variable as finite discrete, infinite discrete, or continuous. X = The number of times an accountant takes the CPA examination before passing
A) Any integer; infinite discrete
B) 0 ≤ x < ∞; continuous
C) Any positive integer; infinite discrete
D) 0 ≤ x < 24; continuous
E) Any positive integer; infinite continuous
A) Any integer; infinite discrete
B) 0 ≤ x < ∞; continuous
C) Any positive integer; infinite discrete
D) 0 ≤ x < 24; continuous
E) Any positive integer; infinite continuous
Unlock Deck
Unlock for access to all 263 flashcards in this deck.
Unlock Deck
k this deck
15
Give the range of values that the random variable X may assume and classify the random variable as finite discrete, infinite discrete, or continuous.
X = The number of boys in a three-child family
A) {1, 2, 3}. The variable is finite discrete.
B) {1, 2, 3}. The variable is continuous.
C) {1, 2, 3}. The variable is infinite discrete.
X = The number of boys in a three-child family
A) {1, 2, 3}. The variable is finite discrete.
B) {1, 2, 3}. The variable is continuous.
C) {1, 2, 3}. The variable is infinite discrete.
Unlock Deck
Unlock for access to all 263 flashcards in this deck.
Unlock Deck
k this deck
16
Give the range of values that the random variable X may assume and classify the random variable as finite discrete, infinite discrete, or continuous.
X = The number of times a die is thrown until a 3 appears.
A) X may assume the values of any positive integer. The random variable is finite discrete.
B) X may assume the values of any positive integer. The random variable is continuous.
C) X may assume the values in the set S = {1, 2, 3, 4, 5, 6}. The random variable is finite discrete.
D) X may assume the values of any positive integer. The random variable is infinite discrete.
Unlock Deck
Unlock for access to all 263 flashcards in this deck.
Unlock Deck
k this deck
17
An examination consisting of ten true-or-false questions was taken by a class of 100 students. The probability distribution of the random variable X, where X denotes the number of questions answered correctly by a randomly chosen student, is represented by the accompanying histogram. The rectangle with base centered on the number 8 is missing. What should be the height of this rectangle?
A) 0.3
B) 0.35
C) 0.45
D) 0.5
A) 0.3
B) 0.35
C) 0.45
D) 0.5
Unlock Deck
Unlock for access to all 263 flashcards in this deck.
Unlock Deck
k this deck
18
Find the condition on the numbers a and b such that the table below gives the probability distribution of the random variable X.
A)
B)
C)
D)
E)
A)
B)
C)
D)
E)
Unlock Deck
Unlock for access to all 263 flashcards in this deck.
Unlock Deck
k this deck
19
Give the range of values that the random variable X may assume and classify the random variable as finite discrete, infinite discrete, or continuous.
X = The number of defective watches in a sample of four watches.
A) {0,1,2,3,4}; The random variable is finite discrete
B) {0,1,2,3,4}; The random variable is infinite discrete
C) X may assume the values of any positive integer. The random variable is infinite discrete.
D) X may assume the values of any positive integer. The random variable is continuous.
Unlock Deck
Unlock for access to all 263 flashcards in this deck.
Unlock Deck
k this deck
20
Determine whether the table gives the probability distribution of the random variable X. Explain your answer.
A) No, the sum of the probability assigned to the value of the random variable X is greater than 1.
B) No, the sum of the probability assigned to the value of the random variable X is not equal to 1.
C) No, the probability assigned to a value of the random variable X cannot be negative.
D) Yes, the sum of the probability assigned to the value of the random variable X is equal to 1.
E) No, the sum of the probability assigned to the value of the random variable X is less than 1.
Unlock Deck
Unlock for access to all 263 flashcards in this deck.
Unlock Deck
k this deck
21
Suppose a probability distribution of a random variable X is represented by the accompanying histogram. Shade that part of the histogram whose area gives the probability .
A)
B)
C)
D)
E)
. A)
B)
C)
D)
E)
Unlock Deck
Unlock for access to all 263 flashcards in this deck.
Unlock Deck
k this deck
22
An examination consisting of ten true-or-false questions was taken by a class of 100 students. The probability distribution of the random variable X, where X denotes the number of questions answered correctly by a randomly chosen student, is represented by the accompanying histogram. The rectangle with base centered on the number 8 is missing. What should be the height of this rectangle?
height = __________
height = __________
Unlock Deck
Unlock for access to all 263 flashcards in this deck.
Unlock Deck
k this deck
23
Three balls are selected at random without replacement from an urn containing four green balls and six red balls. Let the random variable X denote the number of green balls drawn. List the outcomes of the experiment.
Unlock Deck
Unlock for access to all 263 flashcards in this deck.
Unlock Deck
k this deck
24
The probability distribution of the random variable X is shown in the accompanying table.
Find the following, rounded to two decimal places, if necessary. __________ __________ __________ __________
Find the following, rounded to two decimal places, if necessary.
__________ __________ __________ __________ Unlock Deck
Unlock for access to all 263 flashcards in this deck.
Unlock Deck
k this deck
25
After the private screening of a new television pilot, audience members were asked to rate the new show on a scale of 1 to 10 (10 being the highest rating). From a group of 140 people, the accompanying responses were obtained.
Let the random variable X denote the rating given to the show by a randomly chosen audience member. Find the probability distribution associated with these data. Round answer to the nearest thousandth.
A)
B)
C)
D)
E)
Let the random variable X denote the rating given to the show by a randomly chosen audience member. Find the probability distribution associated with these data. Round answer to the nearest thousandth.
A)
B)
C)
D)
E)
Unlock Deck
Unlock for access to all 263 flashcards in this deck.
Unlock Deck
k this deck
26
The probability distribution of the random variable X is shown in the accompanying table. Find the following, rounded to two decimal places if necessary. __________ __________ __________
Find the following, rounded to two decimal places if necessary. __________ __________ __________ Unlock Deck
Unlock for access to all 263 flashcards in this deck.
Unlock Deck
k this deck
27
Give the range of values that the random variable X may assume and classify the random variable as finite discrete, infinite discrete, or continuous.
X = The distance a commuter travels to work
X = The distance a commuter travels to work
Unlock Deck
Unlock for access to all 263 flashcards in this deck.
Unlock Deck
k this deck
28
Suppose a probability distribution of a random variable X is represented by the accompanying histogram. Shade that part of the histogram whose area gives the probability .
A)
B)
C)
D)
E)
. A)
B)
C)
D)
E)
Unlock Deck
Unlock for access to all 263 flashcards in this deck.
Unlock Deck
k this deck
29
Let X denote the random variable that gives the sum of the faces that fall uppermost when two fair dice are cast. Find P(X = 7).
Unlock Deck
Unlock for access to all 263 flashcards in this deck.
Unlock Deck
k this deck
30
Four cards are drawn from a well-shuffled deck of 52 playing cards. Let X denote the number of aces drawn. Find .
. Unlock Deck
Unlock for access to all 263 flashcards in this deck.
Unlock Deck
k this deck
31
Give the range of values that the random variable X may assume and classify the random variable as finite discrete, infinite discrete, or continuous.
X = The number of times a die is thrown until a 5 appears.
X = The number of times a die is thrown until a 5 appears.
Unlock Deck
Unlock for access to all 263 flashcards in this deck.
Unlock Deck
k this deck
32
Suppose a probability distribution of a random variable X is represented by the accompanying histogram. Shade that part of the histogram whose area gives the probability .
A)
B)
C)
D)
E)
. A)
B)
C)
D)
E)
Unlock Deck
Unlock for access to all 263 flashcards in this deck.
Unlock Deck
k this deck
33
A survey was conducted by the Public Housing Authority in a certain community among 1,000 families to determine the distribution of families by size. The results follow. Find the probability distribution of the random variable X, where X denotes the number of persons in a randomly chosen family.
A)
B)
C)
D)
E)
Find the probability distribution of the random variable X, where X denotes the number of persons in a randomly chosen family. A)
B)
C)
D)
E)
Unlock Deck
Unlock for access to all 263 flashcards in this deck.
Unlock Deck
k this deck
34
A die is cast repeatedly until a 4 falls uppermost. Let the random variable X denote the number of times the die is cast. What are the values that X may assume?
Unlock Deck
Unlock for access to all 263 flashcards in this deck.
Unlock Deck
k this deck
35
The rates paid by 30 financial institutions on a certain day for money market deposit accounts are shown in the accompanying table. Let the random variable X denote the interest paid by a randomly chosen financial institution on its money market deposit accounts and find the probability distribution associated with these data.
Let the random variable X denote the interest paid by a randomly chosen financial institution on its money market deposit accounts and find the probability distribution associated with these data. Unlock Deck
Unlock for access to all 263 flashcards in this deck.
Unlock Deck
k this deck
36
An examination consisting of ten true-or-false questions was taken by a class of 100 students. The probability distribution of the random variable X, where X denotes the number of questions answered correctly by a randomly chosen student, is represented by the accompanying histogram. The rectangle with base centered on the number 8 is missing. What should be the height of this rectangle?
height = __________
height = __________
Unlock Deck
Unlock for access to all 263 flashcards in this deck.
Unlock Deck
k this deck
37
Give the range of values that the random variable X may assume and classify the random variable as finite discrete, infinite discrete, or continuous.
X = The number of defective watches in a sample of six watches.
X = The number of defective watches in a sample of six watches.
Unlock Deck
Unlock for access to all 263 flashcards in this deck.
Unlock Deck
k this deck
38
Cards are selected one at a time without replacement from a well-shuffled deck of 52 cards until a jack is drawn. Let X denote the random variable that gives the number of cards drawn. What values may X assume?
Unlock Deck
Unlock for access to all 263 flashcards in this deck.
Unlock Deck
k this deck
39
The following table gives the 2002 age distribution of U.S. population: Let the random variable X denote a randomly chosen age group within the population. What percentage of the U.S. population is between 20 to 44 years old, inclusive?
A) 6.06%
B) 24.07%
C) 63.82%
D) 30.12%
E) 36.18%
Let the random variable X denote a randomly chosen age group within the population. What percentage of the U.S. population is between 20 to 44 years old, inclusive?A) 6.06%
B) 24.07%
C) 63.82%
D) 30.12%
E) 36.18%
Unlock Deck
Unlock for access to all 263 flashcards in this deck.
Unlock Deck
k this deck
40
An examination consisting of ten true-or-false questions was taken by a class of 100 students. The probability distribution of the random variable X, where X denotes the number of questions answered correctly by a randomly chosen student, is represented by the accompanying histogram. The rectangle with base centered on the number 8 is missing. What should be the height of this rectangle?
height = __________
height = __________
Unlock Deck
Unlock for access to all 263 flashcards in this deck.
Unlock Deck
k this deck
41
Based on past experience, the manager of the VideoRama Store has compiled the following table, which gives the probabilities that a customer who enters the VideoRama Store will buy 0, 1, 2, 3, or 4 videocassettes. How many videocassettes can a customer entering this store be expected to buy?
A) E = 0.56
B) E = 0.66
C) E = 0.91
D) E = 0.86
A) E = 0.56
B) E = 0.66
C) E = 0.91
D) E = 0.86
Unlock Deck
Unlock for access to all 263 flashcards in this deck.
Unlock Deck
k this deck
42
A bank has two automatic tellers at its main office and two at each of its three branches. The number of machines that break down on a given day, along with the corresponding probabilities, are shown in the following table: Find the expected number of machines that will break down on a given day.
A) E = 1.76
B) E = 1.54
C) E = 0.71
D) E = 1.19
Find the expected number of machines that will break down on a given day.A) E = 1.76
B) E = 1.54
C) E = 0.71
D) E = 1.19
Unlock Deck
Unlock for access to all 263 flashcards in this deck.
Unlock Deck
k this deck
43
The daily earnings X of an employee who works on a commission basis are given by the following probability distribution. Find the employee's expected earnings.
A) E(X) = 71.75
B) E(X) = 79.50
C) E(X) = 73.50
D) E(X) = 77.25
A) E(X) = 71.75
B) E(X) = 79.50
C) E(X) = 73.50
D) E(X) = 77.25
Unlock Deck
Unlock for access to all 263 flashcards in this deck.
Unlock Deck
k this deck
44
The odds against an event E occurring are 4 to 1. What is the probability of E not occurring?
A) 0.5
B) 0.25
C) 0.6
D) 0.8
A) 0.5
B) 0.25
C) 0.6
D) 0.8
Unlock Deck
Unlock for access to all 263 flashcards in this deck.
Unlock Deck
k this deck
45
In European roulette the wheel is divided into 37 compartments numbered 1 through 36 and 0. (In American roulette there are 38 compartments numbered 1 through 36, 0, and 00.) Find the expected value of the winnings on a $3 bet placed on red in European roulette. Round your answer to the nearest cent.
A) $0.08%
B) - $0.08%
C) - $0.03%
D) $0.03%
A) $0.08%
B) - $0.08%
C) - $0.03%
D) $0.03%
Unlock Deck
Unlock for access to all 263 flashcards in this deck.
Unlock Deck
k this deck
46
Maria sees the growth of her business for the upcoming year as being tied to the gross domestic product (GDP). She believes that her business will grow (or contract) at the rate of 5%, 4.5%, 3%, 0%, or - 0.5% per year if the GDP grows (or contracts) at the rate of between 2 and 2.5%, between 1.5 and 2%, between 1 and 1.5%, between 0 and 1%, and between - 1 and 0%, respectively. Maria has decided to assign a probability of 0.13, 0.24, 0.39, 0.19, and 0.05, respectively, to each outcome. At what rate does Maria expect her business to grow next year?
A) 2.615%
B) 3.005%
C) 2.875%
D) 2.325%
A) 2.615%
B) 3.005%
C) 2.875%
D) 2.325%
Unlock Deck
Unlock for access to all 263 flashcards in this deck.
Unlock Deck
k this deck
47
A woman purchased a $10,000, 1-year term-life insurance policy for $150. Assuming that the probability that she will live another year is 0.993, find the company's expected gain.
A) E = $80
B) E = $100
C) E = $140
D) E = $90
A) E = $80
B) E = $100
C) E = $140
D) E = $90
Unlock Deck
Unlock for access to all 263 flashcards in this deck.
Unlock Deck
k this deck
48
The odds in favor of an event E occurring are 12 to 8. What is the probability of E occuring?
A) 1.40
B) 0.40
C) 0.60
D) 0.67
E) 1.50
A) 1.40
B) 0.40
C) 0.60
D) 0.67
E) 1.50
Unlock Deck
Unlock for access to all 263 flashcards in this deck.
Unlock Deck
k this deck
49
Find the expected value of a random variable X having the following probability distribution:
A) E(X) = 0.79
B) E(X) = 1.07
C) E(X) = 0.73
D) E(X) = 0.86
A) E(X) = 0.79
B) E(X) = 1.07
C) E(X) = 0.73
D) E(X) = 0.86
Unlock Deck
Unlock for access to all 263 flashcards in this deck.
Unlock Deck
k this deck
50
The number of accidents that occur at a certain intersection known as "Five Corners" on a Friday afternoon between the hours of 3 P.M. and 6 P.M., along with the corresponding probabilities, are shown in the following table. Find the expected number of accidents during the period in question.
A) E = 0.081
B) E = 0.156
C) E = 0.106
D) E = 0.141
A) E = 0.081
B) E = 0.156
C) E = 0.106
D) E = 0.141
Unlock Deck
Unlock for access to all 263 flashcards in this deck.
Unlock Deck
k this deck
51
If a sample of 8 batteries is selected from a lot of 11, of which 4 are defective, what is the expected number of defective batteries? Round your answer to next whole number.
A) 7
B) 10
C) 12
D) 5
E) 6
A) 7
B) 10
C) 12
D) 5
E) 6
Unlock Deck
Unlock for access to all 263 flashcards in this deck.
Unlock Deck
k this deck
52
A panel of 50 economists was asked to predict the average prime interest rate for the upcoming year. The results of the survey follow: Based on this survey, what does the panel expect the average prime interest rate to be next year?
A) E = 5.154
B) E = 5.374
C) E = 4.104
D) E = 5.724
Based on this survey, what does the panel expect the average prime interest rate to be next year?A) E = 5.154
B) E = 5.374
C) E = 4.104
D) E = 5.724
Unlock Deck
Unlock for access to all 263 flashcards in this deck.
Unlock Deck
k this deck
53
In American roulette a player may bet on a split (two adjacent numbers). In this case, if the player bets $1 and either number comes up, the player wins $14 and gets his $1 back. If neither comes up, he loses his $1 bet. Find the expected value of the winnings on a $1 bet placed on a split. Round your answer to the nearest cent.
A) - $0.06%
B) - $0.21%
C) $0.06%
D) $0.21%
A) - $0.06%
B) - $0.21%
C) $0.06%
D) $0.21%
Unlock Deck
Unlock for access to all 263 flashcards in this deck.
Unlock Deck
k this deck
54
Give the range of values that the random variable X may assume and classify the random variable as finite discrete, infinite discrete, or continuous.
X = The number of boys in a two-child family
X = The number of boys in a two-child family
Unlock Deck
Unlock for access to all 263 flashcards in this deck.
Unlock Deck
k this deck
55
Determine whether the statement is true or false. If it is true, explain why it is true. If it is false, give an example to show why it is false.
The area of a histogram associated with a probability distribution is a number between 0 and 1.
The area of a histogram associated with a probability distribution is a number between 0 and 1.
Unlock Deck
Unlock for access to all 263 flashcards in this deck.
Unlock Deck
k this deck
56
A panel of 64 economists was asked to predict the average unemployment rate for the upcoming year. The results of the survey follow: On the basis of this survey, what does the panel expect the average unemployment rate to be next year?
A) 2.82
B) 2.32
C) 2.68
D) 3.30
E) 3.39
On the basis of this survey, what does the panel expect the average unemployment rate to be next year?A) 2.82
B) 2.32
C) 2.68
D) 3.30
E) 3.39
Unlock Deck
Unlock for access to all 263 flashcards in this deck.
Unlock Deck
k this deck
57
Give the range of values that the random variable X may assume and classify the random variable as finite discrete, infinite discrete, or continuous.
X = The number of times an accountant takes the CPA examination before passing
X = The number of times an accountant takes the CPA examination before passing
Unlock Deck
Unlock for access to all 263 flashcards in this deck.
Unlock Deck
k this deck
58
The management of the Cambridge Company has projected the sales of its products (in millions of dollars) for the upcoming year, with the associated probabilities shown in the following table: What does the management expect the sales to be next year?
A) 32.34
B) 15.34
C) 28.98
D) 29.61
E) 18.7
What does the management expect the sales to be next year?A) 32.34
B) 15.34
C) 28.98
D) 29.61
E) 18.7
Unlock Deck
Unlock for access to all 263 flashcards in this deck.
Unlock Deck
k this deck
59
The management of MultiVision, a cable TV company, intends to submit a bid for the cable television rights in one of two cities, A or B. If the company obtains the rights to city A, the probability of which is 0.3, the estimated profit over the next 10 yr is $10 million; if the company obtains the rights to city B, the probability of which is 0.4, the estimated profit over the next 10 yr is $7 million. The cost of submitting a bid for rights in city A is $300,000 and that of city B is $300,000.
By comparing the expected profits for each venture, determine whether the company should bid for the rights in city A or city B.
A) City A
B) City B
By comparing the expected profits for each venture, determine whether the company should bid for the rights in city A or city B.
A) City A
B) City B
Unlock Deck
Unlock for access to all 263 flashcards in this deck.
Unlock Deck
k this deck
60
Find the expected value of a random variable X having the following probability distribution:
A) E(X) = 2.3125
B) E(X) = 1.0975
C) E(X) = 2.1875
D) E(X) = 2.3825
A) E(X) = 2.3125
B) E(X) = 1.0975
C) E(X) = 2.1875
D) E(X) = 2.3825
Unlock Deck
Unlock for access to all 263 flashcards in this deck.
Unlock Deck
k this deck
61
If a player placed a $8 bet on red and a $5 bet on black in a single play in American roulette, what would be the expected value of his winnings? Round your answer to the nearest cent.
A) cents
B) cents
C) cents
D) cents
E) cents
A)
centsB)
centsC)
centsD)
centsE)
cents Unlock Deck
Unlock for access to all 263 flashcards in this deck.
Unlock Deck
k this deck
62
The number of accidents that occur at a certain intersection known as "Five Corners" on a Friday afternoon between the hours of 3 P.M. and 6 P.M., along with the corresponding probabilities, are shown in the following table. Find the expected number of accidents during the period in question. Give your answer to three decimal places, if necessary. E = __________
E = __________ Unlock Deck
Unlock for access to all 263 flashcards in this deck.
Unlock Deck
k this deck
63
Determine whether the statement is true or false. If it is true, explain why it is true. If it is false, give an example to show why it is false. A game between two persons is fair if the expected value to both persons is zero.
A) False. This is contrary to the definition.
B) True. This follows from the definition.
A) False. This is contrary to the definition.
B) True. This follows from the definition.
Unlock Deck
Unlock for access to all 263 flashcards in this deck.
Unlock Deck
k this deck
64
Steffi feels that the odds in favor of her winning her tennis match tomorrow are 5 to 4. What is the (subjective) probability that she will win her match tomorrow? Give your answer to four decimal places, if necessary.
The probability is __________.
The probability is __________.
Unlock Deck
Unlock for access to all 263 flashcards in this deck.
Unlock Deck
k this deck
65
Maria sees the growth of her business for the upcoming year as being tied to the gross domestic product (GDP). She believes that her business will grow (or contract) at the rate of 5%, 4.5%, 3%, 0%, or - 0.5% per year if the GDP grows (or contracts) at the rate of between 2 and 2.5%, between 1.5 and 2%, between 1 and 1.5%, between 0 and 1%, and between - 1 and 0%, respectively.
Maria has decided to assign a probability of 0.11, 0.23, 0.43, 0.19, and 0.04, respectively, to each outcome. At what rate does Maria expect her business to grow next year? Give your answer to three decimal places, if necessary.
__________ %
Maria has decided to assign a probability of 0.11, 0.23, 0.43, 0.19, and 0.04, respectively, to each outcome. At what rate does Maria expect her business to grow next year? Give your answer to three decimal places, if necessary.
__________ %
Unlock Deck
Unlock for access to all 263 flashcards in this deck.
Unlock Deck
k this deck
66
The daily earnings X of an employee who works on a commission basis are given by the following probability distribution. Find the employee's expected earnings. Give your answer to the nearest cent. E (X) = $ __________
E (X) = $ __________ Unlock Deck
Unlock for access to all 263 flashcards in this deck.
Unlock Deck
k this deck
67
A bank has two automatic tellers at its main office and two at each of its three branches. The number of machines that break down on a given day, along with the corresponding probabilities, are shown in the following table. Find the expected number of machines that will break down on a given day. Give your answer to two decimal places, if necessary. E = __________
E = __________ Unlock Deck
Unlock for access to all 263 flashcards in this deck.
Unlock Deck
k this deck
68
The odds against an event E occurring are 1 to 7. What is the probability of E not occurring? Give your answer to three decimal places, if necessary.
The probability is __________.
The probability is __________.
Unlock Deck
Unlock for access to all 263 flashcards in this deck.
Unlock Deck
k this deck
69
In American roulette a player may bet on a split (two adjacent numbers). In this case, if the player bets $1 and either number comes up, the player wins $17 and gets his $1 back. If neither comes up, he loses his $1 bet. Find the expected value of the winnings on a $1 bet placed on a split. Round your answer to the nearest cent.
$ __________
$ __________
Unlock Deck
Unlock for access to all 263 flashcards in this deck.
Unlock Deck
k this deck
70
Roger Hunt intends to purchase one of two car dealerships currently for sale in a certain city. Records obtained from each of the two dealers reveal that their weekly volume of sales, with corresponding probabilities, are as follows. Dahl Motors Farthington Auto Sales The average profit/car at Dahl Motors is $367, and the average profit/car at Farthington Auto Sales is $439.
If Roger's objective is to purchase the dealership that generates the higher weekly profit, which dealership should he purchase? (Compare the expected weekly profit for each dealership.)
A) Farthington Auto Sales
B) Dahl Motors
C) either of the two
Farthington Auto Sales The average profit/car at Dahl Motors is $367, and the average profit/car at Farthington Auto Sales is $439.If Roger's objective is to purchase the dealership that generates the higher weekly profit, which dealership should he purchase? (Compare the expected weekly profit for each dealership.)
A) Farthington Auto Sales
B) Dahl Motors
C) either of the two
Unlock Deck
Unlock for access to all 263 flashcards in this deck.
Unlock Deck
k this deck
71
A woman purchased a $10,000, 1-year term-life insurance policy for $150. Assuming that the probability that she will live another year is 0.991, find the company's expected gain.
E = $ __________
E = $ __________
Unlock Deck
Unlock for access to all 263 flashcards in this deck.
Unlock Deck
k this deck
72
A panel of 50 economists was asked to predict the average prime interest rate for the upcoming year. The results of the survey follow. Based on this survey, what does the panel expect the average prime interest rate to be next year? Give your answer to three decimal places, if necessary. E = __________
E = __________ Unlock Deck
Unlock for access to all 263 flashcards in this deck.
Unlock Deck
k this deck
73
Based on past experience, the manager of the VideoRama Store has compiled the following table, which gives the probabilities that a customer who enters the VideoRama Store will buy 0, 1, 2, 3, or 4 videocassettes. How many videocassettes can a customer entering this store be expected to buy? Give your answer to two decimal places, if necessary. E = __________
E = __________ Unlock Deck
Unlock for access to all 263 flashcards in this deck.
Unlock Deck
k this deck
74
A buyer for Discount Fashions, an outlet for women's apparel, is considering buying a batch of clothing for $61,000. She estimates that the company will be able to sell it for $80,000, $75,000, or $70,000 with probabilities of 0.20, 0.40, and 0.40, respectively. Based on these estimates, what will be the company's expected gross profit?
A) $13,000
B) $23,400
C) $7,800
D) $15,600
E) $10,400
A) $13,000
B) $23,400
C) $7,800
D) $15,600
E) $10,400
Unlock Deck
Unlock for access to all 263 flashcards in this deck.
Unlock Deck
k this deck
75
In a lottery, 4,000 tickets are sold for $1 each. One first prize of $2,000, 1 second prize of $800, 3 third prizes of $120, and 10 consolation prizes of $12 are to be awarded. What are the expected net earnings of a person who buys one ticket?
A) cents
B) cents
C) cents
D) cents
E) cents
A)
centsB)
centsC)
centsD)
centsE)
cents Unlock Deck
Unlock for access to all 263 flashcards in this deck.
Unlock Deck
k this deck
76
In European roulette the wheel is divided into 37 compartments numbered 1 through 36 and 0. (In American roulette there are 38 compartments numbered 1 through 36, 0, and 00.) Find the expected value of the winnings on a $2 bet placed on black in European roulette. Round your answer to the nearest cent.
$ __________
$ __________
Unlock Deck
Unlock for access to all 263 flashcards in this deck.
Unlock Deck
k this deck
77
Find the expected value of a random variable X having the following probability distribution. Give your answer to two decimal places, if necessary. E (X) = __________
E (X) = __________ Unlock Deck
Unlock for access to all 263 flashcards in this deck.
Unlock Deck
k this deck
78
Find the expected value of a random variable X having the following probability distribution. Give your answer to four decimal places, if necessary. E (X) = __________
E (X) = __________ Unlock Deck
Unlock for access to all 263 flashcards in this deck.
Unlock Deck
k this deck
79
Bob, the proprietor of Midland Lumber, feels that the odds in favor of a business deal going through are 7 to 6. What is the (subjective) probability that this deal will not materialize?
A) 0.4647
B) 0.4622
C) 0.4615
D) 0.4460
A) 0.4647
B) 0.4622
C) 0.4615
D) 0.4460
Unlock Deck
Unlock for access to all 263 flashcards in this deck.
Unlock Deck
k this deck
80
Steffi feels that the odds in favor of her winning her tennis match tomorrow are 2 to 10. What is the (subjective) probability that she will win her match tomorrow?
A) 0.1612
B) 0.1660
C) 0.1699
D) 0.1667
A) 0.1612
B) 0.1660
C) 0.1699
D) 0.1667
Unlock Deck
Unlock for access to all 263 flashcards in this deck.
Unlock Deck
k this deck
Unlock Deck
Unlock for access to all 263 flashcards in this deck.


