Deck 4: Individual and Market Demand
Full screen (f)
Question
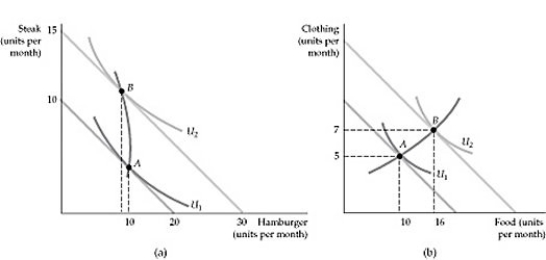 Figure 4.1.4
Refer to Figure 4.1.4 above. Which of the following goods is an inferior good?
A) Steak
B) Hamburger
C) Clothing
D) Food
Question
Question
Question
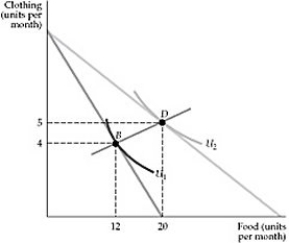 Figure 4.1.2
Refer to Figure 4.1.2. From the information on the figure, we can obtain:
A) an upward-sloping demand curve.
B) two points on a downward-sloping individual demand curve.
C) a downward-sloping market demand curve.
D) a demand curve for food and clothing.
Question
Question
In the diagram below, Marvin's optimal consumption bundles are indicated for five different budget constraints. Sketch the Engel curve for Marvin. Next, use the diagram to sketch Marvin's demand curve for the good on the horizontal axis. 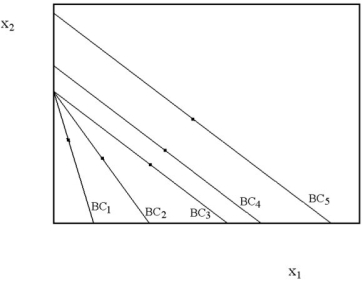
Question
Question
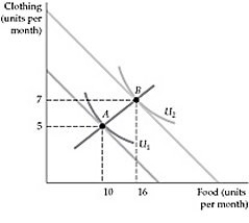 Figure 4.1.3
Refer to Figure 4.1.3 above. From the information on the figure we can derive:
A) a price-consumption curve.
B) two points on an individual demand curve.
C) a shifting demand curve.
D) an upward-sloping demand curve.
Question
Question
Question
Question
Figure 4.1.3Refer to Figure 4.1.3 above. The connection of points A and B on the graph yields:
A) a price-consumption curve.
B) an income-consumption curve.
C) an individual demand curve.
D) an Engel curve.
Question
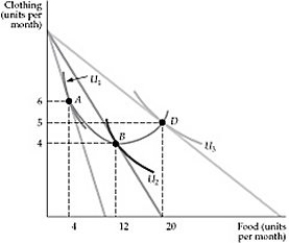 Figure 4.1.5
Refer to Figure 4.1.5 above. In the upward-sloping portion of the curve that connects points A, B and D, the two goods, food and clothing, are:
A) substitutes.
B) complements
C) independent
D) unrelated
Question
Question
Question
Figure 4.1.2Refer to Figure 4.1.2. The connection of points B and D forms:
A) a demand curve.
B) an income-consumption curve.
C) a price-consumption curve.
D) a shift from one demand curve.to another.
Question
Figure 4.1.5Refer to Figure 4.1.5 above. In the downward-sloping portion of the curve that connects points A, B and D, the two goods, food and clothing, are:
A) substitutes.
B) complements.
C) independent.
D) unrelated.
Question
Figure 4.1.4Refer to question 4.1.4 above. Which goods are normal goods?
A) Steak and hamburger
B) Clothing, food and hamburger
C) Clothing, food and steak
D) Clothing and food
Question
Figure 4.1.4Refer to Figure 4.1.4 above. The curves that connect points A and B on both graphs are:
A) price-consumption curves.
B) income-consumption curves.
C) Engel curves.
D) individual demand curves.
Question
Question
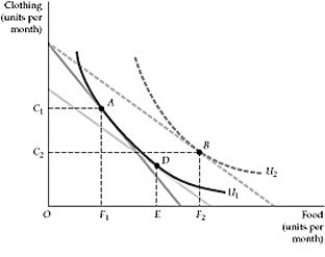 Figure 4.2.1
Refer to Figure 4.2.1 above. Starting at point A, which of the following moves represents the total effect of a price change?
A) The move from F1 to E
B) The move from E to F2
C) The move from F1 to F2
D) A move from F1 to F2 and then to E
Question
Melissa's optimal consumption is indicated in the diagram below for three different income levels. For Melissa are park visits a normal or inferior good? Explain your answer. 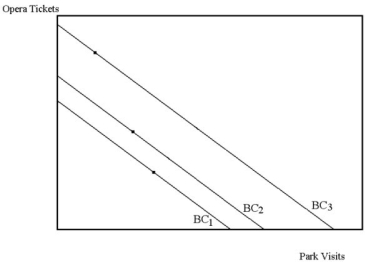
Question
Question
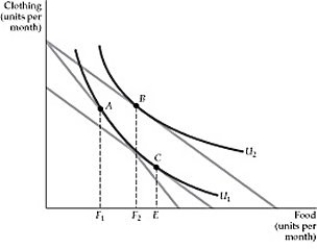 Figure 4.2.2
Refer to Figure 4.2.2 above. Starting at point A, which of the following represents the substitution effect of an increase in the price of food?
A) The move from A to B
B) The move from A to C
C) The move from A to B, and then to C
D) The move from A to C, and then to B
Question
Question
Question
Figure 4.2.1Refer to Figure 4.2.1 above. Which of the following moves represents the substitution effect?
A) The move from F1 to E
B) The move from E to F2
C) The move from F1 to F2
D) A move from F1 to F2 and then to E
Question
Figure 4.2.2Refer to Figure 4.2.2 above. The effect of a decrease in the price of food, as depicted in the figure, leads us to believe that:
A) food in an inferior good and clothing a normal good.
B) food in a normal good and clothing an inferior good.
C) both food and clothing are normal goods.
D) both food and clothing are inferior goods.
Question
Question
Question
Question
Figure 4.2.2Refer to Figure 4.2.2 above. Starting from point A, after the price of food decreases,, the quantity of food purchased:
A) increases, due to the income effect but decreases due to the substitution effect.
B) increases, due to the substitution effect but decreases due to the income effect.
C) increases from A to B due to the income effect, and then to C due to the substitution effect.
D) decreases.
Question
Using the table below, construct an Engel Curve for each beer type. 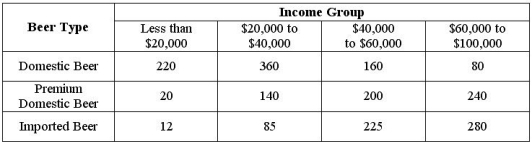
Question
Question
Question
Question
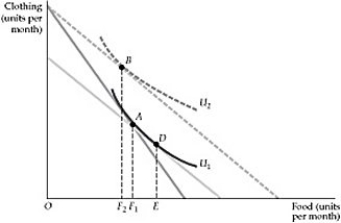 Figure 4.2.3
Refer to Figure 4.2.3 above. The effect of a decrease in the price of food, as depicted in the figure, leads us to believe that:
A) food is an inferior good and clothing a Giffen good.
B) food is a normal good and clothing a Giffen good.
C) food is a Giffen good and clothing a normal good.
D) food is a Giffen good and clothing an inferior good.
Question
Figure 4.2.1Refer to Figure 4.2.1 above. Which of the following moves represents the income effect?
A) The move from F1 to E
B) The move from E to F2
C) The move from F1 to F2
D) A move from F1 to F2 and then to E
Question
Question
Question
Question
Question
Question
Question
Question
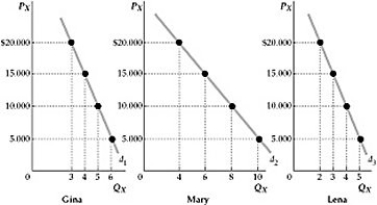 Figure 4.3.1
Refer to Figure 4.3.1 above. The figure depicts the individual demands of the only three consumers in the market for good X. After constructing the market demand curve, we determine that quantity demanded at a price of $10.000 is:
A) 15 units.
B) 17 units.
C) 30.000 units.
D) none of the above
Question
Question
Question
Question
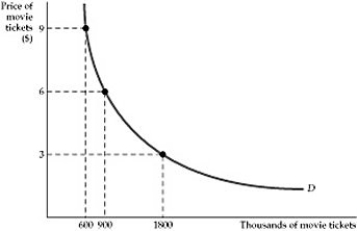 Figure 4.3.2
Refer to Figure 4.3.2 above. How do total expenditures on movie tickets vary along the demand curve?
A) Since quantity demanded increases as price decreases, total expenditures increase.
B) Since the quantity is sold at lower and lower prices, total expenditures decrease as quantity demanded increases.
C) Total expenditures remain the same between points along the demand curve.
D) Total expenditures increase through the upper portion of the curve and then decrease at low price levels.
Question
Figure 4.3.1Price elasticity of demand measures the:
A) slope of the demand curve.
B) sensitivity of quantity demanded to changes in the price of substitute goods.
C) sensitivity of price to changes in the quantity demanded of substitute goods.
D) sensitivity of quantity demanded to changes in price.
Question
Question
Question
Figure 4.3.2Refer to Figure 4.3.2 above. The elasticity of the demand for the curve in the figure can be described as:
A) elastic in the upper portions of the curve and inelastic in the lower portions.
B) a special case of an isoelastic curve called the unit-elastic demand curve.
C) elastic throughout the curve.
D) inelastic throughout the curve.
Question
Figure 4.3.1Aggregation examples of market demand could include:
A) the demand for home computers by households with or without children.
B) the domestic and foreign demand for wheat.
C) the demands of different demographic groups.
D) all of the above
Question
Question
Question
Question
Question
Question
The demand for telephone wire can be expressed as:
Q = 6000 - 1,500P,
where Q represents units, in pounds per day, and P represents price, in dollars per pound. Determine the price elasticity of demand at per pound.
Q = 6000 - 1,500P,
where Q represents units, in pounds per day, and P represents price, in dollars per pound. Determine the price elasticity of demand at
per pound. Question
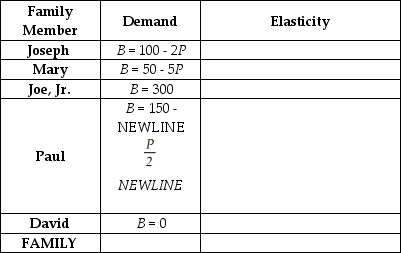
The table below lists the demand curve for sleeves of tennis balls for each member of the Parker family. Use this information to determine the Parker's aggregate family demand for tennis balls. What is the price elasticity of demand for each member of the family at $2.00? What is the price elasticity of family aggregate demand at $2.00?
Question
General Motors estimates that U.S. demand for its newest product will be:  Export demand will be
  The total market demand curve for this product will be a:
A) straight line with a slope of -0.5.
B) straight line with a slope of -1.0.
C) kinked line with the kink at Q = 25,000.
D) kinked line with the kink at P = 50,000.
E) none of the above
Export demand will be The total market demand curve for this product will be a:A) straight line with a slope of -0.5.
B) straight line with a slope of -1.0.
C) kinked line with the kink at Q = 25,000.
D) kinked line with the kink at P = 50,000.
E) none of the above
Question
Question
Question
Question
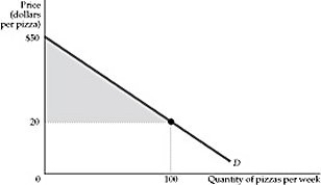 Figure 4.4.2
Refer to Figure 4.4.2 above. The consumer surplus derived from pizza consumption is:
A) $1500.
B) $2000.
C) $3000.
D) $3500.
Question
Question
Question
Question
Figure 4.4.2Refer to Figure 4.4.2 above. The total weekly expenditure on pizza is:
A) $1500.
B) $2000.
C) $3000.
D) $3500.
Question
The world demand for power transmission wire is made up of both domestic and foreign demands. Thus, the total demand is the sum of the two sub-demands, which are given as:
Domestic demand: Pd = 5 - 0.005Qd
Foreign demand: Pf = 3 - 0.00075Qf,
where Pd and Pf are in dollars per pound, and Qd and Qf are in pounds per day.
a. Determine the world demand for power transmission wire.
b. Determine the prices at which domestic and foreign buyers would enter the market.
c. Determine the domestic and foreign quantities at per pound. Check to see if the sum of Qd and Qf equals Q.
d. Determine total rate of purchases at per pound.
Domestic demand: Pd = 5 - 0.005Qd
Foreign demand: Pf = 3 - 0.00075Qf,
where Pd and Pf are in dollars per pound, and Qd and Qf are in pounds per day.
a. Determine the world demand for power transmission wire.
b. Determine the prices at which domestic and foreign buyers would enter the market.
c. Determine the domestic and foreign quantities at
per pound. Check to see if the sum of Qd and Qf equals Q.d. Determine total rate of purchases at
per pound. Question
Question
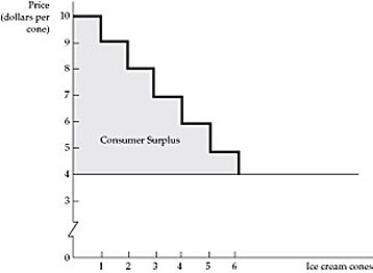 Figure 4.4.1
Refer to Figure 4.4.1 above. The value of consumer surplus when price is $4 equals:
A) $21.
B) $24.
C) $45.
D) none of the above
Question
Question
Question
Question
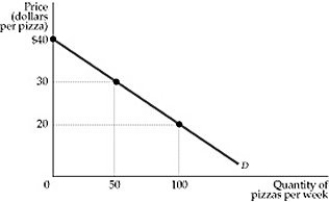 Figure 4.4.3
Refer to Figure 4.4.3 above. When the price of pizza is $20, total expenditure and consumer surplus are, respectively:
A) $2000; $2000.
B) $1000; $2000.
C) $2000; $1000.
D) $1000; $1000.
Question
Question

Unlock Deck
Sign up to unlock the cards in this deck!
Unlock Deck
Unlock Deck
1/131
Play
Full screen (f)
Deck 4: Individual and Market Demand
1
Figure 4.1.4Refer to Figure 4.1.4 above. Which of the following goods is an inferior good?
A) Steak
B) Hamburger
C) Clothing
D) Food
Hamburger
2
Which of the following claims is true at each point along a price-consumption curve?
A) Utility is maximized but income is not all spent.
B) All income is spent, but utility is not maximized.
C) Utility is maximized, and all income is spent.
D) The level of utility is constant.
A) Utility is maximized but income is not all spent.
B) All income is spent, but utility is not maximized.
C) Utility is maximized, and all income is spent.
D) The level of utility is constant.
Utility is maximized, and all income is spent.
3
An Engel curve shows combinations of:
A) income and prices.
B) two goods, for different levels of income.
C) two goods, for different levels of prices.
D) income and the quantity consumed of one good.
A) income and prices.
B) two goods, for different levels of income.
C) two goods, for different levels of prices.
D) income and the quantity consumed of one good.
income and the quantity consumed of one good.
4
Figure 4.1.2Refer to Figure 4.1.2. From the information on the figure, we can obtain:
A) an upward-sloping demand curve.
B) two points on a downward-sloping individual demand curve.
C) a downward-sloping market demand curve.
D) a demand curve for food and clothing.
Unlock Deck
Unlock for access to all 131 flashcards in this deck.
Unlock Deck
k this deck
5
Which of the following is true regarding income along a price-consumption curve?
A) Income is increasing.
B) Income is decreasing.
C) Income is constant.
D) The level of income depends on the level of utility.
A) Income is increasing.
B) Income is decreasing.
C) Income is constant.
D) The level of income depends on the level of utility.
Unlock Deck
Unlock for access to all 131 flashcards in this deck.
Unlock Deck
k this deck
6
In the diagram below, Marvin's optimal consumption bundles are indicated for five different budget constraints. Sketch the Engel curve for Marvin. Next, use the diagram to sketch Marvin's demand curve for the good on the horizontal axis.
Unlock Deck
Unlock for access to all 131 flashcards in this deck.
Unlock Deck
k this deck
7
If an increase in the price of one good leads to an increase in the quantity demanded of another, the two goods are:
A) substitutes.
B) complements.
C) independent.
D) unrelated.
A) substitutes.
B) complements.
C) independent.
D) unrelated.
Unlock Deck
Unlock for access to all 131 flashcards in this deck.
Unlock Deck
k this deck
8
Figure 4.1.3Refer to Figure 4.1.3 above. From the information on the figure we can derive:
A) a price-consumption curve.
B) two points on an individual demand curve.
C) a shifting demand curve.
D) an upward-sloping demand curve.
Unlock Deck
Unlock for access to all 131 flashcards in this deck.
Unlock Deck
k this deck
9
Which of the following is true regarding utility along a price-consumption curve?
A) It is constant.
B) It changes from point to point.
C) It changes only if income changes.
D) It changes only for normal goods.
A) It is constant.
B) It changes from point to point.
C) It changes only if income changes.
D) It changes only for normal goods.
Unlock Deck
Unlock for access to all 131 flashcards in this deck.
Unlock Deck
k this deck
10
The income-consumption curve
A) illustrates the combinations of incomes needed with various levels of consumption of a good.
B) is another name for income-demand curve.
C) illustrates the utility-maximizing combinations of goods associated with every income level.
D) shows the utility-maximizing quantity of some good (on the horizontal axis) as a function of income (on the vertical axis).
Unlock Deck
Unlock for access to all 131 flashcards in this deck.
Unlock Deck
k this deck
11
Which of the following goods is an inferior good in the United States?
A) Health care
B) Entertainment
C) Rental housing
D) all of the above.
A) Health care
B) Entertainment
C) Rental housing
D) all of the above.
Unlock Deck
Unlock for access to all 131 flashcards in this deck.
Unlock Deck
k this deck
12
Figure 4.1.3Refer to Figure 4.1.3 above. The connection of points A and B on the graph yields:
A) a price-consumption curve.
B) an income-consumption curve.
C) an individual demand curve.
D) an Engel curve.
Unlock Deck
Unlock for access to all 131 flashcards in this deck.
Unlock Deck
k this deck
13
Figure 4.1.5Refer to Figure 4.1.5 above. In the upward-sloping portion of the curve that connects points A, B and D, the two goods, food and clothing, are:
A) substitutes.
B) complements
C) independent
D) unrelated
Unlock Deck
Unlock for access to all 131 flashcards in this deck.
Unlock Deck
k this deck
14
An individual demand curve can be derived from the ________ curve.
A) price-consumption
B) price-income
C) income-substitution
D) income-consumption
E) Engel
A) price-consumption
B) price-income
C) income-substitution
D) income-consumption
E) Engel
Unlock Deck
Unlock for access to all 131 flashcards in this deck.
Unlock Deck
k this deck
15
An Engel curve:
A) slopes upward for normal goods and downward for inferior goods.
B) slopes upward for inferior goods and downward for normal goods.
C) slopes upward for both normal and inferior goods.
D) slopes downward for both normal and inferior goods.
A) slopes upward for normal goods and downward for inferior goods.
B) slopes upward for inferior goods and downward for normal goods.
C) slopes upward for both normal and inferior goods.
D) slopes downward for both normal and inferior goods.
Unlock Deck
Unlock for access to all 131 flashcards in this deck.
Unlock Deck
k this deck
16
Figure 4.1.2Refer to Figure 4.1.2. The connection of points B and D forms:
A) a demand curve.
B) an income-consumption curve.
C) a price-consumption curve.
D) a shift from one demand curve.to another.
Unlock Deck
Unlock for access to all 131 flashcards in this deck.
Unlock Deck
k this deck
17
Figure 4.1.5Refer to Figure 4.1.5 above. In the downward-sloping portion of the curve that connects points A, B and D, the two goods, food and clothing, are:
A) substitutes.
B) complements.
C) independent.
D) unrelated.
Unlock Deck
Unlock for access to all 131 flashcards in this deck.
Unlock Deck
k this deck
18
Figure 4.1.4Refer to question 4.1.4 above. Which goods are normal goods?
A) Steak and hamburger
B) Clothing, food and hamburger
C) Clothing, food and steak
D) Clothing and food
Unlock Deck
Unlock for access to all 131 flashcards in this deck.
Unlock Deck
k this deck
19
Figure 4.1.4Refer to Figure 4.1.4 above. The curves that connect points A and B on both graphs are:
A) price-consumption curves.
B) income-consumption curves.
C) Engel curves.
D) individual demand curves.
Unlock Deck
Unlock for access to all 131 flashcards in this deck.
Unlock Deck
k this deck
20
An Engel curve is backward-bending when:
A) the good is inferior after a certain level of income.
B) the good is inferior at low levels of income.
C) the good is inferior for all levels of income.
D) the good is normal above a certain level of income.
A) the good is inferior after a certain level of income.
B) the good is inferior at low levels of income.
C) the good is inferior for all levels of income.
D) the good is normal above a certain level of income.
Unlock Deck
Unlock for access to all 131 flashcards in this deck.
Unlock Deck
k this deck
21
Figure 4.2.1Refer to Figure 4.2.1 above. Starting at point A, which of the following moves represents the total effect of a price change?
A) The move from F1 to E
B) The move from E to F2
C) The move from F1 to F2
D) A move from F1 to F2 and then to E
Unlock Deck
Unlock for access to all 131 flashcards in this deck.
Unlock Deck
k this deck
22
Melissa's optimal consumption is indicated in the diagram below for three different income levels. For Melissa are park visits a normal or inferior good? Explain your answer.
Unlock Deck
Unlock for access to all 131 flashcards in this deck.
Unlock Deck
k this deck
23
Which of the following is true concerning the substitution effect of a decrease in price?
A) It will lead to an increase in consumption only for a normal good.
B) It always will lead to an increase in consumption.
C) It will lead to an increase in consumption only for an inferior good.
D) It will lead to an increase in consumption only for a Giffen good.
A) It will lead to an increase in consumption only for a normal good.
B) It always will lead to an increase in consumption.
C) It will lead to an increase in consumption only for an inferior good.
D) It will lead to an increase in consumption only for a Giffen good.
Unlock Deck
Unlock for access to all 131 flashcards in this deck.
Unlock Deck
k this deck
24
Figure 4.2.2Refer to Figure 4.2.2 above. Starting at point A, which of the following represents the substitution effect of an increase in the price of food?
A) The move from A to B
B) The move from A to C
C) The move from A to B, and then to C
D) The move from A to C, and then to B
Unlock Deck
Unlock for access to all 131 flashcards in this deck.
Unlock Deck
k this deck
25
A change in consumption of a good resulting from an increase in purchasing power, with relative prices held constant, is referred to as:
A) the income effect.
B) the substitution effect.
C) the wealth effect.
D) the total effect of a price change.
A) the income effect.
B) the substitution effect.
C) the wealth effect.
D) the total effect of a price change.
Unlock Deck
Unlock for access to all 131 flashcards in this deck.
Unlock Deck
k this deck
26
The response to a change in the relative prices of goods is called:
A) the income effect.
B) the substitution effect.
C) the wealth effect.
D) the price effect.
A) the income effect.
B) the substitution effect.
C) the wealth effect.
D) the price effect.
Unlock Deck
Unlock for access to all 131 flashcards in this deck.
Unlock Deck
k this deck
27
Figure 4.2.1Refer to Figure 4.2.1 above. Which of the following moves represents the substitution effect?
A) The move from F1 to E
B) The move from E to F2
C) The move from F1 to F2
D) A move from F1 to F2 and then to E
Unlock Deck
Unlock for access to all 131 flashcards in this deck.
Unlock Deck
k this deck
28
Figure 4.2.2Refer to Figure 4.2.2 above. The effect of a decrease in the price of food, as depicted in the figure, leads us to believe that:
A) food in an inferior good and clothing a normal good.
B) food in a normal good and clothing an inferior good.
C) both food and clothing are normal goods.
D) both food and clothing are inferior goods.
Unlock Deck
Unlock for access to all 131 flashcards in this deck.
Unlock Deck
k this deck
29
For an inferior good, the income and substitution effects
A) work together.
B) work against each other.
C) can work together or in opposition to each other depending upon their relative magnitudes.
D) always exactly cancel each other.
A) work together.
B) work against each other.
C) can work together or in opposition to each other depending upon their relative magnitudes.
D) always exactly cancel each other.
Unlock Deck
Unlock for access to all 131 flashcards in this deck.
Unlock Deck
k this deck
30
A Giffen good
A) is always the same as an inferior good.
B) is the special subset of inferior goods in which the substitution effect dominates the income effect.
C) is the special subset of inferior goods in which the income effect dominates the substitution effect.
D) must have a downward sloping demand curve.
A) is always the same as an inferior good.
B) is the special subset of inferior goods in which the substitution effect dominates the income effect.
C) is the special subset of inferior goods in which the income effect dominates the substitution effect.
D) must have a downward sloping demand curve.
Unlock Deck
Unlock for access to all 131 flashcards in this deck.
Unlock Deck
k this deck
31
The change in demand resulting from this change in real purchasing power is called:
A) the income effect.
B) the substitution effect.
C) the wealth effect.
D) the price effect.
A) the income effect.
B) the substitution effect.
C) the wealth effect.
D) the price effect.
Unlock Deck
Unlock for access to all 131 flashcards in this deck.
Unlock Deck
k this deck
32
Figure 4.2.2Refer to Figure 4.2.2 above. Starting from point A, after the price of food decreases,, the quantity of food purchased:
A) increases, due to the income effect but decreases due to the substitution effect.
B) increases, due to the substitution effect but decreases due to the income effect.
C) increases from A to B due to the income effect, and then to C due to the substitution effect.
D) decreases.
Unlock Deck
Unlock for access to all 131 flashcards in this deck.
Unlock Deck
k this deck
33
Using the table below, construct an Engel Curve for each beer type.
Unlock Deck
Unlock for access to all 131 flashcards in this deck.
Unlock Deck
k this deck
34
After a good falls in price, consumers will tend to buy more of the good that has become cheaper and less of those goods that are now relatively more expensive. This fact is called:
A) the income effect.
B) the substitution effect.
C) the wealth effect.
D) the price effect.
A) the income effect.
B) the substitution effect.
C) the wealth effect.
D) the price effect.
Unlock Deck
Unlock for access to all 131 flashcards in this deck.
Unlock Deck
k this deck
35
Assume that beer is a normal good. If the price of beer rises, then the substitution effect results in the person buying ________ of the good and the income effect results in the person buying ________ of the good.
A) more; more
B) more; less
C) less; more
D) less; less
A) more; more
B) more; less
C) less; more
D) less; less
Unlock Deck
Unlock for access to all 131 flashcards in this deck.
Unlock Deck
k this deck
36
After a good falls in price, consumers are better off because they can buy the same amount of the good for less money, and thus have money left over for additional purchases. This fact is called:
A) the income effect.
B) the substitution effect.
C) the wealth effect.
D) the price effect.
A) the income effect.
B) the substitution effect.
C) the wealth effect.
D) the price effect.
Unlock Deck
Unlock for access to all 131 flashcards in this deck.
Unlock Deck
k this deck
37
Figure 4.2.3Refer to Figure 4.2.3 above. The effect of a decrease in the price of food, as depicted in the figure, leads us to believe that:
A) food is an inferior good and clothing a Giffen good.
B) food is a normal good and clothing a Giffen good.
C) food is a Giffen good and clothing a normal good.
D) food is a Giffen good and clothing an inferior good.
Unlock Deck
Unlock for access to all 131 flashcards in this deck.
Unlock Deck
k this deck
38
Figure 4.2.1Refer to Figure 4.2.1 above. Which of the following moves represents the income effect?
A) The move from F1 to E
B) The move from E to F2
C) The move from F1 to F2
D) A move from F1 to F2 and then to E
Unlock Deck
Unlock for access to all 131 flashcards in this deck.
Unlock Deck
k this deck
39
Assume that beer is an inferior good. If the price of beer falls, then the substitution effect results in the person buying ________ of the good and the income effect results in the person buying ________ of the good.
A) more; more
B) more; less
C) less; more
D) less; less
A) more; more
B) more; less
C) less; more
D) less; less
Unlock Deck
Unlock for access to all 131 flashcards in this deck.
Unlock Deck
k this deck
40
A change in consumption of a good associated with a change in its price, with the level of utility held constant, is referred to as:
A) the income effect.
B) the substitution effect.
C) the wealth effect.
D) the total effect of a price change.
A) the income effect.
B) the substitution effect.
C) the wealth effect.
D) the total effect of a price change.
Unlock Deck
Unlock for access to all 131 flashcards in this deck.
Unlock Deck
k this deck
41
Suppose the price of rice increases and you view rice as an inferior good. The substitution effect results in a ________ change in rice consumption, and the income effect leads to a ________ change in rice consumption.
A) positive; positive
B) positive; negative
C) negative; positive
D) negative; negative
A) positive; positive
B) positive; negative
C) negative; positive
D) negative; negative
Unlock Deck
Unlock for access to all 131 flashcards in this deck.
Unlock Deck
k this deck
42
Scenario 4.1:
Daniel derives utility from only two goods, cake (Qc) and donuts (Qd). The marginal utility that Daniel receives from cake (MUc) and donuts (MUd) are given as follows:
MUc = Qd MUd = Qc
Daniel has an income of $240 and the price of cake (Pc) and donuts (Pd) are both $3.
See Scenario 4.1. What is Daniel's income-consumption curve?
A) Pc = Pd
B) Pc = Qc
C) Qd = I - 3Qc
D) Qc = Qd
E) all of the above
Unlock Deck
Unlock for access to all 131 flashcards in this deck.
Unlock Deck
k this deck
43
Scenario 4.1:
Daniel derives utility from only two goods, cake (Qc) and donuts (Qd). The marginal utility that Daniel receives from cake (MUc) and donuts (MUd) are given as follows:
MUc = Qd MUd = Qc
Daniel has an income of $240 and the price of cake (Pc) and donuts (Pd) are both $3.
See Scenario 4.1. What is Daniel's budget constraint?
A) 240 = 3Pc + 3Pd
B) 240 = 3Qc + 3Qd
C) 240 = (Pc)(Qc)
D) 240 = (Qc)(Qd)
E) none of the above
Unlock Deck
Unlock for access to all 131 flashcards in this deck.
Unlock Deck
k this deck
44
Scenario 4.1:
Daniel derives utility from only two goods, cake (Qc) and donuts (Qd). The marginal utility that Daniel receives from cake (MUc) and donuts (MUd) are given as follows:
MUc = Qd MUd = Qc
Daniel has an income of $240 and the price of cake (Pc) and donuts (Pd) are both $3.
See Scenario 4.1. What quantity Qc will maximize Daniel's utility given the information above?
A) 0
B) 24
C) 40
D) 60
E) none of the above
Unlock Deck
Unlock for access to all 131 flashcards in this deck.
Unlock Deck
k this deck
45
When demand is elastic, an increase in price causes the seller's total revenue to:
A) increase.
B) decrease.
C) remain the same.
D) fall to zero.
A) increase.
B) decrease.
C) remain the same.
D) fall to zero.
Unlock Deck
Unlock for access to all 131 flashcards in this deck.
Unlock Deck
k this deck
46
Figure 4.3.1Refer to Figure 4.3.1 above. The figure depicts the individual demands of the only three consumers in the market for good X. After constructing the market demand curve, we determine that quantity demanded at a price of $10.000 is:
A) 15 units.
B) 17 units.
C) 30.000 units.
D) none of the above
Unlock Deck
Unlock for access to all 131 flashcards in this deck.
Unlock Deck
k this deck
47
Scenario 4.1:
Daniel derives utility from only two goods, cake (Qc) and donuts (Qd). The marginal utility that Daniel receives from cake (MUc) and donuts (MUd) are given as follows:
MUc = Qd MUd = Qc
Daniel has an income of $240 and the price of cake (Pc) and donuts (Pd) are both $3.
See Scenario 4.1. Holding Daniel's income and Pd constant at $240 and $3 respectively, what is Daniel's demand curve for cake?
A) Qc = 240 - Pc
B) Qc = 240/Pc
C) Qc = 120/Pc
D) Qc = 240/(3 + Pc)
E) none of the above
Unlock Deck
Unlock for access to all 131 flashcards in this deck.
Unlock Deck
k this deck
48
The horizontal summation of the demands of each consumer at different price levels is called:
A) the market demand curve.
B) the price elasticity of market demand.
C) speculative demand.
D) consumer surplus.
A) the market demand curve.
B) the price elasticity of market demand.
C) speculative demand.
D) consumer surplus.
Unlock Deck
Unlock for access to all 131 flashcards in this deck.
Unlock Deck
k this deck
49
Scenario 4.2:
Suppose that the demand for artichokes (Qa) is given as:
Qa = 200 - 4P
Use the information in Scenario 4.2. Suppose that the price of artichokes is increased slightly from $10. The total expenditure by consumers on artichokes will ________ and the number of artichokes sold will ________.
A) rise; rise
B) rise; fall
C) fall; rise
D) fall; fall
Unlock Deck
Unlock for access to all 131 flashcards in this deck.
Unlock Deck
k this deck
50
Figure 4.3.2Refer to Figure 4.3.2 above. How do total expenditures on movie tickets vary along the demand curve?
A) Since quantity demanded increases as price decreases, total expenditures increase.
B) Since the quantity is sold at lower and lower prices, total expenditures decrease as quantity demanded increases.
C) Total expenditures remain the same between points along the demand curve.
D) Total expenditures increase through the upper portion of the curve and then decrease at low price levels.
Unlock Deck
Unlock for access to all 131 flashcards in this deck.
Unlock Deck
k this deck
51
Figure 4.3.1Price elasticity of demand measures the:
A) slope of the demand curve.
B) sensitivity of quantity demanded to changes in the price of substitute goods.
C) sensitivity of price to changes in the quantity demanded of substitute goods.
D) sensitivity of quantity demanded to changes in price.
Unlock Deck
Unlock for access to all 131 flashcards in this deck.
Unlock Deck
k this deck
52
You have just won a cash award of $500 for academic excellence.
A) The substitution effect of this award will be larger than its income effect.
B) The income effect of this award will be larger than its substitution effect.
C) The substitution and income effects will be of identical size.
D) It is impossible to know whether the substitution effect is larger than the income effect or vice versa.
Unlock Deck
Unlock for access to all 131 flashcards in this deck.
Unlock Deck
k this deck
53
When demand is inelastic, an increase in price causes the seller's total revenues to:
A) increase.
B) decrease.
C) remain the same.
D) fall to zero.
A) increase.
B) decrease.
C) remain the same.
D) fall to zero.
Unlock Deck
Unlock for access to all 131 flashcards in this deck.
Unlock Deck
k this deck
54
Figure 4.3.2Refer to Figure 4.3.2 above. The elasticity of the demand for the curve in the figure can be described as:
A) elastic in the upper portions of the curve and inelastic in the lower portions.
B) a special case of an isoelastic curve called the unit-elastic demand curve.
C) elastic throughout the curve.
D) inelastic throughout the curve.
Unlock Deck
Unlock for access to all 131 flashcards in this deck.
Unlock Deck
k this deck
55
Figure 4.3.1Aggregation examples of market demand could include:
A) the demand for home computers by households with or without children.
B) the domestic and foreign demand for wheat.
C) the demands of different demographic groups.
D) all of the above
Unlock Deck
Unlock for access to all 131 flashcards in this deck.
Unlock Deck
k this deck
56
When demand is elastic, an increase in price leads to:
A) an increase in total expenditures.
B) a decrease in total expenditures.
C) no change in total expenditures.
D) an undetermined change in expenditures.
A) an increase in total expenditures.
B) a decrease in total expenditures.
C) no change in total expenditures.
D) an undetermined change in expenditures.
Unlock Deck
Unlock for access to all 131 flashcards in this deck.
Unlock Deck
k this deck
57
The domestic demand for wheat is QDD = 1000 - 25P, and the export demand is QDE = 500 - 25P. Graph the domestic, export, and total demand curves for wheat.
Unlock Deck
Unlock for access to all 131 flashcards in this deck.
Unlock Deck
k this deck
58
Scenario 4.2:
Suppose that the demand for artichokes (Qa) is given as:
Qa = 200 - 4P
Use the information in Scenario 4.2. What is the price elasticity of demand if the price of artichokes is $10?
A) 0
B) -0.25
C) -1
D) -4
E) negative infinity
Suppose that the demand for artichokes (Qa) is given as:
Qa = 200 - 4P
Use the information in Scenario 4.2. What is the price elasticity of demand if the price of artichokes is $10?
A) 0
B) -0.25
C) -1
D) -4
E) negative infinity
Unlock Deck
Unlock for access to all 131 flashcards in this deck.
Unlock Deck
k this deck
59
When demand is inelastic, an increase in price leads to:
A) an increase in total expenditures.
B) a decrease in total expenditures.
C) no change in total expenditures.
D) an undetermined change in expenditures.
A) an increase in total expenditures.
B) a decrease in total expenditures.
C) no change in total expenditures.
D) an undetermined change in expenditures.
Unlock Deck
Unlock for access to all 131 flashcards in this deck.
Unlock Deck
k this deck
60
Donald derives utility from only two goods, carrots (Qc) and donuts (Qd). His utility function is as follows:
U(Qc,Qd) = (Qc)(Qd)
The marginal utility that Donald receives from carrots (MUc) and donuts (MUd) are given as follows:
MUc = Qd MUd = Qc
Donald has an income (I) of $120 and the price of carrots (Pc) and donuts (Pd) are both $1.
a. What is Donald's budget line?
b. What is Donald's income-consumption curve?
c. What quantities of Qc and Qd will maximize Donald's utility?
d. Holding Donald's income and Pd constant at $120 and $1 respectively, what is Donald's demand curve for carrots?
e. Suppose that a tax of $1 per unit is levied on donuts. How will this alter Donald's utility maximizing market basket of goods?
f. Suppose that, instead of the per unit tax in (e), a lump sum tax of the same dollar amount is levied on Donald. What is Donald's utility maximizing market basket?
g. The taxes in (e) and (f) both collect exactly the same amount of revenue for the government, which of the two taxes would Donald prefer? Show your answer numerically and explain why Donald prefers the per unit tax over the lump sum tax, or vice versa, or why he is indifferent between the two taxes.
Unlock Deck
Unlock for access to all 131 flashcards in this deck.
Unlock Deck
k this deck
61
The demand for telephone wire can be expressed as:
Q = 6000 - 1,500P,
where Q represents units, in pounds per day, and P represents price, in dollars per pound. Determine the price elasticity of demand at per pound.
Q = 6000 - 1,500P,
where Q represents units, in pounds per day, and P represents price, in dollars per pound. Determine the price elasticity of demand at
per pound. Unlock Deck
Unlock for access to all 131 flashcards in this deck.
Unlock Deck
k this deck
62
The table below lists the demand curve for sleeves of tennis balls for each member of the Parker family. Use this information to determine the Parker's aggregate family demand for tennis balls. What is the price elasticity of demand for each member of the family at $2.00? What is the price elasticity of family aggregate demand at $2.00?
Unlock Deck
Unlock for access to all 131 flashcards in this deck.
Unlock Deck
k this deck
63
General Motors estimates that U.S. demand for its newest product will be: Export demand will be The total market demand curve for this product will be a:
A) straight line with a slope of -0.5.
B) straight line with a slope of -1.0.
C) kinked line with the kink at Q = 25,000.
D) kinked line with the kink at P = 50,000.
E) none of the above
Export demand will be The total market demand curve for this product will be a:A) straight line with a slope of -0.5.
B) straight line with a slope of -1.0.
C) kinked line with the kink at Q = 25,000.
D) kinked line with the kink at P = 50,000.
E) none of the above
Unlock Deck
Unlock for access to all 131 flashcards in this deck.
Unlock Deck
k this deck
64
Fill in the blanks. Poorer countries have a ________ demand for U.S. wheat because they usually ________.
A) less elastic; find other substitutes
B) less elastic; can't find other substitutes
C) more elastic; can't find other substitutes
D) more elastic; find other substitutes
A) less elastic; find other substitutes
B) less elastic; can't find other substitutes
C) more elastic; can't find other substitutes
D) more elastic; find other substitutes
Unlock Deck
Unlock for access to all 131 flashcards in this deck.
Unlock Deck
k this deck
65
Recent research estimates that the short-run price elasticity of demand for gasoline in the U.S. is -0.3, and the long-run price elasticity of demand is -1.4. What happens if the government increases the federal gasoline tax?
A) Consumer expenditures on gasoline increase over the short run and long run.
B) Consumer expenditures on gasoline decline over the short run and increase over the long run.
C) Consumer expenditures on gasoline increase over the short run and decline over the long run.
D) Consumer expenditures on gasoline decrease over the short run and long run.
Unlock Deck
Unlock for access to all 131 flashcards in this deck.
Unlock Deck
k this deck
66
Sally Henin has a price elasticity of demand for gasoline of -0.8. Her income elasticity for gasoline is 0.5. Sally's current income is $40,000 per year. Sally currently spends $800 per year on gasoline. The price of gasoline is currently $1.00 per gallon.
a. A contemplated excise tax on gasoline will cause the price of gasoline to rise to $1.40. What impact will the tax have on Sally's consumption of gasoline?
b. Since the purpose of the tax is only to discourage gasoline consumption, Congress is considering a $200 income tax rebate to lessen the burden of the gasoline tax. What impact will the rebates have on Sally's consumption of gasoline?
c. Assume that both the tax and rebate are implemented. Will Sally be worse off or better off?
Unlock Deck
Unlock for access to all 131 flashcards in this deck.
Unlock Deck
k this deck
67
Figure 4.4.2Refer to Figure 4.4.2 above. The consumer surplus derived from pizza consumption is:
A) $1500.
B) $2000.
C) $3000.
D) $3500.
Unlock Deck
Unlock for access to all 131 flashcards in this deck.
Unlock Deck
k this deck
68
Harding Enterprises has developed a new product called the Gillooly shillelagh. The market demand for this product is given as follows:
Q = 240 - 4P
a. If the shillelagh is priced at $40, what is the point price elasticity of demand? Is demand elastic or inelastic?
b. If the shillelagh price is increased slightly from $40, what will happen to the total expenditure on the Gillooly shillelagh?
Q = 240 - 4P
a. If the shillelagh is priced at $40, what is the point price elasticity of demand? Is demand elastic or inelastic?
b. If the shillelagh price is increased slightly from $40, what will happen to the total expenditure on the Gillooly shillelagh?
Unlock Deck
Unlock for access to all 131 flashcards in this deck.
Unlock Deck
k this deck
69
A local retailer has decided to carry a well-known brand of shampoo. The marketing department tells them that the quarterly demand by an average man is: Qd = 3 - 0.25P
And the quarterly demand by an average woman is:
Qd = 4 - 0.5P
The market consists of 10,000 men and 10,000 women. How may bottles of shampoo can they expect to sell if they charge $6 per bottle?
A) 20,000
B) 33,000
C) 25,000
D) 10,000
E) none of the above
And the quarterly demand by an average woman is:
Qd = 4 - 0.5P
The market consists of 10,000 men and 10,000 women. How may bottles of shampoo can they expect to sell if they charge $6 per bottle?
A) 20,000
B) 33,000
C) 25,000
D) 10,000
E) none of the above
Unlock Deck
Unlock for access to all 131 flashcards in this deck.
Unlock Deck
k this deck
70
A study of the per capita consumption of gasoline: in 10 countries demonstrates that:
A) the consumption of gasoline does not appear to be related to the price of gasoline.
B) higher gasoline prices do result in lower consumption of gasoline.
C) higher gasoline prices actually increase the consumption of gasoline.
D) higher gasoline prices reduce consumption in some of those countries, but not in others.
Unlock Deck
Unlock for access to all 131 flashcards in this deck.
Unlock Deck
k this deck
71
Figure 4.4.2Refer to Figure 4.4.2 above. The total weekly expenditure on pizza is:
A) $1500.
B) $2000.
C) $3000.
D) $3500.
Unlock Deck
Unlock for access to all 131 flashcards in this deck.
Unlock Deck
k this deck
72
The world demand for power transmission wire is made up of both domestic and foreign demands. Thus, the total demand is the sum of the two sub-demands, which are given as:
Domestic demand: Pd = 5 - 0.005Qd
Foreign demand: Pf = 3 - 0.00075Qf,
where Pd and Pf are in dollars per pound, and Qd and Qf are in pounds per day.
a. Determine the world demand for power transmission wire.
b. Determine the prices at which domestic and foreign buyers would enter the market.
c. Determine the domestic and foreign quantities at per pound. Check to see if the sum of Qd and Qf equals Q.
d. Determine total rate of purchases at per pound.
Domestic demand: Pd = 5 - 0.005Qd
Foreign demand: Pf = 3 - 0.00075Qf,
where Pd and Pf are in dollars per pound, and Qd and Qf are in pounds per day.
a. Determine the world demand for power transmission wire.
b. Determine the prices at which domestic and foreign buyers would enter the market.
c. Determine the domestic and foreign quantities at
per pound. Check to see if the sum of Qd and Qf equals Q.d. Determine total rate of purchases at
per pound. Unlock Deck
Unlock for access to all 131 flashcards in this deck.
Unlock Deck
k this deck
73
The area below the demand curve and above the price line measures:
A) consumer surplus.
B) economic profit.
C) elasticity of demand.
D) the total value obtained from consuming the good or service.
A) consumer surplus.
B) economic profit.
C) elasticity of demand.
D) the total value obtained from consuming the good or service.
Unlock Deck
Unlock for access to all 131 flashcards in this deck.
Unlock Deck
k this deck
74
Figure 4.4.1Refer to Figure 4.4.1 above. The value of consumer surplus when price is $4 equals:
A) $21.
B) $24.
C) $45.
D) none of the above
Unlock Deck
Unlock for access to all 131 flashcards in this deck.
Unlock Deck
k this deck
75
Which of the following is an example of speculative demand?
A) When the actual price of housing increases, the quantity demanded of housing decreases.
B) When the expected price of housing increases, the demand for housing increases.
C) When the price of home ownership increases, the demand for rental housing increases.
D) When the demand for housing increases, the demand for house insurance increases.
Unlock Deck
Unlock for access to all 131 flashcards in this deck.
Unlock Deck
k this deck
76
Joe's Pig Palace sells barbecue plates for $4.50 each, and serves an average of 525 customers per week. During a recent promotion, Joe cut his price to $3.50 and observed an increase in sales to 600 plates per week.
a. Calculate Joe's arc price elasticity of demand.
b. Joe is considering permanently lowering his price to $4.00 to increase revenue. How many plates should Joe expect to sell at the new price? Does the move make sense in the light of Joe's desire to increase revenue?
a. Calculate Joe's arc price elasticity of demand.
b. Joe is considering permanently lowering his price to $4.00 to increase revenue. How many plates should Joe expect to sell at the new price? Does the move make sense in the light of Joe's desire to increase revenue?
Unlock Deck
Unlock for access to all 131 flashcards in this deck.
Unlock Deck
k this deck
77
The difference between what a consumer is willing to pay for a unit of a good and what must be paid when actually buying it is called:
A) producer surplus.
B) consumer surplus.
C) cost benefit analysis.
D) net utility.
A) producer surplus.
B) consumer surplus.
C) cost benefit analysis.
D) net utility.
Unlock Deck
Unlock for access to all 131 flashcards in this deck.
Unlock Deck
k this deck
78
Figure 4.4.3Refer to Figure 4.4.3 above. When the price of pizza is $20, total expenditure and consumer surplus are, respectively:
A) $2000; $2000.
B) $1000; $2000.
C) $2000; $1000.
D) $1000; $1000.
Unlock Deck
Unlock for access to all 131 flashcards in this deck.
Unlock Deck
k this deck
79
Suppose that the demand for artichokes (Qa) is given as:
Qa = 120 - 4P
a. What is the point price elasticity of demand if the price of artichokes is $10?
b. Suppose that the price of artichokes increases to $12. What will happen to the number of artichokes sold and the total expenditure by consumers on artichokes?
c. At what price if any is the demand for artichokes infinitely elastic?
Unlock Deck
Unlock for access to all 131 flashcards in this deck.
Unlock Deck
k this deck
80
Answer both parts of the following question.
a. The San Francisco Chronicle reported that the toll on the Golden Gate Bridge was raised from $2 to $3. Following the toll increase, traffic fell by 5 percent. Based on this information, calculate the point price elasticity of demand. Is demand elastic or inelastic? Explain.
b. Stephen Leonoudakis, chairman of the bridge's finance auditing committee, warned that the toll increase could cause toll revenues to decrease by $2.8 million per year. Is this statement consistent with economic theory? Explain.
Unlock Deck
Unlock for access to all 131 flashcards in this deck.
Unlock Deck
k this deck
Unlock Deck
Unlock for access to all 131 flashcards in this deck.


