Deck 22: Consumer Preferences and Consumer Choice
Full screen (f)
Question
Question
Question
Question
Question
Question
Use the following to answer question: 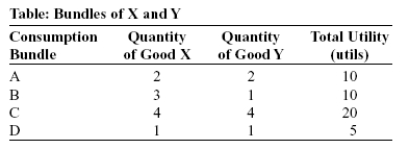
(Table: Bundles of X and Y)Use Table Bundles of X and Y.Bundle(s):
A)A and B are on the same indifference curve.
B)A and C are on the same indifference curve.
C)D is on the highest indifference curve.
D)C is on the highest indifference curve,and bundles A and B are on the lowest indifference curve.
(Table: Bundles of X and Y)Use Table Bundles of X and Y.Bundle(s):
A)A and B are on the same indifference curve.
B)A and C are on the same indifference curve.
C)D is on the highest indifference curve.
D)C is on the highest indifference curve,and bundles A and B are on the lowest indifference curve.
Question
Question
Question
Question
Question
Use the following to answer question:
(Table: Bundles of X and Y)Use Table Bundles of X and Y.According to the table:
A)bundle D is preferred to bundles A and B.
B)the consumer is indifferent among bundles A,B,and C.
C)bundles C and D are both preferred to bundles A and B.
D)bundle C is preferred to all other bundles.
(Table: Bundles of X and Y)Use Table Bundles of X and Y.According to the table:
A)bundle D is preferred to bundles A and B.
B)the consumer is indifferent among bundles A,B,and C.
C)bundles C and D are both preferred to bundles A and B.
D)bundle C is preferred to all other bundles.
Question
Question
Question
Question
(Figure and Table: Indifference Curve Map)Use Figure and Table An Indifference Curve Map.Combination _____ is preferred to combination _____. 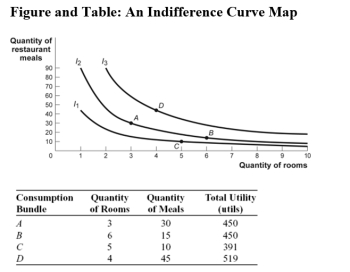
A)A;B
B)B;D
C)C;A
D)B;C
A)A;B
B)B;D
C)C;A
D)B;C
Question
Question
Question
Question
Question
Question
Question
Question
Use the following to answer question: 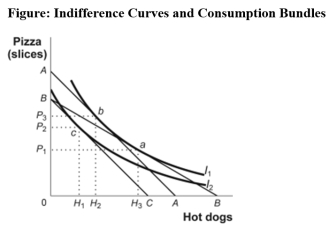
(Figure: Indifference Curves and Consumption Bundles)Use Figure Indifference Curves and Consumption Bundles.In the figure,the initial optimum is at a.The price of hot dogs increases,and the new equilibrium point is c.The change in hot dog consumption due to the income effect of the price change is:
A)H3 to H2.
B)H3 to H1.
C)H2 to H1.
D)H1 to H2.
Question
Use the following to answer question: 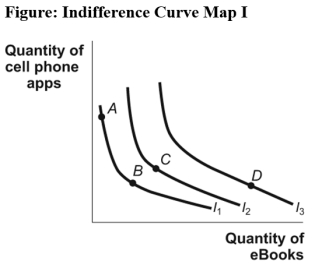
(Figure: Indifference Curve Map I)Use Figure Indifference Curve Map I.It shows that:
A)bundles B and D provide the same level of utility.
B)bundle A is preferred to bundle B.
C)bundle D is preferred to bundle C,which is preferred to bundles A and B.
D)bundle C provides the highest level of utility.
(Figure: Indifference Curve Map I)Use Figure Indifference Curve Map I.It shows that:
A)bundles B and D provide the same level of utility.
B)bundle A is preferred to bundle B.
C)bundle D is preferred to bundle C,which is preferred to bundles A and B.
D)bundle C provides the highest level of utility.
Question
Question
Use the following to answer question:
(Figure: Indifference Curves and Consumption Bundles)Use Figure Indifference Curves and Consumption Bundles.For this consumer pizza is a(n)_____ good and hot dogs are a(n)_____ good.
A)normal;inferior
B)inferior;normal
C)normal;normal
D)inferior;inferior
(Figure: Indifference Curves and Consumption Bundles)Use Figure Indifference Curves and Consumption Bundles.For this consumer pizza is a(n)_____ good and hot dogs are a(n)_____ good.
A)normal;inferior
B)inferior;normal
C)normal;normal
D)inferior;inferior
Question
Use the following to answer question:
(Figure: Indifference Curves and Consumption Bundles)Use Figure Indifference Curves and Consumption Bundles.The lines AA and BC are parallel.The optimal consumption point could shift from b to c as a result of any of the following EXCEPT:
A)an equal percentage increase in the prices of hot dogs and pizza while income is unchanged.
B)a decrease in income with prices constant.
C)a change in tastes.
D)an equal percentage increase in the prices of hot dogs and pizza while income is unchanged or a decrease in income with prices constant.
Question
Question
Question
Question
Use the following to answer question:
(Figure: Indifference Curve Map I)Use Figure Indifference Curve Map I.It shows that:
A)at point A utility is higher than it is at point B.
B)utility is diminishing on I1,constant on I2,and increasing on I3.
C)utility is higher at point D than at point A.
D)the marginal utility of e-books is positive,while the marginal utility of cell phone apps is negative.
Question
Question
Question
Question
Question
Question
Question
Question
Question
Question
Use the following to answer question: 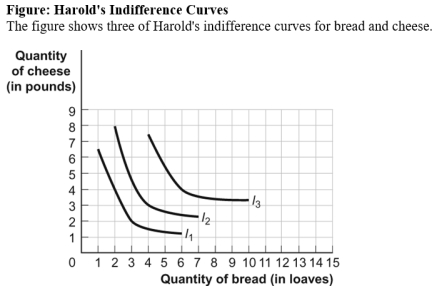
(Figure: Harold's Indifference Curves)Use Figure Harold's Indifference Curves.Given that the price of bread is $1 per loaf and the price of cheese is $2 per pound,as Harold's income increases from $10 to $14,we can determine that bread is a(n)_____ good and cheese is a(n)_____ good.
A)inferior;inferior
B)normal;inferior
C)inferior;normal
D)normal;normal
Question
Use the following to answer question: 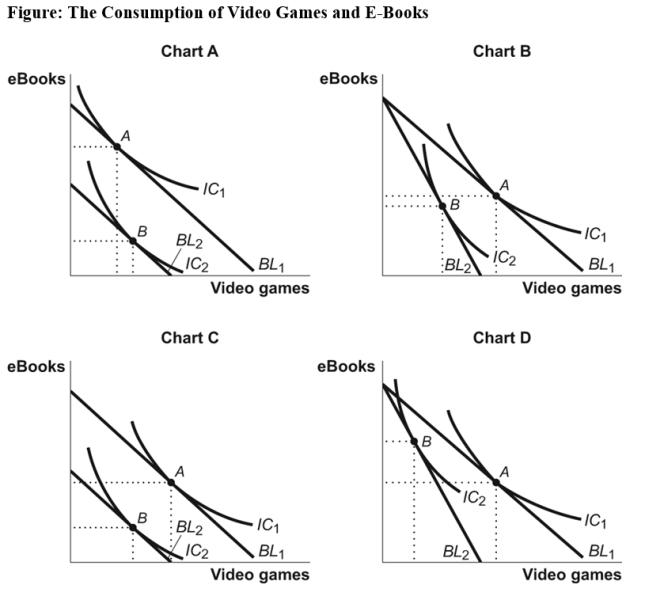
(Figure: The Consumption of Video Games and E-Books)Use Figure The Consumption of Video Games and E-Books.Which chart shows the effects of a decrease in income when video games are an inferior good and e-books are a normal good?
A)A
B)B
C)C
D)D
(Figure: The Consumption of Video Games and E-Books)Use Figure The Consumption of Video Games and E-Books.Which chart shows the effects of a decrease in income when video games are an inferior good and e-books are a normal good?
A)A
B)B
C)C
D)D
Question
Use the following to answer question: 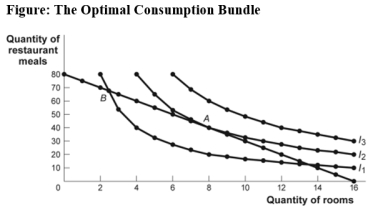
(Figure: The Optimal Consumption Bundle)Use Figure The Optimal Consumption Bundle.Which of the following could lead to an optimal consumption bundle on indifference curve I1?
A)an increase in income
B)a decrease in the price of restaurant meals
C)a decrease in the price of rooms
D)a decrease in income
Question
Use the following to answer question:
(Figure: Harold's Indifference Curves)Use Figure Harold's Indifference Curves.If the price of bread is $1 per loaf,the price of cheese is $2 per pound,and Harold has $10 to spend on bread and cheese,Harold's optimal consumption bundle is _____ loaves of bread and _____ pounds of cheese.
A)6;4
B)4;3
C)3;2
D)2;8
Question
Use the following to answer question:
(Figure: Harold's Indifference Curves)Use Figure Harold's Indifference Curves.The price of cheese is $2 per pound and Harold has $10 to spend on bread and cheese.As the price of bread rises from $1 to $2 per loaf,his consumption of bread: change?
A)increases from 2 to 3 loaves.
B)decreases from 3 to 2 loaves.
C)increases from 3 to 4 loaves.
D)decreases from 4 to 3 loaves.
Question
Use the following to answer question:
(Figure: Harold's Indifference Curves)Use Figure Harold's Indifference Curves.If the price of bread is $2 per loaf,the price of cheese is $2 per pound,and Harold has $10 to spend on bread and cheese,Harold's optimal consumption bundle is _____ loaves of bread and _____ pounds of cheese.
A)6;4
B)4;3
C)3;2
D)2;8
Question
Use the following to answer question:
(Figure: The Optimal Consumption Bundle)Use Figure The Optimal Consumption Bundle.Which of the following could lead to an optimal consumption bundle on indifference curve I1?
A)an increase in income
B)an increase in the price of restaurant meals
C)a decrease in the price of rooms
D)a decrease in the price of restaurant meals
Question
Use the following to answer question:
(Figure: Harold's Indifference Curves)Use Figure Harold's Indifference Curves.If the price of bread is $1 per loaf,the price of cheese is $2 per pound,and Harold has $14 to spend on bread and cheese,Harold's optimal consumption bundle is _____ loaves of bread and _____ pounds of cheese.
A)6;4
B)4;3
C)3;2
D)2;8
Question
Use the following to answer question: 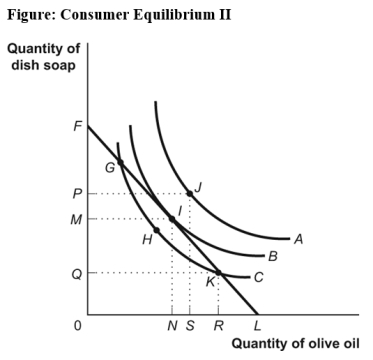
(Figure: Consumer Equilibrium II)Use Figure Consumer Equilibrium II.The HIGHEST level of total utility is associated with point _____ on indifference curve _____.
A)H;C
B)I;B
C)G;B
D)J;A
(Figure: Consumer Equilibrium II)Use Figure Consumer Equilibrium II.The HIGHEST level of total utility is associated with point _____ on indifference curve _____.
A)H;C
B)I;B
C)G;B
D)J;A
Question
Use the following to answer question:
(Figure: The Optimal Consumption Bundle)Use Figure The Optimal Consumption Bundle.Which of the following could lead to an optimal consumption bundle on indifference curve I3?
A)an increase in income
B)an increase in the price of restaurant meals
C)an increase in the price of rooms
D)a decrease in income
Question
Use the following to answer question:
(Figure: The Consumption of Video Games and E-Books)Use Figure The Consumption of Video Games and E-Books.Which chart in the figure shows the effects of an increase in the price of video games when video games and e-books are complements but not perfect complements?
A)A
B)B
C)C
D)D
(Figure: The Consumption of Video Games and E-Books)Use Figure The Consumption of Video Games and E-Books.Which chart in the figure shows the effects of an increase in the price of video games when video games and e-books are complements but not perfect complements?
A)A
B)B
C)C
D)D
Question
Use the following to answer question:
(Figure: Indifference Curves and Consumption Bundles)Use Figure Indifference Curves and Consumption Bundles.In the figure,the initial optimum is at a.The price of hot dogs now increases.The change in hot dog consumption due to the substitution effect is:
A)H3 to H2.
B)H3 to H1.
C)H2 to H1.
D)H1 to H2.
Question
Use the following to answer question:
(Figure: The Consumption of Video Games and E-Books)Use Figure The Consumption of Video Games and E-Books.Which chart shows the effects of an increase in the price of video games when video games and e-books are substitutes but not perfect substitutes?
A)A
B)B
C)C
D)D
(Figure: The Consumption of Video Games and E-Books)Use Figure The Consumption of Video Games and E-Books.Which chart shows the effects of an increase in the price of video games when video games and e-books are substitutes but not perfect substitutes?
A)A
B)B
C)C
D)D
Question
Use the following to answer question:
(Figure: The Optimal Consumption Bundle)Use Figure The Optimal Consumption Bundle.If the price of restaurant meals _____,then the optimal consumption bundle will be on _____ indifference curve.
A)increases;a higher
B)decreases;a higher
C)decreases;a lower
D)increases;the same
(Figure: The Optimal Consumption Bundle)Use Figure The Optimal Consumption Bundle.If the price of restaurant meals _____,then the optimal consumption bundle will be on _____ indifference curve.
A)increases;a higher
B)decreases;a higher
C)decreases;a lower
D)increases;the same
Question
Use the following to answer question:
(Figure: The Optimal Consumption Bundle)Use Figure The Optimal Consumption Bundle.Which of the following could lead to an optimal consumption bundle on indifference curve I3?
A)a decrease in income
B)an increase in the price of restaurant meals
C)a decrease in the price of rooms
D)an increase in the price of rooms
Question
Use the following to answer question:
(Figure: Harold's Indifference Curves)Use Figure Harold's Indifference Curves.If the price of cheese is $2 per pound and Harold has $10 to spend on bread and cheese,Harold _____ his consumption of cheese as the price of bread rises from $1 per loaf to $2 per loaf,indicating that bread and cheese are _____.
A)increases;substitutes
B)increases;complements
C)decreases;substitutes
D)decreases;complements
Question
Use the following to answer question:
(Figure: The Consumption of Video Games and E-Books)Use Figure The Consumption of Video Games and E-Books.Which chart shows the effect of a decrease in income when both video games and e-books are normal goods?
A)A
B)B
C)C
D)D
(Figure: The Consumption of Video Games and E-Books)Use Figure The Consumption of Video Games and E-Books.Which chart shows the effect of a decrease in income when both video games and e-books are normal goods?
A)A
B)B
C)C
D)D
Question
Use the following to answer question:
(Figure: Harold's Indifference Curves)Use Figure Harold's Indifference Curves.If the price of bread is $0.50 per loaf,the price of cheese is $1 per pound,and Harold has $7 to spend on bread and cheese,Harold's optimal consumption bundle is _____ loaves of bread and _____ pounds of cheese.
A)6;4
B)4;3
C)3;2
D)2;8
Question
Use the following to answer question:
(Figure: The Optimal Consumption Bundle)Use Figure The Optimal Consumption Bundle.Which of the following could lead to an optimal consumption bundle on indifference curve I3?
A)a decrease in income
B)a decrease in the price of restaurant meals
C)an increase in the price of rooms
D)an increase in the price of restaurant meals
Question
Use the following to answer question:
(Figure: Harold's Indifference Curves)Use Figure Harold's Indifference Curves.If the price of bread is $2 per loaf,the price of cheese is $4 per pound,and Harold has $28 to spend on bread and cheese,Harold's optimal consumption bundle is _____ loaves of bread and _____ pounds of cheese.
A)6;4
B)4;3
C)3;2
D)2;8
Question
Use the following to answer question:
(Figure: Consumer Equilibrium II)Use Figure Consumer Equilibrium II.Ashyra would maximize her utility at point _____ with the consumption of _____ olive oil and _____ dish soap.
A)J;S;P
B)I;S;P
C)J;N;F
D)I;N;M
(Figure: Consumer Equilibrium II)Use Figure Consumer Equilibrium II.Ashyra would maximize her utility at point _____ with the consumption of _____ olive oil and _____ dish soap.
A)J;S;P
B)I;S;P
C)J;N;F
D)I;N;M
Question
Use the following to answer question: 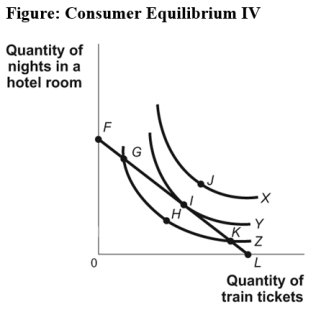
(Figure: Consumer Equilibrium IV)Use Figure Consumer Equilibrium IV.The lowest level of utility shown in the figure is associated with indifference curve:
A)X.
B)Y.
C)Z.
D)X or Y.
(Figure: Consumer Equilibrium IV)Use Figure Consumer Equilibrium IV.The lowest level of utility shown in the figure is associated with indifference curve:
A)X.
B)Y.
C)Z.
D)X or Y.
Question
Use the following to answer question:
(Figure: Consumer Equilibrium II)Use Figure Consumer Equilibrium II.A level of total utility NOT attainable is at point:
A)G.
B)K.
C)I.
D)J.
(Figure: Consumer Equilibrium II)Use Figure Consumer Equilibrium II.A level of total utility NOT attainable is at point:
A)G.
B)K.
C)I.
D)J.
Question
Use the following to answer question: 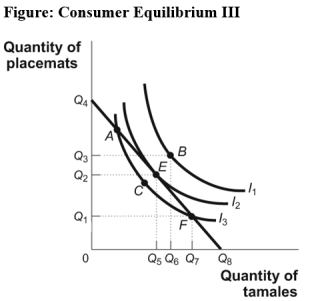
(Figure: Consumer Equilibrium III)Use Figure Consumer Equilibrium III.Which of the following statements is TRUE?
A)Q4 indicates the price of placemats.
B)Q8 indicates the price of tamales.
C)Points A and E represent the same level of total utility.
D)Kurt is better off at point E than at point A.
(Figure: Consumer Equilibrium III)Use Figure Consumer Equilibrium III.Which of the following statements is TRUE?
A)Q4 indicates the price of placemats.
B)Q8 indicates the price of tamales.
C)Points A and E represent the same level of total utility.
D)Kurt is better off at point E than at point A.
Question
Use the following to answer question:
(Figure: Consumer Equilibrium II)Use Figure Consumer Equilibrium II.The LOWEST level of total utility shown in the figure is associated with point _____ on curve _____.
A)H;A
B)I;B
C)G;C
D)J;A
(Figure: Consumer Equilibrium II)Use Figure Consumer Equilibrium II.The LOWEST level of total utility shown in the figure is associated with point _____ on curve _____.
A)H;A
B)I;B
C)G;C
D)J;A
Question
Use the following to answer question:
(Figure: Consumer Equilibrium III)Use Figure Consumer Equilibrium III.The lowest level of total utility at which Ivan still spends all of his income is associated with point _____ on _____.
A)A;I3
B)C;I3
C)E;I2
D)B;I1
(Figure: Consumer Equilibrium III)Use Figure Consumer Equilibrium III.The lowest level of total utility at which Ivan still spends all of his income is associated with point _____ on _____.
A)A;I3
B)C;I3
C)E;I2
D)B;I1
Question
Use the following to answer question:
(Figure: Consumer Equilibrium IV)Use Figure Consumer Equilibrium IV.The highest level of utility shown in the figure is associated with indifference curve:
A)X.
B)Y.
C)Z.
D)Y or Z.
(Figure: Consumer Equilibrium IV)Use Figure Consumer Equilibrium IV.The highest level of utility shown in the figure is associated with indifference curve:
A)X.
B)Y.
C)Z.
D)Y or Z.
Question
Use the following to answer question:
(Figure: Consumer Equilibrium III)Use Figure Consumer Equilibrium III.Given the figure,which of the following statements is TRUE?
A)At the point of utility maximization,the rate at which Kurt is willing to exchange one good for another is less than the rate at which the goods can be exchanged in the market.
B)An increase in the prices of tamales and placemats would allow Kurt to attain point B.
C)At point E,Px = Py.
D)Point E is the point of utility maximization under current budget constraints.
Question
Use the following to answer question:
(Figure: Consumer Equilibrium III)Use Figure Consumer Equilibrium III.Kurt consumes at point C.If income remains unchanged,Kurt could gain more utility by choosing point:
A)B.
B)A.
C)F.
D)E.
(Figure: Consumer Equilibrium III)Use Figure Consumer Equilibrium III.Kurt consumes at point C.If income remains unchanged,Kurt could gain more utility by choosing point:
A)B.
B)A.
C)F.
D)E.
Question
Use the following to answer question:
(Figure: Consumer Equilibrium II)Use Figure Consumer Equilibrium II.Ashyra consumes at point I.Ashyra could gain more utility by choosing point _____,all other things held equal.
A)J
B)G
C)K
D)The consumer doesn't have enough income to gain more utility.
(Figure: Consumer Equilibrium II)Use Figure Consumer Equilibrium II.Ashyra consumes at point I.Ashyra could gain more utility by choosing point _____,all other things held equal.
A)J
B)G
C)K
D)The consumer doesn't have enough income to gain more utility.
Question
Use the following to answer question:
(Figure: Consumer Equilibrium III)Use Figure Consumer Equilibrium III.Kurt consumes at point A.Other things held equal,Kurt would be able to realize more total utility by choosing point:
A)E.
B)B.
C)C.
D)F.
(Figure: Consumer Equilibrium III)Use Figure Consumer Equilibrium III.Kurt consumes at point A.Other things held equal,Kurt would be able to realize more total utility by choosing point:
A)E.
B)B.
C)C.
D)F.
Question
Use the following to answer question:
(Figure: Consumer Equilibrium III)Use Figure Consumer Equilibrium III.A level of total utility NOT attainable is at point:
A)A.
B)F.
C)E.
D)B.
(Figure: Consumer Equilibrium III)Use Figure Consumer Equilibrium III.A level of total utility NOT attainable is at point:
A)A.
B)F.
C)E.
D)B.
Question
Use the following to answer question:
(Figure: Consumer Equilibrium II)Use Figure Consumer Equilibrium II.Which of the following is TRUE?
A)To increase utility beyond that received at point I requires an increase in the price of olive oil.
B)Point J could be attained with an increase in Ashyra's income.
C)An increase in the prices of olive oil and dish soap would allow Ashyra to attain point J.
D)To increase utility beyond that received at point I requires an increase in the price of dish soap.
Question
Use the following to answer question:
(Figure: Consumer Equilibrium IV)Use Figure Consumer Equilibrium IV.The highest attainable level of utility,given budget constraint FL,is at point:
A)G.
B)H.
C)I.
D)J.
(Figure: Consumer Equilibrium IV)Use Figure Consumer Equilibrium IV.The highest attainable level of utility,given budget constraint FL,is at point:
A)G.
B)H.
C)I.
D)J.
Question
Use the following to answer question:
(Figure: Consumer Equilibrium II)Use Figure Consumer Equilibrium II.Ashyra consumes at point G.Ashyra would be able to realize more total utility by choosing point _____,all other things held equal.
A)J
B)K
C)I
D)H
(Figure: Consumer Equilibrium II)Use Figure Consumer Equilibrium II.Ashyra consumes at point G.Ashyra would be able to realize more total utility by choosing point _____,all other things held equal.
A)J
B)K
C)I
D)H
Question
Use the following to answer question:
(Figure: Consumer Equilibrium III)Use Figure Consumer Equilibrium III.Given the figure,which of the following is TRUE?
A)Point C is preferable to point E.
B)At point E,Px = Py
C)Point B could be attained with an increase in the consumer's income.
D)To increase utility beyond that received at point E requires a change in the preferences of the consumer.
Question
Use the following to answer question:
(Figure: Consumer Equilibrium IV)Use Figure Consumer Equilibrium IV.The highest level of utility is at point:
A)G.
B)H.
C)I.
D)J.
(Figure: Consumer Equilibrium IV)Use Figure Consumer Equilibrium IV.The highest level of utility is at point:
A)G.
B)H.
C)I.
D)J.
Question
Use the following to answer question:
(Figure: Consumer Equilibrium II)Use Figure Consumer Equilibrium II.Which of the following statements is TRUE?
A)Point I is the point of utility maximization.
B)At the point of utility maximization,the rate at which Ashyra is willing to exchange one good for another is less than the rate at which the goods can be exchanged in the market.
C)At point I,Py.= Px.
D)At point I,Ashyra has some income left for saving.
Question
Use the following to answer question:
(Figure: Consumer Equilibrium III)Use Figure Consumer Equilibrium III.Kurt would maximize his utility at point _____ with the consumption of _____.
A)B;Q6 and Q3
B)E;Q1 and Q7
C)F;Q5 and Q4
D)E;Q5 and Q2
(Figure: Consumer Equilibrium III)Use Figure Consumer Equilibrium III.Kurt would maximize his utility at point _____ with the consumption of _____.
A)B;Q6 and Q3
B)E;Q1 and Q7
C)F;Q5 and Q4
D)E;Q5 and Q2
Question
Use the following to answer question:
(Figure: Consumer Equilibrium III)Use Figure Consumer Equilibrium III.The highest level of total utility attainable is associated with point _____ on _____.
A)C;I3
B)E;I2
C)A;I2
D)B;I1
(Figure: Consumer Equilibrium III)Use Figure Consumer Equilibrium III.The highest level of total utility attainable is associated with point _____ on _____.
A)C;I3
B)E;I2
C)A;I2
D)B;I1

Unlock Deck
Sign up to unlock the cards in this deck!
Unlock Deck
Unlock Deck
1/135
Play
Full screen (f)
Deck 22: Consumer Preferences and Consumer Choice
1
If a consumer moves upward along an indifference curve,his or her total utility:
A)remains constant.
B)first decreases,then increases.
C)increases.
D)first increases,then decreases.
A)remains constant.
B)first decreases,then increases.
C)increases.
D)first increases,then decreases.
remains constant.
2
A curve that represents combinations of two goods that yield equal levels of satisfaction is a(n):
A)indifference curve.
B)budget curve.
C)marginal utility curve.
D)price-consumption curve.
A)indifference curve.
B)budget curve.
C)marginal utility curve.
D)price-consumption curve.
indifference curve.
3
If two combinations of two goods yield the same level of satisfaction,then they are on:
A)the same price line.
B)the same budget constraint.
C)the same indifference curve.
D)different indifference curves.
A)the same price line.
B)the same budget constraint.
C)the same indifference curve.
D)different indifference curves.
the same indifference curve.
4
The slope of a(n)_____ curve shows the rate at which two goods can be exchanged _____ the consumer's _____.
A)marginal utility;by increasing;marginal utility
B)indifference;without affecting;total utility
C)utility;without affecting;budget
D)indifference;without affecting;budget
A)marginal utility;by increasing;marginal utility
B)indifference;without affecting;total utility
C)utility;without affecting;budget
D)indifference;without affecting;budget
Unlock Deck
Unlock for access to all 135 flashcards in this deck.
Unlock Deck
k this deck
5
A(n)_____ is a curve that shows all of the consumption bundles that yield the same level of total utility for an individual.
A)budget line
B)indifference curve
C)utility function
D)marginal rate of substitution
A)budget line
B)indifference curve
C)utility function
D)marginal rate of substitution
Unlock Deck
Unlock for access to all 135 flashcards in this deck.
Unlock Deck
k this deck
6
Use the following to answer question:
(Table: Bundles of X and Y)Use Table Bundles of X and Y.Bundle(s):
A)A and B are on the same indifference curve.
B)A and C are on the same indifference curve.
C)D is on the highest indifference curve.
D)C is on the highest indifference curve,and bundles A and B are on the lowest indifference curve.
(Table: Bundles of X and Y)Use Table Bundles of X and Y.Bundle(s):
A)A and B are on the same indifference curve.
B)A and C are on the same indifference curve.
C)D is on the highest indifference curve.
D)C is on the highest indifference curve,and bundles A and B are on the lowest indifference curve.
Unlock Deck
Unlock for access to all 135 flashcards in this deck.
Unlock Deck
k this deck
7
If combination A lies on a higher indifference curve than combination B and combination B lies on a higher indifference curve than combination C,it must be that the total utility associated with combination A is _____ the total utility associated with combination C.
A)less than
B)more than
C)equal to
D)more than or equal to
A)less than
B)more than
C)equal to
D)more than or equal to
Unlock Deck
Unlock for access to all 135 flashcards in this deck.
Unlock Deck
k this deck
8
Assume that two combinations of two goods yield the same level of satisfaction.We can conclude that these combinations are always on:
A)the same price line.
B)the same budget constraint.
C)the same indifference curve.
D)different indifference curves.
A)the same price line.
B)the same budget constraint.
C)the same indifference curve.
D)different indifference curves.
Unlock Deck
Unlock for access to all 135 flashcards in this deck.
Unlock Deck
k this deck
9
An indifference curve shows combinations of two goods that yield:
A)equal prices.
B)equal money income.
C)equal satisfaction.
D)increasing prices.
A)equal prices.
B)equal money income.
C)equal satisfaction.
D)increasing prices.
Unlock Deck
Unlock for access to all 135 flashcards in this deck.
Unlock Deck
k this deck
10
When Laurie asks Matt if he wants a large popcorn and small soda or a large soda and small popcorn,Matt says,"Oh,I'm indifferent." This means Matt:
A)doesn't want popcorn and soda.
B)thinks both bundles give him the same utility.
C)thinks neither bundle gives him utility.
D)thinks the utility he gained from popcorn and soda exactly equals their cost.
A)doesn't want popcorn and soda.
B)thinks both bundles give him the same utility.
C)thinks neither bundle gives him utility.
D)thinks the utility he gained from popcorn and soda exactly equals their cost.
Unlock Deck
Unlock for access to all 135 flashcards in this deck.
Unlock Deck
k this deck
11
Use the following to answer question:
(Table: Bundles of X and Y)Use Table Bundles of X and Y.According to the table:
A)bundle D is preferred to bundles A and B.
B)the consumer is indifferent among bundles A,B,and C.
C)bundles C and D are both preferred to bundles A and B.
D)bundle C is preferred to all other bundles.
(Table: Bundles of X and Y)Use Table Bundles of X and Y.According to the table:
A)bundle D is preferred to bundles A and B.
B)the consumer is indifferent among bundles A,B,and C.
C)bundles C and D are both preferred to bundles A and B.
D)bundle C is preferred to all other bundles.
Unlock Deck
Unlock for access to all 135 flashcards in this deck.
Unlock Deck
k this deck
12
An indifference curve is a line showing all of the consumption bundles that:
A)an individual can purchase with a given income.
B)yield the same total utility for an individual.
C)yield the same marginal utility.
D)have the same marginal rate of substitution.
A)an individual can purchase with a given income.
B)yield the same total utility for an individual.
C)yield the same marginal utility.
D)have the same marginal rate of substitution.
Unlock Deck
Unlock for access to all 135 flashcards in this deck.
Unlock Deck
k this deck
13
Consumption bundles that yield equal levels of total utility are shown on the same:
A)budget line.
B)marginal utility curve.
C)indifference curve.
D)utility maximizing curve.
A)budget line.
B)marginal utility curve.
C)indifference curve.
D)utility maximizing curve.
Unlock Deck
Unlock for access to all 135 flashcards in this deck.
Unlock Deck
k this deck
14
Combinations of two goods that yield equal levels of utility are shown on a(n)_____ curve.
A)indifference
B)budget
C)marginal utility
D)utility-maximizing
A)indifference
B)budget
C)marginal utility
D)utility-maximizing
Unlock Deck
Unlock for access to all 135 flashcards in this deck.
Unlock Deck
k this deck
15
(Figure and Table: Indifference Curve Map)Use Figure and Table An Indifference Curve Map.Combination _____ is preferred to combination _____.
A)A;B
B)B;D
C)C;A
D)B;C
A)A;B
B)B;D
C)C;A
D)B;C
Unlock Deck
Unlock for access to all 135 flashcards in this deck.
Unlock Deck
k this deck
16
Higher indifference curves represent:
A)less utility than lower indifference curves.
B)more utility than lower indifference curves.
C)the same level of utility as lower indifference curves.
D)unknown levels of utility compared to lower indifference curves.
A)less utility than lower indifference curves.
B)more utility than lower indifference curves.
C)the same level of utility as lower indifference curves.
D)unknown levels of utility compared to lower indifference curves.
Unlock Deck
Unlock for access to all 135 flashcards in this deck.
Unlock Deck
k this deck
17
In terms of indifference curves,an increase in total utility is represented by a _____ indifference curve.
A)shift to the right to a higher
B)shift to the left to a lower
C)movement upward along an
D)movement downward along an
A)shift to the right to a higher
B)shift to the left to a lower
C)movement upward along an
D)movement downward along an
Unlock Deck
Unlock for access to all 135 flashcards in this deck.
Unlock Deck
k this deck
18
If a consumer moves downward along an indifference curve,his or her total utility:
A)remains constant.
B)first decreases,then increases.
C)decreases.
D)first increases,then decreases.
A)remains constant.
B)first decreases,then increases.
C)decreases.
D)first increases,then decreases.
Unlock Deck
Unlock for access to all 135 flashcards in this deck.
Unlock Deck
k this deck
19
Higher total utility is represented by _____ indifference curve.
A)a higher
B)a lower
C)movement leftward along an
D)movement rightward along an
A)a higher
B)a lower
C)movement leftward along an
D)movement rightward along an
Unlock Deck
Unlock for access to all 135 flashcards in this deck.
Unlock Deck
k this deck
20
Higher indifference curves represent _____ lower curves.
A)less utility than
B)more utility than
C)the same utility as
D)either more or less utility than
A)less utility than
B)more utility than
C)the same utility as
D)either more or less utility than
Unlock Deck
Unlock for access to all 135 flashcards in this deck.
Unlock Deck
k this deck
21
Which of the following is NOT TRUE of indifference curves for ordinary goods?
A)They never cross.
B)They slope downward.
C)They are convex from the origin.
D)Indifference curves farther from the origin have lower levels of utility.
A)They never cross.
B)They slope downward.
C)They are convex from the origin.
D)Indifference curves farther from the origin have lower levels of utility.
Unlock Deck
Unlock for access to all 135 flashcards in this deck.
Unlock Deck
k this deck
22
Manny consumes only bananas and DVDs,and he is on his highest possible indifference curve.Two bundles on this indifference curve are bundle A (5 bananas and 2 DVDs),and bundle B (3 bananas and 3 DVDs).Between points A and B,what is Manny's marginal rate of substitution of bananas for DVDs?
A)1
B)2
C)0.5
D)1.33
A)1
B)2
C)0.5
D)1.33
Unlock Deck
Unlock for access to all 135 flashcards in this deck.
Unlock Deck
k this deck
23
Use the following to answer question:
(Figure: Indifference Curves and Consumption Bundles)Use Figure Indifference Curves and Consumption Bundles.In the figure,the initial optimum is at a.The price of hot dogs increases,and the new equilibrium point is c.The change in hot dog consumption due to the income effect of the price change is:
A)H3 to H2.
B)H3 to H1.
C)H2 to H1.
D)H1 to H2.
Unlock Deck
Unlock for access to all 135 flashcards in this deck.
Unlock Deck
k this deck
24
Use the following to answer question:
(Figure: Indifference Curve Map I)Use Figure Indifference Curve Map I.It shows that:
A)bundles B and D provide the same level of utility.
B)bundle A is preferred to bundle B.
C)bundle D is preferred to bundle C,which is preferred to bundles A and B.
D)bundle C provides the highest level of utility.
(Figure: Indifference Curve Map I)Use Figure Indifference Curve Map I.It shows that:
A)bundles B and D provide the same level of utility.
B)bundle A is preferred to bundle B.
C)bundle D is preferred to bundle C,which is preferred to bundles A and B.
D)bundle C provides the highest level of utility.
Unlock Deck
Unlock for access to all 135 flashcards in this deck.
Unlock Deck
k this deck
25
One point on a standard indifference curve is 8 cookies and 2 brownies;another is 6 cookies and 4 brownies.Which of the following combinations of cookies and brownies could lie on this indifference curve?
A)6 cookies and 10 brownies
B)7 cookies and 6 brownies
C)4 cookies and 4 brownies
D)4 cookies and 8 brownies
A)6 cookies and 10 brownies
B)7 cookies and 6 brownies
C)4 cookies and 4 brownies
D)4 cookies and 8 brownies
Unlock Deck
Unlock for access to all 135 flashcards in this deck.
Unlock Deck
k this deck
26
Use the following to answer question:
(Figure: Indifference Curves and Consumption Bundles)Use Figure Indifference Curves and Consumption Bundles.For this consumer pizza is a(n)_____ good and hot dogs are a(n)_____ good.
A)normal;inferior
B)inferior;normal
C)normal;normal
D)inferior;inferior
(Figure: Indifference Curves and Consumption Bundles)Use Figure Indifference Curves and Consumption Bundles.For this consumer pizza is a(n)_____ good and hot dogs are a(n)_____ good.
A)normal;inferior
B)inferior;normal
C)normal;normal
D)inferior;inferior
Unlock Deck
Unlock for access to all 135 flashcards in this deck.
Unlock Deck
k this deck
27
Use the following to answer question:
(Figure: Indifference Curves and Consumption Bundles)Use Figure Indifference Curves and Consumption Bundles.The lines AA and BC are parallel.The optimal consumption point could shift from b to c as a result of any of the following EXCEPT:
A)an equal percentage increase in the prices of hot dogs and pizza while income is unchanged.
B)a decrease in income with prices constant.
C)a change in tastes.
D)an equal percentage increase in the prices of hot dogs and pizza while income is unchanged or a decrease in income with prices constant.
Unlock Deck
Unlock for access to all 135 flashcards in this deck.
Unlock Deck
k this deck
28
One point on an indifference curve that displays a diminishing marginal rate of substitution between apples and oranges is 10 apples and 2 oranges;another is 8 apples and 4 oranges.Which of the following combinations of apples and oranges could also lie on this indifference curve?
A)10 apples and 6 oranges
B)6 apples and 7 oranges
C)9 apples and 4 oranges
D)8 apples and 3 oranges
A)10 apples and 6 oranges
B)6 apples and 7 oranges
C)9 apples and 4 oranges
D)8 apples and 3 oranges
Unlock Deck
Unlock for access to all 135 flashcards in this deck.
Unlock Deck
k this deck
29
Suppose peanut butter is an inferior good for Ilya and the price of peanut butter rises.What will happen to Ilya's consumption of peanut butter?
A)The substitution effect will cause an increase in the consumption of peanut butter.
B)The substitution effect will cause a decrease in the consumption of peanut butter and the income effect will cause an increase in the consumption of peanut butter.
C)The substitution effect will cause a decrease in the consumption of peanut butter.
D)The income effect will cause an increase in the consumption of peanut butter.
Unlock Deck
Unlock for access to all 135 flashcards in this deck.
Unlock Deck
k this deck
30
Greater levels of utility are represented by:
A)indifference curves that are farther from the origin.
B)indifference curves that are closer to the origin.
C)moving up to the left on the same indifference curve.
D)moving down to the right on the same indifference curve.
A)indifference curves that are farther from the origin.
B)indifference curves that are closer to the origin.
C)moving up to the left on the same indifference curve.
D)moving down to the right on the same indifference curve.
Unlock Deck
Unlock for access to all 135 flashcards in this deck.
Unlock Deck
k this deck
31
Use the following to answer question:
(Figure: Indifference Curve Map I)Use Figure Indifference Curve Map I.It shows that:
A)at point A utility is higher than it is at point B.
B)utility is diminishing on I1,constant on I2,and increasing on I3.
C)utility is higher at point D than at point A.
D)the marginal utility of e-books is positive,while the marginal utility of cell phone apps is negative.
Unlock Deck
Unlock for access to all 135 flashcards in this deck.
Unlock Deck
k this deck
32
In terms of indifference curves,a demand curve is generated by changes in:
A)the income effect.
B)the substitution effect.
C)the price of one good.
D)the price of both goods simultaneously.
A)the income effect.
B)the substitution effect.
C)the price of one good.
D)the price of both goods simultaneously.
Unlock Deck
Unlock for access to all 135 flashcards in this deck.
Unlock Deck
k this deck
33
An indifference curve typically:
A)slopes downward.
B)shows combinations of two goods that yield equal money income.
C)slopes upward.
D)is concave.
A)slopes downward.
B)shows combinations of two goods that yield equal money income.
C)slopes upward.
D)is concave.
Unlock Deck
Unlock for access to all 135 flashcards in this deck.
Unlock Deck
k this deck
34
A _____ can be generated from indifference curves by changing _____.
A)supply curve;the price of both goods simultaneously
B)demand curve;the price of one good
C)demand curve;income
D)budget line;utility
A)supply curve;the price of both goods simultaneously
B)demand curve;the price of one good
C)demand curve;income
D)budget line;utility
Unlock Deck
Unlock for access to all 135 flashcards in this deck.
Unlock Deck
k this deck
35
Max consumes only yogurt and almonds,and he is on his highest possible indifference curve.Bundle A (4 yogurts and 2 almonds)and bundle B (3 yogurts and 3 almonds)are on this indifference curve.Between points A and B,what is Max's marginal rate of substitution of yogurt for almonds?
A)1
B)2
C)3
D)1.33
A)1
B)2
C)3
D)1.33
Unlock Deck
Unlock for access to all 135 flashcards in this deck.
Unlock Deck
k this deck
36
The slope of a(n)_____ curve shows the rate at which two goods can be exchanged _____.
A)indifference;without changing the total budget
B)utility;without changing the total budget
C)indifference;without changing total utility
D)marginal utility;to increase the consumer's marginal utility
A)indifference;without changing the total budget
B)utility;without changing the total budget
C)indifference;without changing total utility
D)marginal utility;to increase the consumer's marginal utility
Unlock Deck
Unlock for access to all 135 flashcards in this deck.
Unlock Deck
k this deck
37
Consumers buy both alcoholic and nonalcoholic beverages.If the government tries to discourage people from drinking alcoholic beverages by imposing an excise tax on them but gives consumers an income subsidy to keep the consumers on their original indifference curves:
A)the same amount of both goods will be consumed.
B)fewer alcoholic and more nonalcoholic beverages will be consumed.
C)more alcoholic and fewer nonalcoholic beverages will be consumed.
D)it is impossible to determine what will happen to the consumption of alcoholic and more nonalcoholic beverages.
A)the same amount of both goods will be consumed.
B)fewer alcoholic and more nonalcoholic beverages will be consumed.
C)more alcoholic and fewer nonalcoholic beverages will be consumed.
D)it is impossible to determine what will happen to the consumption of alcoholic and more nonalcoholic beverages.
Unlock Deck
Unlock for access to all 135 flashcards in this deck.
Unlock Deck
k this deck
38
Javon is consuming his optimal utility-maximizing consumption bundle of lobster and macaroni-and-cheese dinners.Call this bundle A.His income is $100,the price of a macaroni-and-cheese dinner is $5,and the price of a lobster is $20.Put lobsters on the vertical axis and put macaroni-and-cheese dinners on the horizontal axis.His income increases to $500 and the prices of macaroni-and-cheese dinners and lobster remain constant.With the increase in income,Javon changes his consumption of the two goods and now maximizes utility at bundle B.If macaroni-and-cheese dinners are an inferior good for Javon:
A)at bundle B,Javon consumes more macaroni-and-cheese dinners.
B)at bundle B,Javon consumes less lobster.
C)at bundle A and bundle B,the marginal utility of lobster is 5.
D)at bundle B,Javon consumes more lobster.
A)at bundle B,Javon consumes more macaroni-and-cheese dinners.
B)at bundle B,Javon consumes less lobster.
C)at bundle A and bundle B,the marginal utility of lobster is 5.
D)at bundle B,Javon consumes more lobster.
Unlock Deck
Unlock for access to all 135 flashcards in this deck.
Unlock Deck
k this deck
39
For most goods,as we move down an indifference curve:
A)the slope gets flatter.
B)the slope gets steeper.
C)the slope stays the same.
D)total utility decreases.
A)the slope gets flatter.
B)the slope gets steeper.
C)the slope stays the same.
D)total utility decreases.
Unlock Deck
Unlock for access to all 135 flashcards in this deck.
Unlock Deck
k this deck
40
For most goods,indifference curves:
A)may intersect.
B)slope upward.
C)are concave from the origin.
D)slope downward.
A)may intersect.
B)slope upward.
C)are concave from the origin.
D)slope downward.
Unlock Deck
Unlock for access to all 135 flashcards in this deck.
Unlock Deck
k this deck
41
Use the following to answer question:
(Figure: Harold's Indifference Curves)Use Figure Harold's Indifference Curves.Given that the price of bread is $1 per loaf and the price of cheese is $2 per pound,as Harold's income increases from $10 to $14,we can determine that bread is a(n)_____ good and cheese is a(n)_____ good.
A)inferior;inferior
B)normal;inferior
C)inferior;normal
D)normal;normal
Unlock Deck
Unlock for access to all 135 flashcards in this deck.
Unlock Deck
k this deck
42
Use the following to answer question:
(Figure: The Consumption of Video Games and E-Books)Use Figure The Consumption of Video Games and E-Books.Which chart shows the effects of a decrease in income when video games are an inferior good and e-books are a normal good?
A)A
B)B
C)C
D)D
(Figure: The Consumption of Video Games and E-Books)Use Figure The Consumption of Video Games and E-Books.Which chart shows the effects of a decrease in income when video games are an inferior good and e-books are a normal good?
A)A
B)B
C)C
D)D
Unlock Deck
Unlock for access to all 135 flashcards in this deck.
Unlock Deck
k this deck
43
Use the following to answer question:
(Figure: The Optimal Consumption Bundle)Use Figure The Optimal Consumption Bundle.Which of the following could lead to an optimal consumption bundle on indifference curve I1?
A)an increase in income
B)a decrease in the price of restaurant meals
C)a decrease in the price of rooms
D)a decrease in income
Unlock Deck
Unlock for access to all 135 flashcards in this deck.
Unlock Deck
k this deck
44
Use the following to answer question:
(Figure: Harold's Indifference Curves)Use Figure Harold's Indifference Curves.If the price of bread is $1 per loaf,the price of cheese is $2 per pound,and Harold has $10 to spend on bread and cheese,Harold's optimal consumption bundle is _____ loaves of bread and _____ pounds of cheese.
A)6;4
B)4;3
C)3;2
D)2;8
Unlock Deck
Unlock for access to all 135 flashcards in this deck.
Unlock Deck
k this deck
45
Use the following to answer question:
(Figure: Harold's Indifference Curves)Use Figure Harold's Indifference Curves.The price of cheese is $2 per pound and Harold has $10 to spend on bread and cheese.As the price of bread rises from $1 to $2 per loaf,his consumption of bread: change?
A)increases from 2 to 3 loaves.
B)decreases from 3 to 2 loaves.
C)increases from 3 to 4 loaves.
D)decreases from 4 to 3 loaves.
Unlock Deck
Unlock for access to all 135 flashcards in this deck.
Unlock Deck
k this deck
46
Use the following to answer question:
(Figure: Harold's Indifference Curves)Use Figure Harold's Indifference Curves.If the price of bread is $2 per loaf,the price of cheese is $2 per pound,and Harold has $10 to spend on bread and cheese,Harold's optimal consumption bundle is _____ loaves of bread and _____ pounds of cheese.
A)6;4
B)4;3
C)3;2
D)2;8
Unlock Deck
Unlock for access to all 135 flashcards in this deck.
Unlock Deck
k this deck
47
Use the following to answer question:
(Figure: The Optimal Consumption Bundle)Use Figure The Optimal Consumption Bundle.Which of the following could lead to an optimal consumption bundle on indifference curve I1?
A)an increase in income
B)an increase in the price of restaurant meals
C)a decrease in the price of rooms
D)a decrease in the price of restaurant meals
Unlock Deck
Unlock for access to all 135 flashcards in this deck.
Unlock Deck
k this deck
48
Use the following to answer question:
(Figure: Harold's Indifference Curves)Use Figure Harold's Indifference Curves.If the price of bread is $1 per loaf,the price of cheese is $2 per pound,and Harold has $14 to spend on bread and cheese,Harold's optimal consumption bundle is _____ loaves of bread and _____ pounds of cheese.
A)6;4
B)4;3
C)3;2
D)2;8
Unlock Deck
Unlock for access to all 135 flashcards in this deck.
Unlock Deck
k this deck
49
Use the following to answer question:
(Figure: Consumer Equilibrium II)Use Figure Consumer Equilibrium II.The HIGHEST level of total utility is associated with point _____ on indifference curve _____.
A)H;C
B)I;B
C)G;B
D)J;A
(Figure: Consumer Equilibrium II)Use Figure Consumer Equilibrium II.The HIGHEST level of total utility is associated with point _____ on indifference curve _____.
A)H;C
B)I;B
C)G;B
D)J;A
Unlock Deck
Unlock for access to all 135 flashcards in this deck.
Unlock Deck
k this deck
50
Use the following to answer question:
(Figure: The Optimal Consumption Bundle)Use Figure The Optimal Consumption Bundle.Which of the following could lead to an optimal consumption bundle on indifference curve I3?
A)an increase in income
B)an increase in the price of restaurant meals
C)an increase in the price of rooms
D)a decrease in income
Unlock Deck
Unlock for access to all 135 flashcards in this deck.
Unlock Deck
k this deck
51
Use the following to answer question:
(Figure: The Consumption of Video Games and E-Books)Use Figure The Consumption of Video Games and E-Books.Which chart in the figure shows the effects of an increase in the price of video games when video games and e-books are complements but not perfect complements?
A)A
B)B
C)C
D)D
(Figure: The Consumption of Video Games and E-Books)Use Figure The Consumption of Video Games and E-Books.Which chart in the figure shows the effects of an increase in the price of video games when video games and e-books are complements but not perfect complements?
A)A
B)B
C)C
D)D
Unlock Deck
Unlock for access to all 135 flashcards in this deck.
Unlock Deck
k this deck
52
Use the following to answer question:
(Figure: Indifference Curves and Consumption Bundles)Use Figure Indifference Curves and Consumption Bundles.In the figure,the initial optimum is at a.The price of hot dogs now increases.The change in hot dog consumption due to the substitution effect is:
A)H3 to H2.
B)H3 to H1.
C)H2 to H1.
D)H1 to H2.
Unlock Deck
Unlock for access to all 135 flashcards in this deck.
Unlock Deck
k this deck
53
Use the following to answer question:
(Figure: The Consumption of Video Games and E-Books)Use Figure The Consumption of Video Games and E-Books.Which chart shows the effects of an increase in the price of video games when video games and e-books are substitutes but not perfect substitutes?
A)A
B)B
C)C
D)D
(Figure: The Consumption of Video Games and E-Books)Use Figure The Consumption of Video Games and E-Books.Which chart shows the effects of an increase in the price of video games when video games and e-books are substitutes but not perfect substitutes?
A)A
B)B
C)C
D)D
Unlock Deck
Unlock for access to all 135 flashcards in this deck.
Unlock Deck
k this deck
54
Use the following to answer question:
(Figure: The Optimal Consumption Bundle)Use Figure The Optimal Consumption Bundle.If the price of restaurant meals _____,then the optimal consumption bundle will be on _____ indifference curve.
A)increases;a higher
B)decreases;a higher
C)decreases;a lower
D)increases;the same
(Figure: The Optimal Consumption Bundle)Use Figure The Optimal Consumption Bundle.If the price of restaurant meals _____,then the optimal consumption bundle will be on _____ indifference curve.
A)increases;a higher
B)decreases;a higher
C)decreases;a lower
D)increases;the same
Unlock Deck
Unlock for access to all 135 flashcards in this deck.
Unlock Deck
k this deck
55
Use the following to answer question:
(Figure: The Optimal Consumption Bundle)Use Figure The Optimal Consumption Bundle.Which of the following could lead to an optimal consumption bundle on indifference curve I3?
A)a decrease in income
B)an increase in the price of restaurant meals
C)a decrease in the price of rooms
D)an increase in the price of rooms
Unlock Deck
Unlock for access to all 135 flashcards in this deck.
Unlock Deck
k this deck
56
Use the following to answer question:
(Figure: Harold's Indifference Curves)Use Figure Harold's Indifference Curves.If the price of cheese is $2 per pound and Harold has $10 to spend on bread and cheese,Harold _____ his consumption of cheese as the price of bread rises from $1 per loaf to $2 per loaf,indicating that bread and cheese are _____.
A)increases;substitutes
B)increases;complements
C)decreases;substitutes
D)decreases;complements
Unlock Deck
Unlock for access to all 135 flashcards in this deck.
Unlock Deck
k this deck
57
Use the following to answer question:
(Figure: The Consumption of Video Games and E-Books)Use Figure The Consumption of Video Games and E-Books.Which chart shows the effect of a decrease in income when both video games and e-books are normal goods?
A)A
B)B
C)C
D)D
(Figure: The Consumption of Video Games and E-Books)Use Figure The Consumption of Video Games and E-Books.Which chart shows the effect of a decrease in income when both video games and e-books are normal goods?
A)A
B)B
C)C
D)D
Unlock Deck
Unlock for access to all 135 flashcards in this deck.
Unlock Deck
k this deck
58
Use the following to answer question:
(Figure: Harold's Indifference Curves)Use Figure Harold's Indifference Curves.If the price of bread is $0.50 per loaf,the price of cheese is $1 per pound,and Harold has $7 to spend on bread and cheese,Harold's optimal consumption bundle is _____ loaves of bread and _____ pounds of cheese.
A)6;4
B)4;3
C)3;2
D)2;8
Unlock Deck
Unlock for access to all 135 flashcards in this deck.
Unlock Deck
k this deck
59
Use the following to answer question:
(Figure: The Optimal Consumption Bundle)Use Figure The Optimal Consumption Bundle.Which of the following could lead to an optimal consumption bundle on indifference curve I3?
A)a decrease in income
B)a decrease in the price of restaurant meals
C)an increase in the price of rooms
D)an increase in the price of restaurant meals
Unlock Deck
Unlock for access to all 135 flashcards in this deck.
Unlock Deck
k this deck
60
Use the following to answer question:
(Figure: Harold's Indifference Curves)Use Figure Harold's Indifference Curves.If the price of bread is $2 per loaf,the price of cheese is $4 per pound,and Harold has $28 to spend on bread and cheese,Harold's optimal consumption bundle is _____ loaves of bread and _____ pounds of cheese.
A)6;4
B)4;3
C)3;2
D)2;8
Unlock Deck
Unlock for access to all 135 flashcards in this deck.
Unlock Deck
k this deck
61
Use the following to answer question:
(Figure: Consumer Equilibrium II)Use Figure Consumer Equilibrium II.Ashyra would maximize her utility at point _____ with the consumption of _____ olive oil and _____ dish soap.
A)J;S;P
B)I;S;P
C)J;N;F
D)I;N;M
(Figure: Consumer Equilibrium II)Use Figure Consumer Equilibrium II.Ashyra would maximize her utility at point _____ with the consumption of _____ olive oil and _____ dish soap.
A)J;S;P
B)I;S;P
C)J;N;F
D)I;N;M
Unlock Deck
Unlock for access to all 135 flashcards in this deck.
Unlock Deck
k this deck
62
Use the following to answer question:
(Figure: Consumer Equilibrium IV)Use Figure Consumer Equilibrium IV.The lowest level of utility shown in the figure is associated with indifference curve:
A)X.
B)Y.
C)Z.
D)X or Y.
(Figure: Consumer Equilibrium IV)Use Figure Consumer Equilibrium IV.The lowest level of utility shown in the figure is associated with indifference curve:
A)X.
B)Y.
C)Z.
D)X or Y.
Unlock Deck
Unlock for access to all 135 flashcards in this deck.
Unlock Deck
k this deck
63
Use the following to answer question:
(Figure: Consumer Equilibrium II)Use Figure Consumer Equilibrium II.A level of total utility NOT attainable is at point:
A)G.
B)K.
C)I.
D)J.
(Figure: Consumer Equilibrium II)Use Figure Consumer Equilibrium II.A level of total utility NOT attainable is at point:
A)G.
B)K.
C)I.
D)J.
Unlock Deck
Unlock for access to all 135 flashcards in this deck.
Unlock Deck
k this deck
64
Use the following to answer question:
(Figure: Consumer Equilibrium III)Use Figure Consumer Equilibrium III.Which of the following statements is TRUE?
A)Q4 indicates the price of placemats.
B)Q8 indicates the price of tamales.
C)Points A and E represent the same level of total utility.
D)Kurt is better off at point E than at point A.
(Figure: Consumer Equilibrium III)Use Figure Consumer Equilibrium III.Which of the following statements is TRUE?
A)Q4 indicates the price of placemats.
B)Q8 indicates the price of tamales.
C)Points A and E represent the same level of total utility.
D)Kurt is better off at point E than at point A.
Unlock Deck
Unlock for access to all 135 flashcards in this deck.
Unlock Deck
k this deck
65
Use the following to answer question:
(Figure: Consumer Equilibrium II)Use Figure Consumer Equilibrium II.The LOWEST level of total utility shown in the figure is associated with point _____ on curve _____.
A)H;A
B)I;B
C)G;C
D)J;A
(Figure: Consumer Equilibrium II)Use Figure Consumer Equilibrium II.The LOWEST level of total utility shown in the figure is associated with point _____ on curve _____.
A)H;A
B)I;B
C)G;C
D)J;A
Unlock Deck
Unlock for access to all 135 flashcards in this deck.
Unlock Deck
k this deck
66
Use the following to answer question:
(Figure: Consumer Equilibrium III)Use Figure Consumer Equilibrium III.The lowest level of total utility at which Ivan still spends all of his income is associated with point _____ on _____.
A)A;I3
B)C;I3
C)E;I2
D)B;I1
(Figure: Consumer Equilibrium III)Use Figure Consumer Equilibrium III.The lowest level of total utility at which Ivan still spends all of his income is associated with point _____ on _____.
A)A;I3
B)C;I3
C)E;I2
D)B;I1
Unlock Deck
Unlock for access to all 135 flashcards in this deck.
Unlock Deck
k this deck
67
Use the following to answer question:
(Figure: Consumer Equilibrium IV)Use Figure Consumer Equilibrium IV.The highest level of utility shown in the figure is associated with indifference curve:
A)X.
B)Y.
C)Z.
D)Y or Z.
(Figure: Consumer Equilibrium IV)Use Figure Consumer Equilibrium IV.The highest level of utility shown in the figure is associated with indifference curve:
A)X.
B)Y.
C)Z.
D)Y or Z.
Unlock Deck
Unlock for access to all 135 flashcards in this deck.
Unlock Deck
k this deck
68
Use the following to answer question:
(Figure: Consumer Equilibrium III)Use Figure Consumer Equilibrium III.Given the figure,which of the following statements is TRUE?
A)At the point of utility maximization,the rate at which Kurt is willing to exchange one good for another is less than the rate at which the goods can be exchanged in the market.
B)An increase in the prices of tamales and placemats would allow Kurt to attain point B.
C)At point E,Px = Py.
D)Point E is the point of utility maximization under current budget constraints.
Unlock Deck
Unlock for access to all 135 flashcards in this deck.
Unlock Deck
k this deck
69
Use the following to answer question:
(Figure: Consumer Equilibrium III)Use Figure Consumer Equilibrium III.Kurt consumes at point C.If income remains unchanged,Kurt could gain more utility by choosing point:
A)B.
B)A.
C)F.
D)E.
(Figure: Consumer Equilibrium III)Use Figure Consumer Equilibrium III.Kurt consumes at point C.If income remains unchanged,Kurt could gain more utility by choosing point:
A)B.
B)A.
C)F.
D)E.
Unlock Deck
Unlock for access to all 135 flashcards in this deck.
Unlock Deck
k this deck
70
Use the following to answer question:
(Figure: Consumer Equilibrium II)Use Figure Consumer Equilibrium II.Ashyra consumes at point I.Ashyra could gain more utility by choosing point _____,all other things held equal.
A)J
B)G
C)K
D)The consumer doesn't have enough income to gain more utility.
(Figure: Consumer Equilibrium II)Use Figure Consumer Equilibrium II.Ashyra consumes at point I.Ashyra could gain more utility by choosing point _____,all other things held equal.
A)J
B)G
C)K
D)The consumer doesn't have enough income to gain more utility.
Unlock Deck
Unlock for access to all 135 flashcards in this deck.
Unlock Deck
k this deck
71
Use the following to answer question:
(Figure: Consumer Equilibrium III)Use Figure Consumer Equilibrium III.Kurt consumes at point A.Other things held equal,Kurt would be able to realize more total utility by choosing point:
A)E.
B)B.
C)C.
D)F.
(Figure: Consumer Equilibrium III)Use Figure Consumer Equilibrium III.Kurt consumes at point A.Other things held equal,Kurt would be able to realize more total utility by choosing point:
A)E.
B)B.
C)C.
D)F.
Unlock Deck
Unlock for access to all 135 flashcards in this deck.
Unlock Deck
k this deck
72
Use the following to answer question:
(Figure: Consumer Equilibrium III)Use Figure Consumer Equilibrium III.A level of total utility NOT attainable is at point:
A)A.
B)F.
C)E.
D)B.
(Figure: Consumer Equilibrium III)Use Figure Consumer Equilibrium III.A level of total utility NOT attainable is at point:
A)A.
B)F.
C)E.
D)B.
Unlock Deck
Unlock for access to all 135 flashcards in this deck.
Unlock Deck
k this deck
73
Use the following to answer question:
(Figure: Consumer Equilibrium II)Use Figure Consumer Equilibrium II.Which of the following is TRUE?
A)To increase utility beyond that received at point I requires an increase in the price of olive oil.
B)Point J could be attained with an increase in Ashyra's income.
C)An increase in the prices of olive oil and dish soap would allow Ashyra to attain point J.
D)To increase utility beyond that received at point I requires an increase in the price of dish soap.
Unlock Deck
Unlock for access to all 135 flashcards in this deck.
Unlock Deck
k this deck
74
Use the following to answer question:
(Figure: Consumer Equilibrium IV)Use Figure Consumer Equilibrium IV.The highest attainable level of utility,given budget constraint FL,is at point:
A)G.
B)H.
C)I.
D)J.
(Figure: Consumer Equilibrium IV)Use Figure Consumer Equilibrium IV.The highest attainable level of utility,given budget constraint FL,is at point:
A)G.
B)H.
C)I.
D)J.
Unlock Deck
Unlock for access to all 135 flashcards in this deck.
Unlock Deck
k this deck
75
Use the following to answer question:
(Figure: Consumer Equilibrium II)Use Figure Consumer Equilibrium II.Ashyra consumes at point G.Ashyra would be able to realize more total utility by choosing point _____,all other things held equal.
A)J
B)K
C)I
D)H
(Figure: Consumer Equilibrium II)Use Figure Consumer Equilibrium II.Ashyra consumes at point G.Ashyra would be able to realize more total utility by choosing point _____,all other things held equal.
A)J
B)K
C)I
D)H
Unlock Deck
Unlock for access to all 135 flashcards in this deck.
Unlock Deck
k this deck
76
Use the following to answer question:
(Figure: Consumer Equilibrium III)Use Figure Consumer Equilibrium III.Given the figure,which of the following is TRUE?
A)Point C is preferable to point E.
B)At point E,Px = Py
C)Point B could be attained with an increase in the consumer's income.
D)To increase utility beyond that received at point E requires a change in the preferences of the consumer.
Unlock Deck
Unlock for access to all 135 flashcards in this deck.
Unlock Deck
k this deck
77
Use the following to answer question:
(Figure: Consumer Equilibrium IV)Use Figure Consumer Equilibrium IV.The highest level of utility is at point:
A)G.
B)H.
C)I.
D)J.
(Figure: Consumer Equilibrium IV)Use Figure Consumer Equilibrium IV.The highest level of utility is at point:
A)G.
B)H.
C)I.
D)J.
Unlock Deck
Unlock for access to all 135 flashcards in this deck.
Unlock Deck
k this deck
78
Use the following to answer question:
(Figure: Consumer Equilibrium II)Use Figure Consumer Equilibrium II.Which of the following statements is TRUE?
A)Point I is the point of utility maximization.
B)At the point of utility maximization,the rate at which Ashyra is willing to exchange one good for another is less than the rate at which the goods can be exchanged in the market.
C)At point I,Py.= Px.
D)At point I,Ashyra has some income left for saving.
Unlock Deck
Unlock for access to all 135 flashcards in this deck.
Unlock Deck
k this deck
79
Use the following to answer question:
(Figure: Consumer Equilibrium III)Use Figure Consumer Equilibrium III.Kurt would maximize his utility at point _____ with the consumption of _____.
A)B;Q6 and Q3
B)E;Q1 and Q7
C)F;Q5 and Q4
D)E;Q5 and Q2
(Figure: Consumer Equilibrium III)Use Figure Consumer Equilibrium III.Kurt would maximize his utility at point _____ with the consumption of _____.
A)B;Q6 and Q3
B)E;Q1 and Q7
C)F;Q5 and Q4
D)E;Q5 and Q2
Unlock Deck
Unlock for access to all 135 flashcards in this deck.
Unlock Deck
k this deck
80
Use the following to answer question:
(Figure: Consumer Equilibrium III)Use Figure Consumer Equilibrium III.The highest level of total utility attainable is associated with point _____ on _____.
A)C;I3
B)E;I2
C)A;I2
D)B;I1
(Figure: Consumer Equilibrium III)Use Figure Consumer Equilibrium III.The highest level of total utility attainable is associated with point _____ on _____.
A)C;I3
B)E;I2
C)A;I2
D)B;I1
Unlock Deck
Unlock for access to all 135 flashcards in this deck.
Unlock Deck
k this deck
Unlock Deck
Unlock for access to all 135 flashcards in this deck.


