Accounting for Decision Making and Control 8th Edition by Jerold Zimmerman
Edition 8ISBN: 978-0078025747Accounting for Decision Making and Control 8th Edition by Jerold Zimmerman
Edition 8ISBN: 978-0078025747 Exercise 25
Carlos Sanguine Winery
Carlos Sanguine, Inc., makes premium wines and table wines. Grapes are crushed and the freeflowing juice and the first-processing juice are made into premium wines (bottles with corks). The second- and third-processing juices are made into table wines (bottles with screw tops).
Table 1 summarizes operations for the year, and Table 2 breaks down manufacturing overhead expenses into general winery costs and production facilities costs.
Based on Tables 1 and 2 , the accounting department prepared the report in Table 3.
TABLE 1 Summary of Operations for the Year
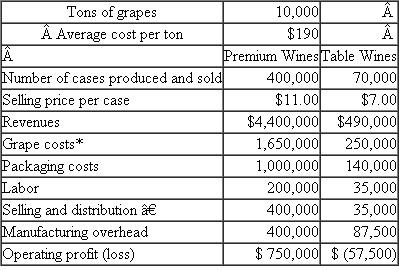 *Grape costs represent the cost of the juice placed into the two product categories and are calculated as
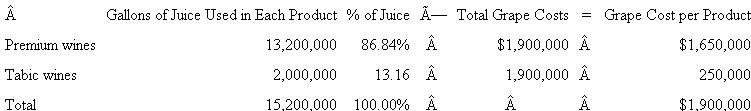 Note: A greater quantity of juice is required per case of premium wine than per case of table wine because there is more shrinkage in the premium wines.
† Each product has its own selling and distribution organization. Two-thirds of S D expenditures vary with cases produced; the remainder of the expenditures do not vary with output.
TABLE 2 Manufacturing Overhead by Products
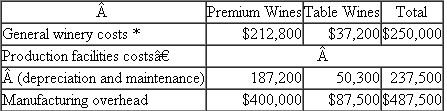 *General winery costs do not vary with the number of cases or the number of product lines and are allocated based on cases produced.
† Premium and table wines have separate production facilities. One-fourth of each of their production facilities costs varies with cases produced. The remainder are fixed costs previously incurred to provide the production capacity.
Management is concerned that the table wines have such a low margin. Some of the managers urge that these lines be dropped. Competition keeps the price down to $7 per case, which causes some managers to question how the competition could afford to sell the wine at this price.
Before making a final decision, top management asked for an analysis of the fixed and variable costs by product line and their break-even points. When management saw Table 4, the president remarked, "Well, this is the final nail in the coffin. We'd have to almost triple our sales of table wines just to break even. But we don't have that kind of capacity. We'd have to buy new tanks, thereby driving up our fixed costs and break-even points. This looks like a vicious circle. By next month, I want a detailed set of plans on what it'll cost us to shut down our table wines." Table 5 summarizes the shutdown effects.
Based on the facts presented in the case, what should management do?
TABLE 3 Product Line Cost Structure per Case
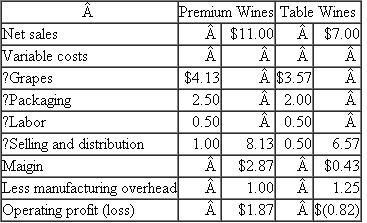 TABLE 4 Fixed and Variable Costs per Product and Product Break-Even Points
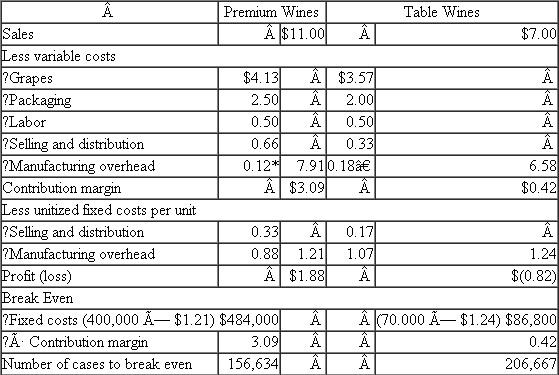 *($187,200 ×25%) ÷ 400,000 cases.
†($50,300 × 25%) ÷ 70,000 cases.
TABLE 5 Effects of Discontinuing Table Wines

Carlos Sanguine, Inc., makes premium wines and table wines. Grapes are crushed and the freeflowing juice and the first-processing juice are made into premium wines (bottles with corks). The second- and third-processing juices are made into table wines (bottles with screw tops).
Table 1 summarizes operations for the year, and Table 2 breaks down manufacturing overhead expenses into general winery costs and production facilities costs.
Based on Tables 1 and 2 , the accounting department prepared the report in Table 3.
TABLE 1 Summary of Operations for the Year
*Grape costs represent the cost of the juice placed into the two product categories and are calculated as Note: A greater quantity of juice is required per case of premium wine than per case of table wine because there is more shrinkage in the premium wines.† Each product has its own selling and distribution organization. Two-thirds of S D expenditures vary with cases produced; the remainder of the expenditures do not vary with output.
TABLE 2 Manufacturing Overhead by Products
*General winery costs do not vary with the number of cases or the number of product lines and are allocated based on cases produced.† Premium and table wines have separate production facilities. One-fourth of each of their production facilities costs varies with cases produced. The remainder are fixed costs previously incurred to provide the production capacity.
Management is concerned that the table wines have such a low margin. Some of the managers urge that these lines be dropped. Competition keeps the price down to $7 per case, which causes some managers to question how the competition could afford to sell the wine at this price.
Before making a final decision, top management asked for an analysis of the fixed and variable costs by product line and their break-even points. When management saw Table 4, the president remarked, "Well, this is the final nail in the coffin. We'd have to almost triple our sales of table wines just to break even. But we don't have that kind of capacity. We'd have to buy new tanks, thereby driving up our fixed costs and break-even points. This looks like a vicious circle. By next month, I want a detailed set of plans on what it'll cost us to shut down our table wines." Table 5 summarizes the shutdown effects.
Based on the facts presented in the case, what should management do?
TABLE 3 Product Line Cost Structure per Case
TABLE 4 Fixed and Variable Costs per Product and Product Break-Even Points *($187,200 ×25%) ÷ 400,000 cases.†($50,300 × 25%) ÷ 70,000 cases.
TABLE 5 Effects of Discontinuing Table Wines
Explanation Verified
The basic error that management is makin...
Accounting for Decision Making and Control 8th Edition by Jerold Zimmerman
Why don’t you like this exercise?
Other Minimum 8 character and maximum 255 character
Character 255


