
Intermediate Microeconomics and Its Application 12th Edition by Walter Nicholson,Christopher Snyder
Edition 12ISBN: 978-1133189022Intermediate Microeconomics and Its Application 12th Edition by Walter Nicholson,Christopher Snyder
Edition 12ISBN: 978-1133189022 Exercise 4
Can Supply and Demand Explain Changing World Oil Prices?
The price of crude oil fluctuates quite a bit on world markets. Since 2000 prices have been below $30 per barrel at times and above $130 per barrel at other times. Such wild gyrations have led many people to charge that oil prices are being "manipulated" by "speculators" and criminal investigations are launched when oil prices rise. Economists have generally not been especially sympathetic to the claim that the oil market is "rigged" and have instead tried to see how price movements might be explained by standard supply-demand analysis. In this application we take a look at this sort of analysis. We conclude with some thoughts about the effects of speculation.
A Simple Model
In prior editions of this book, we introduced a simple supply/ demand model of the world market for crude oil. A starting point for the model is the recognition that the market for crude oil is indeed worldwide. Because the commodity being traded is basically the same everywhere, various sorts of arbitrage activities should ensure that this good trades for a single "world price." If we let this price be represented by P (in dollars per barrel) and the quantity of crude oil traded by Q (measured in millions of barrels per day), our model for the year 2001 took the form: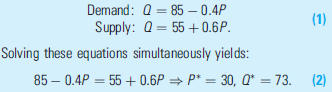
These are approximately the values that prevailed in 2001- crude oil traded at $30 per barrel and a total of about 73 million barrels per day were produced.
Increased Demand for Crude Oil
Between 2001 and 2008, the price of crude oil rose steadily. Probably the single most important cause was increasing world demand for petroleum products around the world, especially from rapidly developing economies such as China, India, and Brazil. This increase in demand can be accommodated into our simple model by just shifting the demand curve. If we assume world demand was growing at 4 percent per year, the demand curve in 2008 would have shifted outward to
Notice that we can accomplish this shift by just changing the constant term in the original demand equation. This shift is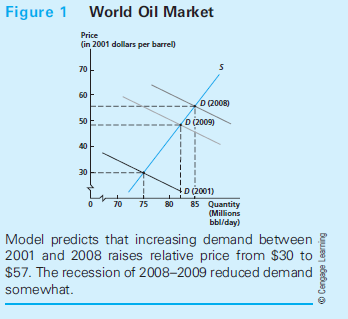
shown in Figure 1. If we now solve again for supply-demand equilibrium we get P* = 57, Q* = 87. These values form our predictions of how the model of supply and demand would have estimated how the increase in demand should have affected the world market in 2008.
Assessing the Predictions
Our estimate for crude oil production in 2008 is remarkably close to its actual value-our model predicts a quantity of 87 million barrels per day whereas actual production was about 86 million barrels per day. At first glance, however, our price prediction seems well wide of the mark-our model predicts a price of $57 whereas the actual price was about $40 higher ($97 per barrel).Before discarding our prediction, however, we need to be sure what our price means. As in all microeconomic models, the price variable shown on the vertical axis should be the "real" price-that is, it should record the price of the item being modeled relative to other prices. Because the initial specification of our model was from 2001, the price of $57 in "2001 prices" not in the "2008 prices" reflected in the $97 price recorded in the newspaper. Because of the worldwide nature of the crude oil market, we must take two factors into account if we are to compare predicted price to the actual one. First, overall inflation in the United States was about 23 percent between 2001 and 2008. Second, because oil prices are stated in dollars, we must also take account of the fact that the world value of the dollar declined by about 35 percent between 2001 and 2008. Ultimately therefore we should adjust the $97 price downward by about 40 percent to phrase it in the 2001 prices that characterize our model. Making this adjustment yields a real price in 2008 of about $58 per barrel-very close to our predicted value of $57.
Oil Prices During the Great Recession
The worldwide recession that started with the financial crisis of 2008 caused a significant contraction in the demand for crude oil. Still, this contraction should not have changed the situation illustrated in Figure 1 by very much. For example, the demand for crude oil fell by 5 percent in 2009. That should have shifted the demand curve to Q = 106 - 0.4P and (as Figure 1 shows) the new market equilibrium would be P* = 49, Q* = 84. Again the prediction for quantity is very close to the value that prevailed in 2009, but the price seems off. We only predicted a decline of $8 whereas the nominal price of crude oil in 2009 fell to by more than $35 to about $60 per barrel. Undoubtedly, part of the decline can be explained by the strengthening of the dollar in 2009 as the U.S. currency became a haven for people worried about the economy. But the size of the decline seems larger than might have been anticipated by the simple application of supply and demand logic.
Speculation in the Crude Oil Market
As for many commodities, the prices for crude oil fluctuate more than might be expected on the basis of supply and demand considerations only. For example, although the average price of crude oil was about $94 per barrel in 2012, the price was as high as $110 and as low as $79 during the year. Because the factors that determine the location of supply and demand curves (costs of drilling or consumer incomes) change only slowly over time, something else must be going on. One possibility is that prices in this market are being affected by "speculation." Giving a precise definition to this term is difficult, but at its heart speculation consists of placing bets on the price of a commodity rather than buying or selling the commodity for its usefulness. For example, someone who thinks the price of crude oil will rise over the next six months could buy a tankful of oil today and hold it for sale later.
Speculation, Equilibrium Prices and Political Posturing
Economists generally doubt that these sorts of speculative activity can affect equilibrium prices over the long term. In Chapter 9, we will briefly examine the reasons for this belief. The main point we will make is that, while there is no doubt that speculation can cause prices to fluctuate around their equilibrium values, there is no reason to expect such activity to push prices in any particular direction. Still, politicians and other pundits cannot refrain from blaming "speculators" every time the price for a major commodity rises (though they seldom blame speculators for declines in price). For example, following the recession-induced decline in oil prices in 2009, the market gradually returned to its earlier equilibrium price of about $94 per barrel in 2012. Because this price rise was occurring in an election year, politicians once again blamed "speculators" for the increase. One widely reported study made the (preposterously precise) claim that speculation added $23.39 to the price of a barrel2 of crude oil in early 2012. Numerous Congressional committees began investigations, hoping to catch speculators in the act of speculating. If the past is any guide, it is likely that they will find that speculative activity in the crude oil market was quite legal and had little, if any, impact on long-term prices.
About half of the world's production of crude oil is controlled by nations that belong to the Organization of Petroleum Exporting Countries (OPEC). How can the operations of this organization be taken into account in our simple model of supply and demand?
The price of crude oil fluctuates quite a bit on world markets. Since 2000 prices have been below $30 per barrel at times and above $130 per barrel at other times. Such wild gyrations have led many people to charge that oil prices are being "manipulated" by "speculators" and criminal investigations are launched when oil prices rise. Economists have generally not been especially sympathetic to the claim that the oil market is "rigged" and have instead tried to see how price movements might be explained by standard supply-demand analysis. In this application we take a look at this sort of analysis. We conclude with some thoughts about the effects of speculation.
A Simple Model
In prior editions of this book, we introduced a simple supply/ demand model of the world market for crude oil. A starting point for the model is the recognition that the market for crude oil is indeed worldwide. Because the commodity being traded is basically the same everywhere, various sorts of arbitrage activities should ensure that this good trades for a single "world price." If we let this price be represented by P (in dollars per barrel) and the quantity of crude oil traded by Q (measured in millions of barrels per day), our model for the year 2001 took the form:
These are approximately the values that prevailed in 2001- crude oil traded at $30 per barrel and a total of about 73 million barrels per day were produced.
Increased Demand for Crude Oil
Between 2001 and 2008, the price of crude oil rose steadily. Probably the single most important cause was increasing world demand for petroleum products around the world, especially from rapidly developing economies such as China, India, and Brazil. This increase in demand can be accommodated into our simple model by just shifting the demand curve. If we assume world demand was growing at 4 percent per year, the demand curve in 2008 would have shifted outward to
Notice that we can accomplish this shift by just changing the constant term in the original demand equation. This shift is
shown in Figure 1. If we now solve again for supply-demand equilibrium we get P* = 57, Q* = 87. These values form our predictions of how the model of supply and demand would have estimated how the increase in demand should have affected the world market in 2008.
Assessing the Predictions
Our estimate for crude oil production in 2008 is remarkably close to its actual value-our model predicts a quantity of 87 million barrels per day whereas actual production was about 86 million barrels per day. At first glance, however, our price prediction seems well wide of the mark-our model predicts a price of $57 whereas the actual price was about $40 higher ($97 per barrel).Before discarding our prediction, however, we need to be sure what our price means. As in all microeconomic models, the price variable shown on the vertical axis should be the "real" price-that is, it should record the price of the item being modeled relative to other prices. Because the initial specification of our model was from 2001, the price of $57 in "2001 prices" not in the "2008 prices" reflected in the $97 price recorded in the newspaper. Because of the worldwide nature of the crude oil market, we must take two factors into account if we are to compare predicted price to the actual one. First, overall inflation in the United States was about 23 percent between 2001 and 2008. Second, because oil prices are stated in dollars, we must also take account of the fact that the world value of the dollar declined by about 35 percent between 2001 and 2008. Ultimately therefore we should adjust the $97 price downward by about 40 percent
to phrase it in the 2001 prices that characterize our model. Making this adjustment yields a real price in 2008 of about $58 per barrel-very close to our predicted value of $57.Oil Prices During the Great Recession
The worldwide recession that started with the financial crisis of 2008 caused a significant contraction in the demand for crude oil. Still, this contraction should not have changed the situation illustrated in Figure 1 by very much. For example, the demand for crude oil fell by 5 percent in 2009. That should have shifted the demand curve to Q = 106 - 0.4P and (as Figure 1 shows) the new market equilibrium would be P* = 49, Q* = 84. Again the prediction for quantity is very close to the value that prevailed in 2009, but the price seems off. We only predicted a decline of $8 whereas the nominal price of crude oil in 2009 fell to by more than $35 to about $60 per barrel. Undoubtedly, part of the decline can be explained by the strengthening of the dollar in 2009 as the U.S. currency became a haven for people worried about the economy. But the size of the decline seems larger than might have been anticipated by the simple application of supply and demand logic.
Speculation in the Crude Oil Market
As for many commodities, the prices for crude oil fluctuate more than might be expected on the basis of supply and demand considerations only. For example, although the average price of crude oil was about $94 per barrel in 2012, the price was as high as $110 and as low as $79 during the year. Because the factors that determine the location of supply and demand curves (costs of drilling or consumer incomes) change only slowly over time, something else must be going on. One possibility is that prices in this market are being affected by "speculation." Giving a precise definition to this term is difficult, but at its heart speculation consists of placing bets on the price of a commodity rather than buying or selling the commodity for its usefulness. For example, someone who thinks the price of crude oil will rise over the next six months could buy a tankful of oil today and hold it for sale later.
Speculation, Equilibrium Prices and Political Posturing
Economists generally doubt that these sorts of speculative activity can affect equilibrium prices over the long term. In Chapter 9, we will briefly examine the reasons for this belief. The main point we will make is that, while there is no doubt that speculation can cause prices to fluctuate around their equilibrium values, there is no reason to expect such activity to push prices in any particular direction. Still, politicians and other pundits cannot refrain from blaming "speculators" every time the price for a major commodity rises (though they seldom blame speculators for declines in price). For example, following the recession-induced decline in oil prices in 2009, the market gradually returned to its earlier equilibrium price of about $94 per barrel in 2012. Because this price rise was occurring in an election year, politicians once again blamed "speculators" for the increase. One widely reported study made the (preposterously precise) claim that speculation added $23.39 to the price of a barrel2 of crude oil in early 2012. Numerous Congressional committees began investigations, hoping to catch speculators in the act of speculating. If the past is any guide, it is likely that they will find that speculative activity in the crude oil market was quite legal and had little, if any, impact on long-term prices.
About half of the world's production of crude oil is controlled by nations that belong to the Organization of Petroleum Exporting Countries (OPEC). How can the operations of this organization be taken into account in our simple model of supply and demand?
Explanation Verified
The Organization of Petroleum Exporting ...
Intermediate Microeconomics and Its Application 12th Edition by Walter Nicholson,Christopher Snyder
Why don’t you like this exercise?
Other Minimum 8 character and maximum 255 character
Character 255


