
Intermediate Microeconomics and Its Application 12th Edition by Walter Nicholson,Christopher Snyder
Edition 12ISBN: 978-1133189022Intermediate Microeconomics and Its Application 12th Edition by Walter Nicholson,Christopher Snyder
Edition 12ISBN: 978-1133189022 Exercise 36
The Equity Premium Puzzle
As shown in Figure 4.4, differences in the rates of return of financial assets reflect, in part, the differing risks associated with those assets. The historical data show that stocks also called equities have indeed had higher returns than bonds to compensate for that risk. In fact, returns on common stock have been so favorable that they pose a puzzle to economists.
Historical Rates of Return
Table 1 cites some of the most widely used rate of return data for U.S. financial markets, compiled by Ibbotson Associates. These data show that over the period 1926-2012, common stocks of large companies provided average annual rates of return which exceeded those on long-term bonds by 5 percent per year, whether the bonds of corporations or the government are considered. The equity premium is even larger if the set of common stocks is expanded to include small companies, the average return on which was a whopping 16.5 percent over the period. The equity premium is larger still if rather than long term, we look at short-term government bonds: the average return on one-year treasury bills was a measly 3.1 percent over the period, essentially no better than inflation.
One way to measure the risk associated with various assets uses the "standard deviation" of their annual returns. This measure shows the range in which roughly two-thirds of the returns fall. For the case of, say, common stocks, the average annual return was 11.8 percent, and the standard deviation shows that in two-thirds of the years the average was within± 20.2 percent of this figure. In other words, in two-thirds of the years, common stocks returned more than -8.4 percent and less than ±32.0 percent. Rates of return on stocks were much more variable than those on bonds.
The Excess Return on Common Stocks
Although the qualitative findings from data such as those in Table 1 are consistent with risk aversion, the quantitative nature of the extra returns to common stock holding are inconsistent with many other studies of risk. These other studies suggest that individuals would accept the extra risk that stocks carry for an extra return of around 1 percent per year- significantly less than the 5 percent extra actually provided.
One set of explanations focuses on the possibility that the figures in Table 1 understate the risk of stocks. The risk individuals really care about is changes in their consumption plans. If returns on stocks were highly correlated with the business cycle, then they might pose extra risks because individuals would face a double risk from economic downturns-a fall in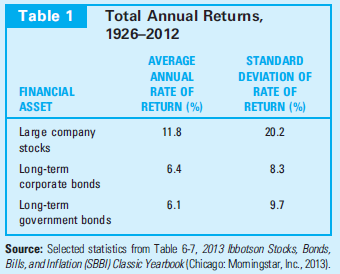
income and a fall in returns from investments. Behavioral economists have offered another explanation: individuals may experience extra psychological pain from losing money on investments in any given period beyond any consequences for their ultimate wealth. (For more on this type of behavioral bias, see the section entitled "Prospect Theory" in Chapter 17.) A recent explanation of the equity premium hinges on catastrophes (wars, riots, depressions, and so on) that have the potential of wiping out much of the value of stocks but so rare that they are seldom experienced, if at all, even in a long period spanning decades. The United States may have experienced an unusually tranquil period during 1926-2102 compared to other periods or countries; subtracting catastrophic losses that might have occurred in a less tranquil period would bring down the average for the return on stocks. Work remains to convince the economics profession that any of these explanations can account for the large equity premium on its own.
The real return on short-term government bonds implied by Table 1 is less than 1 percent per year. Why do people save at all if this relatively risk-free return is so low?
Explanation Verified
The securities and bonds issued by a gov...
Intermediate Microeconomics and Its Application 12th Edition by Walter Nicholson,Christopher Snyder
Why don’t you like this exercise?
Other Minimum 8 character and maximum 255 character
Character 255


