
An Introduction to Community Health 7th Edition by James McKenzie,Robert Pinger,Jerome Kotecki
Edition 7ISBN: 978-0763790110An Introduction to Community Health 7th Edition by James McKenzie,Robert Pinger,Jerome Kotecki
Edition 7ISBN: 978-0763790110 Exercise 23
Look at the data in Table 1. What conclusion can you draw about the risk for acquiring tuberculosis for populations in each age group? Write down your answer. Now examine Table 2. Which age groups exhibit the highest disease rates? Explain why it is important to calculate rates to report disease outbreaks accurately.
Table 1 Reported Tuberculosis Cases, by Age Group, Low Socioeconomic Area, City of Dixon, 196 0
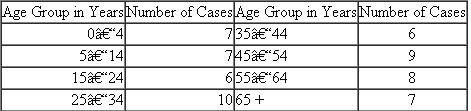 Source: Centers for Disease Control and Prevention.
Table 2 Reported Tuberculosis Cases and Incidence Rates per 100,000, Low Socioeconomic Area, City of Dixon, 196 0
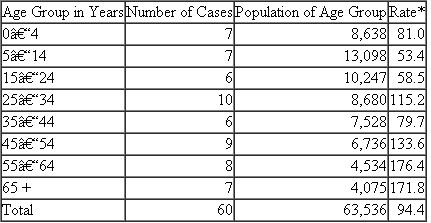 *Example: 7 cases ÷ 8,638 population × 100,000 = 81.0.
Source: Centers for Disease Control and Prevention.
Table 1 Reported Tuberculosis Cases, by Age Group, Low Socioeconomic Area, City of Dixon, 196 0
Source: Centers for Disease Control and Prevention.Table 2 Reported Tuberculosis Cases and Incidence Rates per 100,000, Low Socioeconomic Area, City of Dixon, 196 0
*Example: 7 cases ÷ 8,638 population × 100,000 = 81.0.Source: Centers for Disease Control and Prevention.
Explanation Verified
Following are the conclusion based on ta...
An Introduction to Community Health 7th Edition by James McKenzie,Robert Pinger,Jerome Kotecki
Why don’t you like this exercise?
Other Minimum 8 character and maximum 255 character
Character 255


