expand icon
book Macroeconomics 10th Edition by Roger Arnold cover

Macroeconomics 10th Edition by Roger Arnold

Edition 10ISBN: 978-1111823016
book Macroeconomics 10th Edition by Roger Arnold cover

Macroeconomics 10th Edition by Roger Arnold

Edition 10ISBN: 978-1111823016
Exercise 2
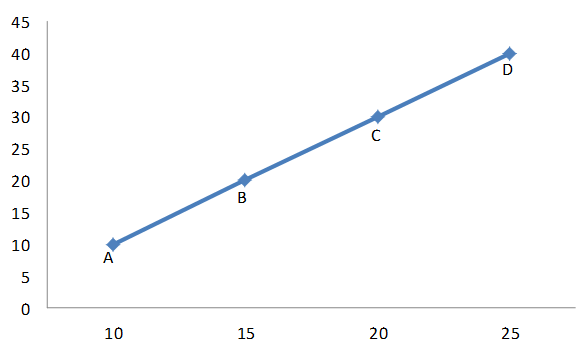
In Exhibit 4(b), determine the slope between points A and D.
Explanation
Verified
like image
like image
In order to know how much one variable changes as the other variable change we need to calculate the slope of the line or curve which represents the relationship between two variables. If we represents the relationship between two variable in a 2X2 diagram, then
the slope of a line is the ratio of the change in the variable on the vertical axis to the change in the variable on the horizontal axis.
If Y is on the vertical axis and X is on the horizontal axis, the equation of the slope is given as,
In order to know how much one variable changes as the other variable change we need to calculate the slope of the line or curve which represents the relationship between two variables. If we represents the relationship between two variable in a 2X2 diagram, then  the slope of a line is the ratio of the change in the variable on the vertical axis to the change in the variable on the horizontal axis. If Y is on the vertical axis and X is on the horizontal axis, the equation of the slope is given as,    Where, Y =change in variable Y and X= change in variable X. The Exhibit 4(a) is given as,    Here we measure X in horizontal axis and Y in vertical axis. To determine the slope between point A and D, we measure the change in both the variables between A and D. The value of Y at point A is 10 and at D it is 40, thus the change in variable Y between point A and D is,   Y=     Similarly, the value of X at A is 10 and at D it is 25, thus the change in X is  X=     .  Therefore,     Hence, the slope between A and D;    . Where, Y =change in variable Y and X= change in variable X.
The Exhibit 4(a) is given as,
In order to know how much one variable changes as the other variable change we need to calculate the slope of the line or curve which represents the relationship between two variables. If we represents the relationship between two variable in a 2X2 diagram, then  the slope of a line is the ratio of the change in the variable on the vertical axis to the change in the variable on the horizontal axis. If Y is on the vertical axis and X is on the horizontal axis, the equation of the slope is given as,    Where, Y =change in variable Y and X= change in variable X. The Exhibit 4(a) is given as,    Here we measure X in horizontal axis and Y in vertical axis. To determine the slope between point A and D, we measure the change in both the variables between A and D. The value of Y at point A is 10 and at D it is 40, thus the change in variable Y between point A and D is,   Y=     Similarly, the value of X at A is 10 and at D it is 25, thus the change in X is  X=     .  Therefore,     Hence, the slope between A and D;    . Here we measure X in horizontal axis and Y in vertical axis.
To determine the slope between point A and D, we measure the change in both the variables between A and D. The value of Y at point A is 10 and at D it is 40, thus the change in variable Y between point A and D is,
Y=
In order to know how much one variable changes as the other variable change we need to calculate the slope of the line or curve which represents the relationship between two variables. If we represents the relationship between two variable in a 2X2 diagram, then  the slope of a line is the ratio of the change in the variable on the vertical axis to the change in the variable on the horizontal axis. If Y is on the vertical axis and X is on the horizontal axis, the equation of the slope is given as,    Where, Y =change in variable Y and X= change in variable X. The Exhibit 4(a) is given as,    Here we measure X in horizontal axis and Y in vertical axis. To determine the slope between point A and D, we measure the change in both the variables between A and D. The value of Y at point A is 10 and at D it is 40, thus the change in variable Y between point A and D is,   Y=     Similarly, the value of X at A is 10 and at D it is 25, thus the change in X is  X=     .  Therefore,     Hence, the slope between A and D;    . Similarly, the value of X at A is 10 and at D it is 25, thus the change in X is
X=
In order to know how much one variable changes as the other variable change we need to calculate the slope of the line or curve which represents the relationship between two variables. If we represents the relationship between two variable in a 2X2 diagram, then  the slope of a line is the ratio of the change in the variable on the vertical axis to the change in the variable on the horizontal axis. If Y is on the vertical axis and X is on the horizontal axis, the equation of the slope is given as,    Where, Y =change in variable Y and X= change in variable X. The Exhibit 4(a) is given as,    Here we measure X in horizontal axis and Y in vertical axis. To determine the slope between point A and D, we measure the change in both the variables between A and D. The value of Y at point A is 10 and at D it is 40, thus the change in variable Y between point A and D is,   Y=     Similarly, the value of X at A is 10 and at D it is 25, thus the change in X is  X=     .  Therefore,     Hence, the slope between A and D;    . .
Therefore,
In order to know how much one variable changes as the other variable change we need to calculate the slope of the line or curve which represents the relationship between two variables. If we represents the relationship between two variable in a 2X2 diagram, then  the slope of a line is the ratio of the change in the variable on the vertical axis to the change in the variable on the horizontal axis. If Y is on the vertical axis and X is on the horizontal axis, the equation of the slope is given as,    Where, Y =change in variable Y and X= change in variable X. The Exhibit 4(a) is given as,    Here we measure X in horizontal axis and Y in vertical axis. To determine the slope between point A and D, we measure the change in both the variables between A and D. The value of Y at point A is 10 and at D it is 40, thus the change in variable Y between point A and D is,   Y=     Similarly, the value of X at A is 10 and at D it is 25, thus the change in X is  X=     .  Therefore,     Hence, the slope between A and D;    . Hence, the slope between A and D;
In order to know how much one variable changes as the other variable change we need to calculate the slope of the line or curve which represents the relationship between two variables. If we represents the relationship between two variable in a 2X2 diagram, then  the slope of a line is the ratio of the change in the variable on the vertical axis to the change in the variable on the horizontal axis. If Y is on the vertical axis and X is on the horizontal axis, the equation of the slope is given as,    Where, Y =change in variable Y and X= change in variable X. The Exhibit 4(a) is given as,    Here we measure X in horizontal axis and Y in vertical axis. To determine the slope between point A and D, we measure the change in both the variables between A and D. The value of Y at point A is 10 and at D it is 40, thus the change in variable Y between point A and D is,   Y=     Similarly, the value of X at A is 10 and at D it is 25, thus the change in X is  X=     .  Therefore,     Hence, the slope between A and D;    . .
close menu
Macroeconomics 10th Edition by Roger Arnold
cross icon