
Macroeconomics 20th Edition by Campbell McConnell ,Stanley Brue ,Sean Flynn
Edition 20ISBN: 978-0077660772Macroeconomics 20th Edition by Campbell McConnell ,Stanley Brue ,Sean Flynn
Edition 20ISBN: 978-0077660772 Exercise 36
The figure below shows the supply curve for tennis balls, S 1, for Drop Volley tennis, a producer of tennis equipment. Use the figure and the table below to give your answers to the following questions. LO2 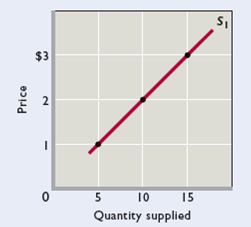
a. Use the figure to fill in the quantity supplied on supply curve S 1 for each price in the table below.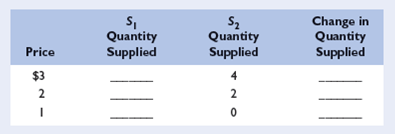
b. If production costs were to increase, the quantities supplied at each price would be as shown by the third column of the table (" S 2 Quantity Supplied"). Use that data to draw supply curve S 2 on the same graph as supply curve S 1.
c. In the fourth column of the table, enter the amount by which the quantity supplied at each price changes due to the increase in product costs. (Use positive numbers for increases and negative numbers for decreases.) d. Did the increase in production costs cause a "decrease in supply" or a "decrease in quantity supplied"?
Explanation Verified
a. The table below shows the correspondi...
Macroeconomics 20th Edition by Campbell McConnell ,Stanley Brue ,Sean Flynn
Why don’t you like this exercise?
Other Minimum 8 character and maximum 255 character
Character 255


