
Macroeconomics 20th Edition by Campbell McConnell ,Stanley Brue ,Sean Flynn
Edition 20ISBN: 978-0077660772Macroeconomics 20th Edition by Campbell McConnell ,Stanley Brue ,Sean Flynn
Edition 20ISBN: 978-0077660772 Exercise 7
(For students who were assigned Chapter 28) Assume that, without taxes, the consumption schedule for an economy is as shown below: LO1 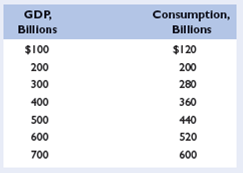
a. Graph this consumption schedule. What is the size of the MPC?
b. Assume that a lump-sum (regressive) tax of $10 billion is imposed at all levels of GDP. Calculate the tax rate at each level of GDP. Graph the resulting consumption schedule and compare the MPC and the multiplier with those of the pretax consumption schedule.
c. Now suppose a proportional tax with a 10 percent tax rate is imposed instead of the regressive tax. Calculate and graph the new consumption schedule and note the MPC (tax inclusive) and the multiplier.
d. Finally, impose a progressive tax such that the tax rate is 0 percent when GDP is $100, 5 percent at $200, 10 percent at $300, 15 percent at $400, and so forth. Determine and graph the new consumption schedule, noting the effect of this tax system on the MPC (tax inclusive) and the multiplier.
e. Use a graph similar to Figure 30.3 to show why proportional and progressive taxes contribute to greater economic stability, while a regressive tax does not.
Explanation Verified
The Consumption schedule is reproduced b...
Macroeconomics 20th Edition by Campbell McConnell ,Stanley Brue ,Sean Flynn
Why don’t you like this exercise?
Other Minimum 8 character and maximum 255 character
Character 255


