
Macroeconomics 20th Edition by Campbell McConnell,Stanley Brue,Sean Flynn
Edition 20ISBN: 978-0077660895Macroeconomics 20th Edition by Campbell McConnell,Stanley Brue,Sean Flynn
Edition 20ISBN: 978-0077660895 Exercise 29
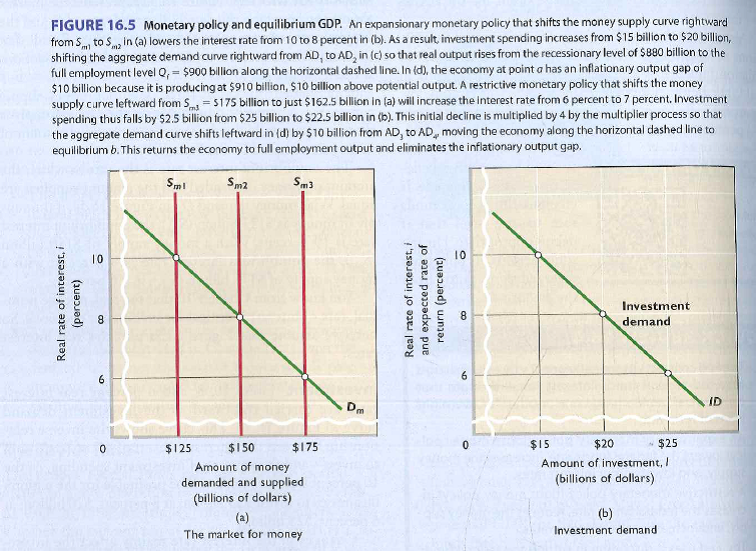
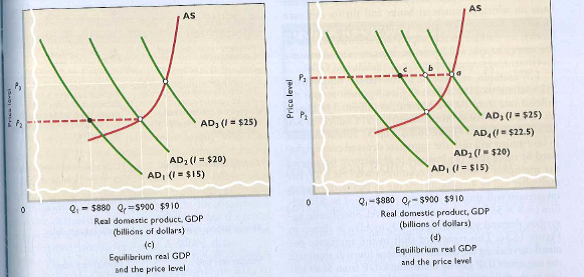
A successful restrictive monetary policy is evidenced by a shift in the money supply curve from:
A) S m3 to a point halfway between S m2 and S m3 , a decrease in investment from $25 billion to $22.5 billion, and a decline in aggregate demand from AD3 to AD4.
B) S m1 to S m2 an increase in investment from $20 billion to $25 billion, and an increase in real GDP from Q 1 to Q f.
C) S m3 to S m2 , a decrease in investment from $25 billion to $20 billion, and a decline in the price level from P 3 to P 2.
D) S m3 to S m2 , a decrease in investment from $25 billion to $20 billion, and an increase in aggregate demand from AD 2 to AD 3.
Explanation Verified
Hence, the correct answer is a. ![]() , to a ...
, to a ...
Macroeconomics 20th Edition by Campbell McConnell,Stanley Brue,Sean Flynn
Why don’t you like this exercise?
Other Minimum 8 character and maximum 255 character
Character 255


