Managerial Economics: Applications, Strategy and Tactics 12th Edition by James McGuigan, Charles Moyer, Frederick Harris
Edition 12ISBN: 9781439079232Managerial Economics: Applications, Strategy and Tactics 12th Edition by James McGuigan, Charles Moyer, Frederick Harris
Edition 12ISBN: 9781439079232 Exercise 8
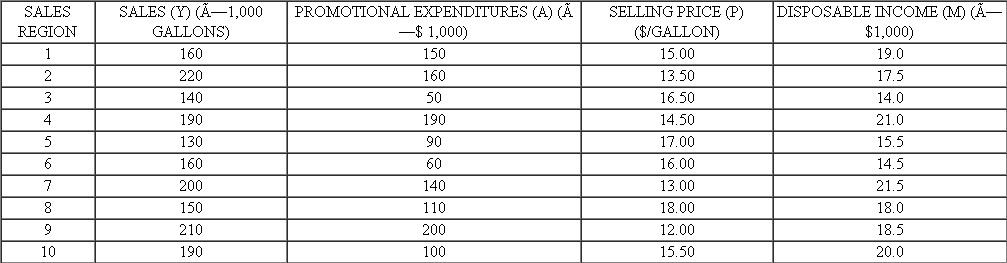
Consider again the Sherwin-Williams Company example discussed in this chapter (see Table). Suppose one is interested in developing a multiple regression model with paint sales (Y) as the dependent variable and promotional expenditures (A) and selling price (P) as the independent variables.
a. Determine the estimated regression line.
b. Give an economic interpretation of the estimated slope (bs) coefficients.
c. Test the hypothesis (at the 5 percent level of significance) that there is no relationship between the dependent variable and each of the independent variables.
d. Determine the coefficient of determination.
e. Perform an analysis of variance on the regression, including an F-test of the overall significance of the results (at the 5 percent level).
f. Based on the regression model, determine the best estimate of paint sales in a sales region where promotional expenditures are $80(000) and the selling price is $12.50.
g. Determine the point promotional and price elasticities at the values of promotional expenditures and selling price given in part (f).
TABLE SHERWIN-WILLIAMS COMPANY DATA
Explanation Verified
a) The data below shows the sales of pai...
Managerial Economics: Applications, Strategy and Tactics 12th Edition by James McGuigan, Charles Moyer, Frederick Harris
Why don’t you like this exercise?
Other Minimum 8 character and maximum 255 character
Character 255


