
Managerial Economics: Applications, Strategy and Tactics 12th Edition by James McGuigan, Charles Moyer, Frederick Harris
Edition 12ISBN: 9781439079232Managerial Economics: Applications, Strategy and Tactics 12th Edition by James McGuigan, Charles Moyer, Frederick Harris
Edition 12ISBN: 9781439079232 Exercise 9
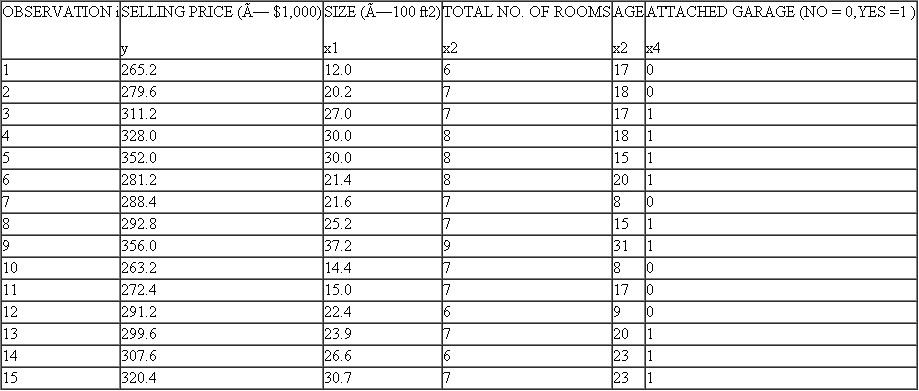
The county assessor (see Exercise) feels that the use of more independent variables in the regression equation might improve the overall explanatory power of the model. In addition to size, the assessor feels that the total number of rooms, age, and whether or not the house has an attached garage might be important variables
affecting selling price. The data for the 15 randomly selected dwellings are shown in the following table.
a. Using a computer regression program, determine the estimated regression equation with the four explanatory variables shown in the following table.
b. Give an economic interpretation of each of the estimated regression coefficients.
c. Which of the independent variables (if any) is statistically significant (at the.05 level) in explaining selling price
d. What proportion of the total variation in selling price is explained by the regression model
e. Perform an F-test (at the 5 percent significance level) of the overall explanatory power of the model.
f. Construct an approximate 95 percent prediction interval for the selling price of a 15-year-old house having 1,800 square feet, 7 rooms, and an attached garage.
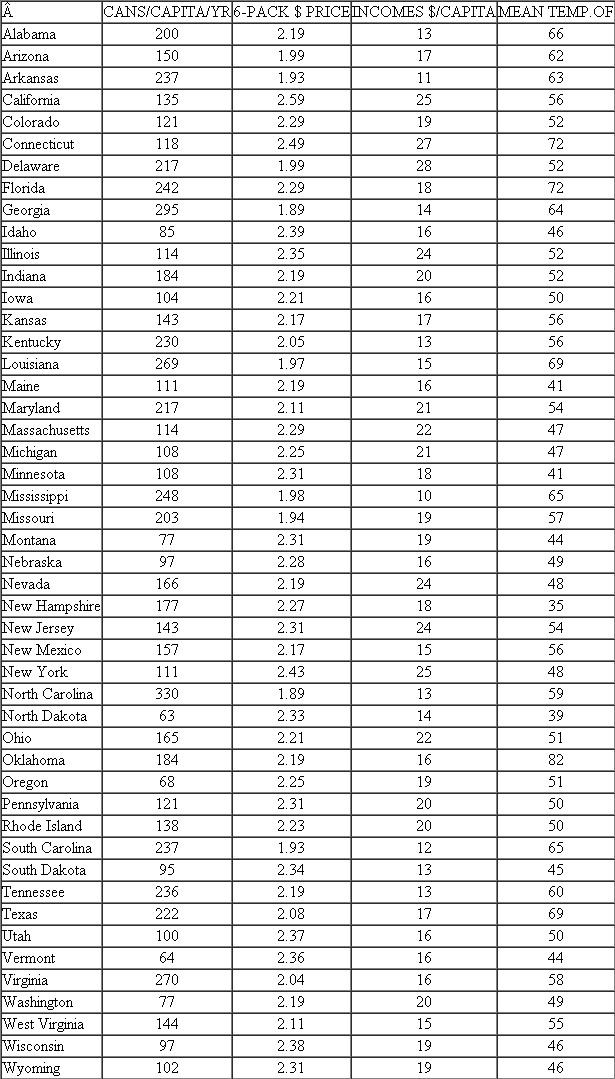
 carefully examined. Demand forecasts usually rely on time-series data. In contrast, cross-section data appear in Table. Soft drink consumption in cans per capita per year is related to six-pack price, income per capita, and mean temperature across the 48 contiguous states in the United States.
Exercise
Cascade Pharmaceuticals Company developed the following regression model, using time-series data from the past 33 quarters, for one of its non-prescription cold remedies:
Y = 1.04 + 0.24X1 0.27X2
whereY = quarterly sales ðin thousands of casesÞ of the cold remedy
X1 = Cascade's quarterly advertising ð× $1,000Þ for the cold remedy
X2 = competitors' advertising for similar products ð× $10,000)
Here is additional information concerning the regression model:
sb1 = 0:032 sb2 = 0:070
R 2 = 0:64 se = 1:63 F-statistic = 31:402
Durbin-Watson (d) statistic = 0.4995
a. Which of the independent variables (if any) appears to be statistically significant (at the 0.05 level) in explaining sales of the cold remedy
b. What proportion of the total variation in sales is explained by the regression equation
c. Perform an F-test (at the 0.05 level) of the overall explanatory power of the model.
d. What additional statistical information (if any) would you find useful in the evaluation of this model
TABLE Soft Drink Demand Data (available as an Excel file on this book's Web site)
affecting selling price. The data for the 15 randomly selected dwellings are shown in the following table.
a. Using a computer regression program, determine the estimated regression equation with the four explanatory variables shown in the following table.
b. Give an economic interpretation of each of the estimated regression coefficients.
c. Which of the independent variables (if any) is statistically significant (at the.05 level) in explaining selling price
d. What proportion of the total variation in selling price is explained by the regression model
e. Perform an F-test (at the 5 percent significance level) of the overall explanatory power of the model.
f. Construct an approximate 95 percent prediction interval for the selling price of a 15-year-old house having 1,800 square feet, 7 rooms, and an attached garage.
carefully examined. Demand forecasts usually rely on time-series data. In contrast, cross-section data appear in Table. Soft drink consumption in cans per capita per year is related to six-pack price, income per capita, and mean temperature across the 48 contiguous states in the United States.Exercise
Cascade Pharmaceuticals Company developed the following regression model, using time-series data from the past 33 quarters, for one of its non-prescription cold remedies:
Y = 1.04 + 0.24X1 0.27X2
whereY = quarterly sales ðin thousands of casesÞ of the cold remedy
X1 = Cascade's quarterly advertising ð× $1,000Þ for the cold remedy
X2 = competitors' advertising for similar products ð× $10,000)
Here is additional information concerning the regression model:
sb1 = 0:032 sb2 = 0:070
R 2 = 0:64 se = 1:63 F-statistic = 31:402
Durbin-Watson (d) statistic = 0.4995
a. Which of the independent variables (if any) appears to be statistically significant (at the 0.05 level) in explaining sales of the cold remedy
b. What proportion of the total variation in sales is explained by the regression equation
c. Perform an F-test (at the 0.05 level) of the overall explanatory power of the model.
d. What additional statistical information (if any) would you find useful in the evaluation of this model
TABLE Soft Drink Demand Data (available as an Excel file on this book's Web site)
Explanation Verified
a) The data below shows the selling pric...
Managerial Economics: Applications, Strategy and Tactics 12th Edition by James McGuigan, Charles Moyer, Frederick Harris
Why don’t you like this exercise?
Other Minimum 8 character and maximum 255 character
Character 255


