
Understanding Basic Statistics 6th Edition by Charles Henry Brase,Corrinne Pellillo Brase
Edition 6ISBN: 978-1111827021Understanding Basic Statistics 6th Edition by Charles Henry Brase,Corrinne Pellillo Brase
Edition 6ISBN: 978-1111827021 Exercise 39
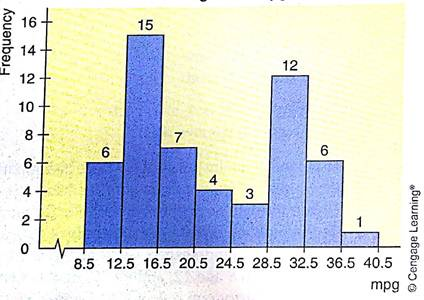
Critical Thinking Look at the histogram in Figure 2-10(a), which shows mileage, in miles per gallon (mpg), for a random selection of passenger cars (Reference: Consumer Reports ).
(a). Is the shape of the histogram essentially bimodal
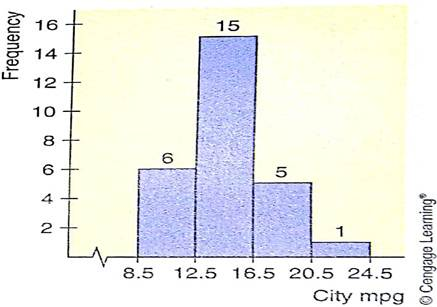
(b). Jose looked at the raw data and discovered that the 54 data values included both the city and the highway mileages for 27 cars. He used the city mileages for the 27 cars to make the histogram in Figure 2-10(b). Using this information and Figure 2-10, parts (a) and (b), construct a histogram for the highway mileages of the same cars. Use class boundaries 16.5, 20.5, 24.5, 28.5, 32.5, 36.5, and 40.5.
(a) Histogram of mpg
(b) Histogram of City mpg
(a). Is the shape of the histogram essentially bimodal
(b). Jose looked at the raw data and discovered that the 54 data values included both the city and the highway mileages for 27 cars. He used the city mileages for the 27 cars to make the histogram in Figure 2-10(b). Using this information and Figure 2-10, parts (a) and (b), construct a histogram for the highway mileages of the same cars. Use class boundaries 16.5, 20.5, 24.5, 28.5, 32.5, 36.5, and 40.5.
(a) Histogram of mpg
(b) Histogram of City mpg
Explanation Verified
(a) There are 2 high points on the histo...
Understanding Basic Statistics 6th Edition by Charles Henry Brase,Corrinne Pellillo Brase
Why don’t you like this exercise?
Other Minimum 8 character and maximum 255 character
Character 255


