
Understanding Basic Statistics 6th Edition by Charles Henry Brase,Corrinne Pellillo Brase
Edition 6ISBN: 978-1111827021Understanding Basic Statistics 6th Edition by Charles Henry Brase,Corrinne Pellillo Brase
Edition 6ISBN: 978-1111827021 Exercise 26
Agriculture: Apple Trees The following data represent trunk circumferences (in mm) for a random sample of 60 four-year-old apple trees at East Mulling Agriculture Research Station in England (Reference: S. C. Pearce, University of Kent at Canterbury). Note: These data are also available for download at the Online Study Center.
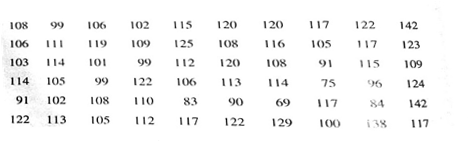
(a) Make a frequency table with seven classes showing class limits class boundaries, midpoints, frequencies, and relative frequencies
(b) Draw a histogram
(c) Draw a relative-frequency histogram.
(d) Identify the shape of the distribution.
(e) Draw an ogive.
(a) Make a frequency table with seven classes showing class limits class boundaries, midpoints, frequencies, and relative frequencies
(b) Draw a histogram
(c) Draw a relative-frequency histogram.
(d) Identify the shape of the distribution.
(e) Draw an ogive.
Explanation Verified
730-2.3-5CR SA Code: 3228
SR Code: 4499
...
Understanding Basic Statistics 6th Edition by Charles Henry Brase,Corrinne Pellillo Brase
Why don’t you like this exercise?
Other Minimum 8 character and maximum 255 character
Character 255


