
Understanding Basic Statistics 6th Edition by Charles Henry Brase,Corrinne Pellillo Brase
Edition 6ISBN: 978-1111827021Understanding Basic Statistics 6th Edition by Charles Henry Brase,Corrinne Pellillo Brase
Edition 6ISBN: 978-1111827021 Exercise 46
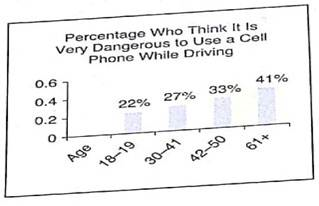
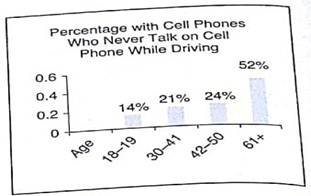
Interpretation A Harris Poll surveyed 2085 U.S. adults regarding use of cell phones while driving. All the adults were asked their opinion regarding how dangerous it is for a driver to use a cell phone while driving. Graph (a) shows the percentage responding "very dangerous" by age group. Only the adults who drive and who have a cell phone were asked how often they talk on the cell phone while driving. Graph (b) shows the percentage responding "never" by age group.
Cell Phone Use and Driving
(a)
(b)
Source: A Harris Poll.
(a) What trend does this survey portray regarding are group and the option that using a cell phone while driving is very dangerous
(b) How does the behavior of never using a cell phone while driving compare to the option that using a cell phone while driving is dangerous Do you think that some of the difference in the behavior (never use a cell phone while driving) and the opinion (using a cell phone while driving is very dangerous) can be attributed to the difference in the survey population Explain.
Explanation Verified
(a) In both graphs, the trend is that th...
Understanding Basic Statistics 6th Edition by Charles Henry Brase,Corrinne Pellillo Brase
Why don’t you like this exercise?
Other Minimum 8 character and maximum 255 character
Character 255


