
Understanding Basic Statistics 6th Edition by Charles Henry Brase,Corrinne Pellillo Brase
Edition 6ISBN: 978-1111827021Understanding Basic Statistics 6th Edition by Charles Henry Brase,Corrinne Pellillo Brase
Edition 6ISBN: 978-1111827021 Exercise 76
Agriculture: Bell Peppers The pathogen Phytophthora capsici causes bell pepper plants to wilt and die. A research project was designed to study the effect of soil water content and the spread of the disease in fields of bell peppers (Source: Journal of Agricultural, Biological, and Environmental Statistics, Vol. 2, No. 2). It is thought that too much water helps spread the disease. The fields were divided into rows and quadrants. The soil water content (percent of water by volume of soil) was determined for each plot. An important first step in such a research project is to give a statistical description of the data.
Soil Water Content for Hell Pepper Study
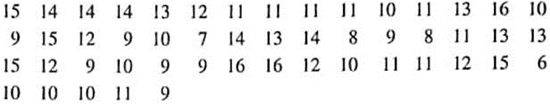
(a) Make a box-and-whisker plot of the data. Find the interquartile range.
(b) Grouped Data Make a frequency table using four classes. Then estimate the mean and sample standard deviation using the frequency table. Compute a 75% Chebyshev interval centered about the mean.
(c) If you have a statistical calculator or computer, use it to find the actual sample mean and sample standard deviation.
Soil Water Content for Hell Pepper Study
(a) Make a box-and-whisker plot of the data. Find the interquartile range.
(b) Grouped Data Make a frequency table using four classes. Then estimate the mean and sample standard deviation using the frequency table. Compute a 75% Chebyshev interval centered about the mean.
(c) If you have a statistical calculator or computer, use it to find the actual sample mean and sample standard deviation.
Explanation Verified
The given data is
Soil Water Content for...
Understanding Basic Statistics 6th Edition by Charles Henry Brase,Corrinne Pellillo Brase
Why don’t you like this exercise?
Other Minimum 8 character and maximum 255 character
Character 255


