
Understanding Basic Statistics 6th Edition by Charles Henry Brase,Corrinne Pellillo Brase
Edition 6ISBN: 978-1111827021Understanding Basic Statistics 6th Edition by Charles Henry Brase,Corrinne Pellillo Brase
Edition 6ISBN: 978-1111827021 Exercise 12
Auto Insurance: Interpret Graphs Consumer Reports rated automobile insurance companies and listed annual premiums for top-rated companies in several states. Figure 3-9 shows box-and-whisker plots for annual premiums for urban customers (married couple with one 17-year-old son) in three states. The box-and-whisker plots in Figure 3-9 were all drawn using the same scale on a TI-84Plus/TI-83Plus/TI- n spire calculator.
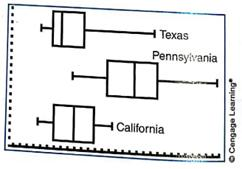
(a) Which state has the lowest premium the highest
(b) Which state has the highest median premium
(c) Which state has the smallest range of premiums the smallest interquartile range
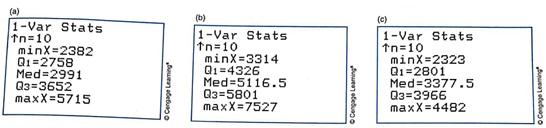
(d) Figure 3-10 gives the five-number summaries generated on the TI-84Plus/TI-83Plus/TI- n spire calculators for the box-and-whisker plots of Figure 3-9. Match the five-number summaries to the appropriate box-and-whisker plots.
(a) Which state has the lowest premium the highest
(b) Which state has the highest median premium
(c) Which state has the smallest range of premiums the smallest interquartile range
(d) Figure 3-10 gives the five-number summaries generated on the TI-84Plus/TI-83Plus/TI- n spire calculators for the box-and-whisker plots of Figure 3-9. Match the five-number summaries to the appropriate box-and-whisker plots.
Explanation Verified
Here are side-by-side boxplots represent...
Understanding Basic Statistics 6th Edition by Charles Henry Brase,Corrinne Pellillo Brase
Why don’t you like this exercise?
Other Minimum 8 character and maximum 255 character
Character 255


