
Understanding Basic Statistics 6th Edition by Charles Henry Brase,Corrinne Pellillo Brase
Edition 6ISBN: 978-1111827021Understanding Basic Statistics 6th Edition by Charles Henry Brase,Corrinne Pellillo Brase
Edition 6ISBN: 978-1111827021 Exercise 22
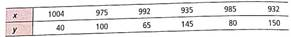
Meteorology: Cyclones Can a low barometer reading be used to predict maximum wind speed of an approaching tropical cyclone Data for this problem are based on information taken from weatherwise (vol. 46, No. 1), a publication of the American Meteorological Society. For a random sample of tropical cyclones, let x be the lowest pressure (in millibars) as a cyclone approaches, and let y be the maximum wind speed (in miles per hour) of the cyclone.
(a) Make a Scatter diagram and draw the line you think best fits the data.
(b) Would you say the correlation is low, moderate, or strong positive or negative
(c) Use a calculator to verify that x = 5823, x 2 = 5,655,779, y = 580, y 2 = 65,750, and xy = 556,315, Computer r. As x increases, does the value of r imply that y should tend to increase or decrease Explain.
Explanation Verified
(a)
Scatter Diagram:
![]() • The above scat...
• The above scat...
Understanding Basic Statistics 6th Edition by Charles Henry Brase,Corrinne Pellillo Brase
Why don’t you like this exercise?
Other Minimum 8 character and maximum 255 character
Character 255


