
Understanding Basic Statistics 6th Edition by Charles Henry Brase,Corrinne Pellillo Brase
Edition 6ISBN: 978-1111827021Understanding Basic Statistics 6th Edition by Charles Henry Brase,Corrinne Pellillo Brase
Edition 6ISBN: 978-1111827021 Exercise 28
Baseball: Batting Averages and Home Runs In baseball, is there a linear correlation between batting average and home run percentage Let x represent the batting average of a professional baseball player, and let y represent the player's home run percentage (number of home runs per 100 times at bat). A random sample of n = 7 professinal baseball players gave the following information (References: The Baseball Encyclopedia, Macmillam Publishing Comapany).
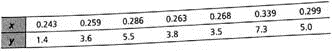
(a) Make a Scatter diagram and draw the line you think best fits the data.
(b) Would you say the correlation is low, moderate, or high positive or negative
(c) Use a calculator to verify that x = 1.947, x 2 0.553, y = 30.1, y 2 = 150.15 and xy 8.753. Computer r. As x increases, does the value of r imply that y should tend to increase or decrease Explain.
Explanation Verified
We are studying the relationship between...
Understanding Basic Statistics 6th Edition by Charles Henry Brase,Corrinne Pellillo Brase
Why don’t you like this exercise?
Other Minimum 8 character and maximum 255 character
Character 255


