
Understanding Basic Statistics 6th Edition by Charles Henry Brase,Corrinne Pellillo Brase
Edition 6ISBN: 978-1111827021Understanding Basic Statistics 6th Edition by Charles Henry Brase,Corrinne Pellillo Brase
Edition 6ISBN: 978-1111827021 Exercise 44
Expand Your Knowledge: Using a Table to Test The correlation coefficient r is a sample statistic. What does it tell us about the value of the population correlation coefficient (Greek letter rho) we will build the formal structure of hypothesis tests of in section 11.4. However, there is a quick way to determine if the sample evidence based on r is strong enough to conclude that there is some population correlation between the variables. In other words, we can use the value of r to determine if #0, we do this by comparing the value |r| to an entry in table 4-6, at the value of in the table gives us the probability of concluding that #0 when, in fact, = 0 and there is no population correlation. We have two choices for : = 0.05 or = 0.01.
PROCEDURE
HOW TO USE TABLE 4-6 TO TEST )
1. First compute r from a random sample of n data pairs ( x , y ).
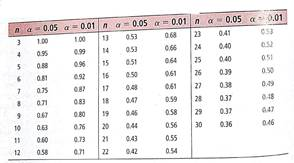
2. Find the table entry in the row headed by n and the column headed by your choice of . Your choice of is the risk you are willing too take of mistakenly concluding that # when, in fact, = 0.
3. Compare |r| to the table entry.
(a) If |r| table entry, then there is sufficient evidence to conclude that #0, and we say that r is significant. In other words, we conclude that there is some population correlation between the two variables x and y.
(b) If |r| table entry, then the evidence is insufficient to conclude that #0, and we say that r is not significant. We do not have enough evidence to conclude that there is any correlation between the two variables x and y.
Critical Values for Correlation Coefficient r
(a) Look at Problem 13 regarding the variables x = age of a Shetland pony and y = Weight of that pony. Is the value of |r| large enough to conclude that weight and age of Shetland ponies are correlated Use = 0.05.
(b) Look at Problem 15 regarding the variables x = lowest barometric pressure as a cyclone approaches and y = maximum wind speed of the cyclone. Is the value of |r| large enough to conclude that lowest barometric pressure and wind speed of a cyclone are correlated Use = 0.01.
PROCEDURE
HOW TO USE TABLE 4-6 TO TEST )
1. First compute r from a random sample of n data pairs ( x , y ).
2. Find the table entry in the row headed by n and the column headed by your choice of . Your choice of is the risk you are willing too take of mistakenly concluding that # when, in fact, = 0.
3. Compare |r| to the table entry.
(a) If |r| table entry, then there is sufficient evidence to conclude that #0, and we say that r is significant. In other words, we conclude that there is some population correlation between the two variables x and y.
(b) If |r| table entry, then the evidence is insufficient to conclude that #0, and we say that r is not significant. We do not have enough evidence to conclude that there is any correlation between the two variables x and y.
Critical Values for Correlation Coefficient r
(a) Look at Problem 13 regarding the variables x = age of a Shetland pony and y = Weight of that pony. Is the value of |r| large enough to conclude that weight and age of Shetland ponies are correlated Use = 0.05.
(b) Look at Problem 15 regarding the variables x = lowest barometric pressure as a cyclone approaches and y = maximum wind speed of the cyclone. Is the value of |r| large enough to conclude that lowest barometric pressure and wind speed of a cyclone are correlated Use = 0.01.
Explanation Verified
(a)
Where x= age of a Shetland pony and ...
Understanding Basic Statistics 6th Edition by Charles Henry Brase,Corrinne Pellillo Brase
Why don’t you like this exercise?
Other Minimum 8 character and maximum 255 character
Character 255


